Market Masters Worksheet The Market Ledger
Daily Financial Education Edition • April 2026
NAME: __________________________
DATE: ___________________________
Market Masters Simulation
NYSE: ▲ 2.4% NASDAQ: ▲ 1.8%
I. Decoding the Street
Fill in using: Ticker Symbol, Bull Market, Bear Market, Index Fund, Individual Stock.
1. A ________________________ represents ownership in one single specific company.
2. A market where prices are rising and investors are optimistic: ________________________.
3. A unique 3-4 letter code used to identify a company: ________________________.
4. A market where prices fall and investors are pessimistic: ________________________.
5. A "basket" of many different stocks bought together: ________________________.
II. Your $1,000 Portfolio
Allocate your funds. You must spend exactly $1,000 .
Investment Type Allocation ($) Your Rationale Tech Giant (TCHG) Energy Sector (NRGY) Index Fund (SPY) TOTAL INVESTED $1,000
III. Performance Tracker
Year 1: Boom
TCHG Balance (+25%)
NRGY Balance (+10%)
SPY Balance (+15%)
Year 1 End Total:
$
Year 2: Squeeze
TCHG Balance (-30%)
NRGY Balance (+5%)
SPY Balance (-10%)
Final Portfolio Value:
$
IV. Investor Reflection
1. Compare the Performance: In Year 2, NRGY rose while TCHG fell. How did owning an Index Fund (SPY) protect you compared to owning ONLY Tech stocks?
2. Market Sentiment: Which market (Bull vs. Bear) is easier to stay invested in? Why is it important to keep your money in the market even during the "Bear" years?
Market Masters Slides Market Masters
Decoding the Stock Market
What is the Stock Market?
Ownership
Buying a share of stock means you own a tiny piece of a real company.
The Exchange
A digital marketplace where buyers and sellers trade those pieces.
WHY DO IT?
Companies get money to grow, and investors (you!) hope to share in their profits.
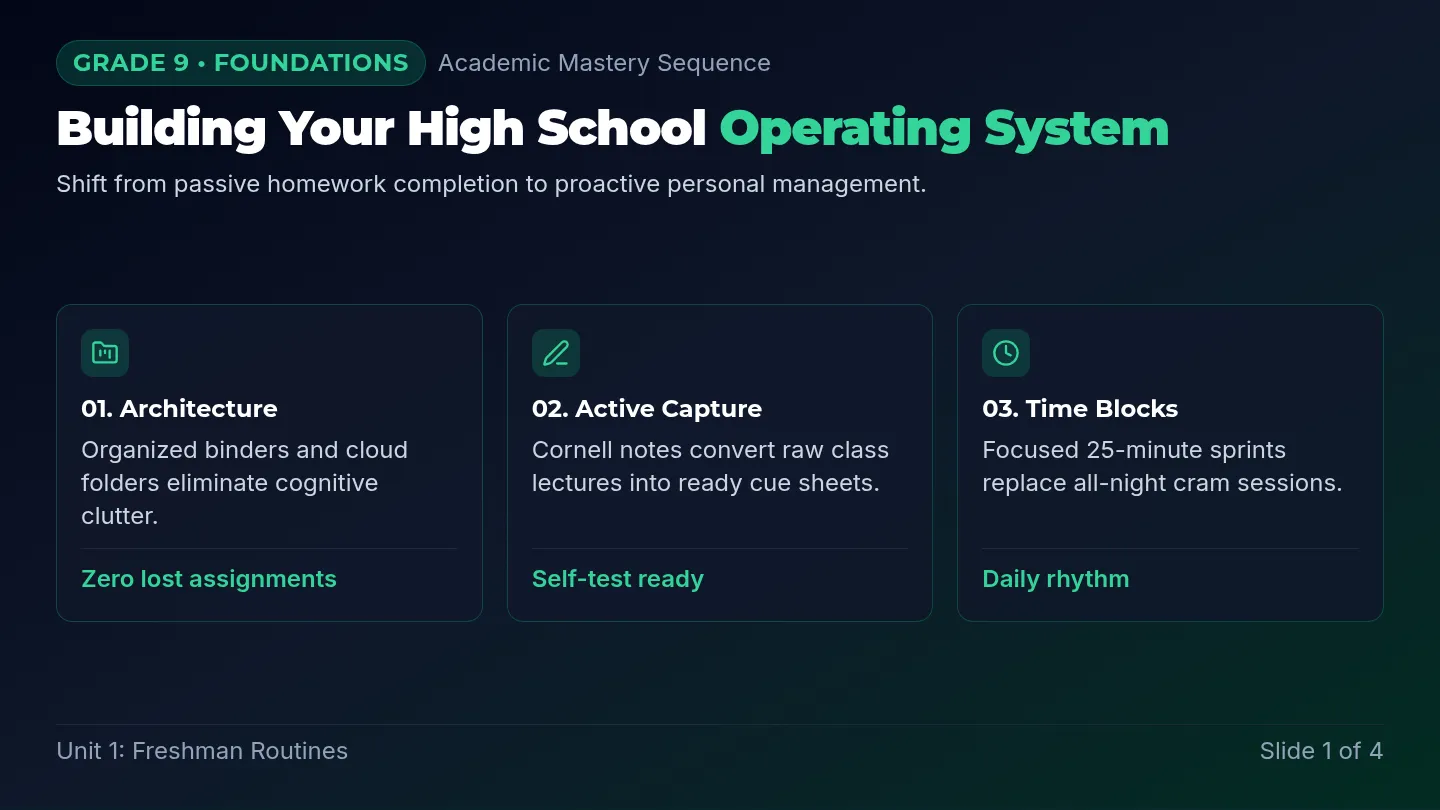
Ticker Symbols: The Shorthand
AAPL
Apple Inc.
DIS
Disney
NFLX
Netflix
"Think of it as a nickname. Instead of saying 'International Business Machines,' we just say IBM."
Bulls vs. Bears
BULL
"Charging Up!"
A market where prices are rising. Bull's horns thrust UP .
BEAR
"Hibernating Down..."
A market where prices are falling. Bear's paws swipe DOWN .
Individual Stocks vs. Index Funds
1
Individual Stock
Buying one specific company. Higher risk, but potentially higher reward.
Example: Only buying Starbucks.
2
Index Fund
Buying a "basket" of hundreds of companies. Lower risk through diversification.
Example: Buying the S&P 500 (the 500 biggest US companies).
Simulation Launch!
Grab your Market Ledger worksheet. You have $1,000 to build your future.
Choose Your Stocks
Face the Market
Track Your Gains
Market Masters Teacher Guide Market Masters: Facilitator Guide
A Stock Market Investment Simulation
Vocabulary Key
Individual Stock: Ownership in a single specific company.Bull Market: A period where prices are rising and optimism is high.Bear Market: A period where prices are falling and pessimism is high.Ticker Symbol: A 3-4 letter code identifying a company.Index Fund: A "basket" of stocks bundled for diversification.
Objectives
Understand basic stock market terminology.
Calculate portfolio values based on percentage changes.
Analyze risk-mitigation through diversification.
Market Simulation Events
Year 1: The Innovation Boom (Bull Market)
"Excitement is in the air! Breakthroughs in AI and sustainable energy have sparked a buying frenzy. Investors are feeling like 'Bulls'—confident and charging ahead!"
TCHG Balance
+25%
NRGY Balance
+10%
SPY Balance
+15%
Year 2: The Supply Squeeze (Bear Market)
"The mood has shifted. Supply costs are rising, and tech sales have slowed. However, traditional energy (NRGY) is holding steady. It's a Bear Market!"
TCHG Balance
-30%
NRGY Balance
+5%
SPY Balance
-10%
Post-Market Discussion
Question 1: The 'Basket' Effect
"In Year 2, why did the SPY Index fund lose much less money than the TCHG stock?"
Guidance: Focus on the mix. Because SPY contains hundreds of stocks (including energy), it protected the investor from the heavy tech loss.
Question 2: Psychological Resilience
"Which year was harder to watch? Why do some investors choose to sell everything when they see red numbers?"
Guidance: Discuss 'loss aversion'. Humans feel the pain of losing more than the joy of gaining. Long-term thinking is key.
Instructional Support
Math Scaffolding
Formula: New Balance = Old Balance × (1 ± Decimal). Example: $100 + 25% = 100 × 1.25. Encourage calculator use.
Extension
Find real Ticker Symbols for 3 major companies. Check if they are in a "Bull" or "Bear" trend over the last month.