Coordinate Quest Slides Coordinate Quest
Navigating the United States with Grid Systems
4th Grade Geography Lesson 1
Mission: Search & Rescue
"Dispatch to Team Alpha! A research hiker is lost in the mountains. We have their last known location: 40°N, 105°W. Can you find them on the map before the storm hits?"
How do we use these numbers to find a specific spot on Earth?
GRID MAP VIEW
Reading the Earth's Grid
Latitude
Lines run East to West (like a ladder).
Measure North and South of the Equator .
Mnemonic: Latitude is like LADDER -tude.
Longitude
Lines run North to South (tall lines).
Measure East and West of the Prime Meridian .
Mnemonic: Longitude is LONG from top to bottom.
The Secret Formula
Step 1
40° N
Find the Latitude Line
Step 2
105° W
Find the Longitude Line
The X
Denver, Colorado
Let's Try It!
Use your classroom map or textbook to find the city at:
34° N, 118° W Checking coordinates...
42° N, 88° W Scanning grid...
25° N, 80° W Location found?
Hint: Look at the edges of your map for the degrees symbols!
Coordinate Hunt Worksheet Search & Rescue Dispatch
Official Field Document: Unit 1, Lesson 1
Agent Name:
Date:
Mission Briefing
Dispatch reports multiple hikers have sent distress signals across the United States. Your mission is to use your Latitude (North) and Longitude (West) skills to plot their locations on your map and identify the nearest city for rescue teams.
Part 1: Intercepted Coordinates
Use a US map with a latitude/longitude grid to identify the city closest to these coordinates.
1
Coordinate
47° N, 122° W
Nearest City / State
2
Coordinate
30° N, 90° W
Nearest City / State
3
Coordinate
40° N, 74° W
Nearest City / State
4
Coordinate
36° N, 115° W
Nearest City / State
Part 2: Finding the Source
We know where the help is needed, but we need coordinates to send the helicopter. Find the lat/long for these locations.
Location A: Salt Lake City, Utah
LATITUDE:
° N
LONGITUDE:
° W
Location B: Atlanta, Georgia
LATITUDE:
° N
LONGITUDE:
° W
Part 3: Field Observation
If two locations have the same Latitude but different Longitudes , are they North/South of each other or East/West of each other? Explain how you know.
End of Dispatch // Document ID: S&R-001
Coordinate Quest Teacher Guide Teacher Facilitation Guide
Lesson 1: Coordinate Quest
ANSWER KEY & TIPS
Learning Objective
Students will be able to use latitude and longitude coordinates to identify specific cities in the United States and determine coordinates for given locations with +/- 1 degree accuracy.
Materials Needed
• Coordinate Quest Slides
• Student Worksheets
• Physical US Maps or Atlases
Instructional Pacing
10 min
The Hook (Search & Rescue)
Introduce the mission using the slides. Emphasize that latitude and longitude are the "Global GPS" used by real explorers and rescue teams.
15 min
Concept Building
Teach Latitude (flat lines) vs. Longitude (long lines). Use the "ladder" mnemonic. Practice finding one location together as a class before handing out worksheets.
20 min
Field Work (Practice)
Students complete the Coordinate Hunt worksheet. Monitor for students who may be flipping latitude and longitude (putting Longitude first).
Worksheet Answer Key
Part 1: Intercepted Coordinates
Coordinate Correct Location 47° N, 122° W Seattle, Washington 30° N, 90° W New Orleans, Louisiana 40° N, 74° W New York City, New York 36° N, 115° W Las Vegas, Nevada
Part 2: Finding the Source
Salt Lake City, UT:
~41° N, 112° W
Atlanta, GA:
~34° N, 84° W
Part 3: Field Observation
"If two locations have the same Latitude but different Longitudes, they are East/West of each other. This is because latitude lines are parallel horizontal lines, so staying on the same line means moving only left or right across the map."
Common Misconception
Students often mistake the "long" in Longitude to mean long lines (vertical), which is correct, but then think they measure North/South because the lines go that way. Remind them that Longitude lines are like pieces of an orange—they tell you how far "around" (East/West) the world you are.
Map Detective Slides Map Detective
Uncovering the Invisible Boundaries of the U.S.
Lesson 2
Mystery Image: Midnight USA
Imagine a photo of the US from Space at night...
The Clue:
Why are some parts of the country glowing with bright lights, while other parts are completely dark?
"The lights don't follow state lines... they follow the land."
The Two Maps
Political Map
Shows human-made borders
Focuses on states and cities
Uses different colors for states
Physical Map
Shows natural landforms
Mountains, rivers, and plains
Uses color for elevation/nature
Layering the Clues
State lines often follow rivers or mountains!
Nature's Fence
Before we had fancy fences, geographers used these "Natural Boundaries":
Rivers
The Mississippi River splits the country in half!
Mountains
The Appalachians acted as a wall for early explorers.
Coastlines
The Atlantic and Pacific are the ultimate boundaries.
Detective Mission
Grab your "Detective's Log." We are going to find 5 places where a state line is actually a mountain or a river!
Phase 1
Investigate Maps
Phase 2
Log the Evidence
Map Detective Worksheet Official Evidence Log // Bureau of Cartography
Map Detective
Case File #2: The Hidden Boundaries
Detective:
Date:
Subject ID
The Assignment:
Compare a Physical Map (landforms) and a Political Map (borders). Your goal is to prove that many state lines weren't just drawn randomly—they follow nature's leads. Identify 4 "Natural Boundaries" where landforms and borders match up.
Evidence Collection
LOG 01
State / Region:
Natural Landform Used:
Found on physical map?
LOG 02
State / Region:
Natural Landform Used:
Found on physical map?
LOG 03
State / Region:
Natural Landform Used:
Found on physical map?
LOG 04
State / Region:
Natural Landform Used:
Found on physical map?
Detective's Summary
Look at the states in the Midwest (like Kansas, Nebraska, and Iowa). Are their borders mostly straight lines or wiggly natural lines? Why do you think that is?
Case File: 4-GEO-2 CONFIDENTIAL // FOR CLASSROOM USE ONLY Page 1 of 1
Map Detective Teacher Guide Teacher Facilitation Guide
Lesson 2: Map Detective
Instructor's Manual
Teaching Strategy: Comparative Inquiry
This lesson focuses on Spatial Association —helping students see why human decisions (borders) often follow physical realities (landforms). By comparing maps, students discover that geography dictates where people live and how they organize space.
Key Discussion Question
"If you were a person 200 years ago with no car and no GPS, why would a river make a better state border than an invisible line in the dirt?"
The Night Hook
The "Night Lights" slide illustrates population density. Students should notice lights avoid mountains (Rockies) and follow coastlines/major rivers.
Evidence Log Answer Key
Possible student answers (accept any valid physical boundary):
Example 1
State: New York / Vermont
Landform: Lake Champlain
Example 2
State: Arizona / California
Landform: Colorado River
Example 3
State: Maryland / Virginia
Landform: Potomac River
Example 4
State: Illinois / Missouri
Landform: Mississippi River
Detective's Summary Prompt:
Answer: Midwest states like Kansas or Nebraska have mostly straight lines. This is because the Great Plains are flat, so there were fewer major physical obstacles (like high mountains or impassable rivers) to use as markers. These borders were often drawn using latitude and longitude lines instead.
Extension Idea
Have students use Google Earth to zoom in on the Mississippi River where it forms a state border. Ask them to find a place where the river moved over time, but the state border stayed the same (oxbow lakes).
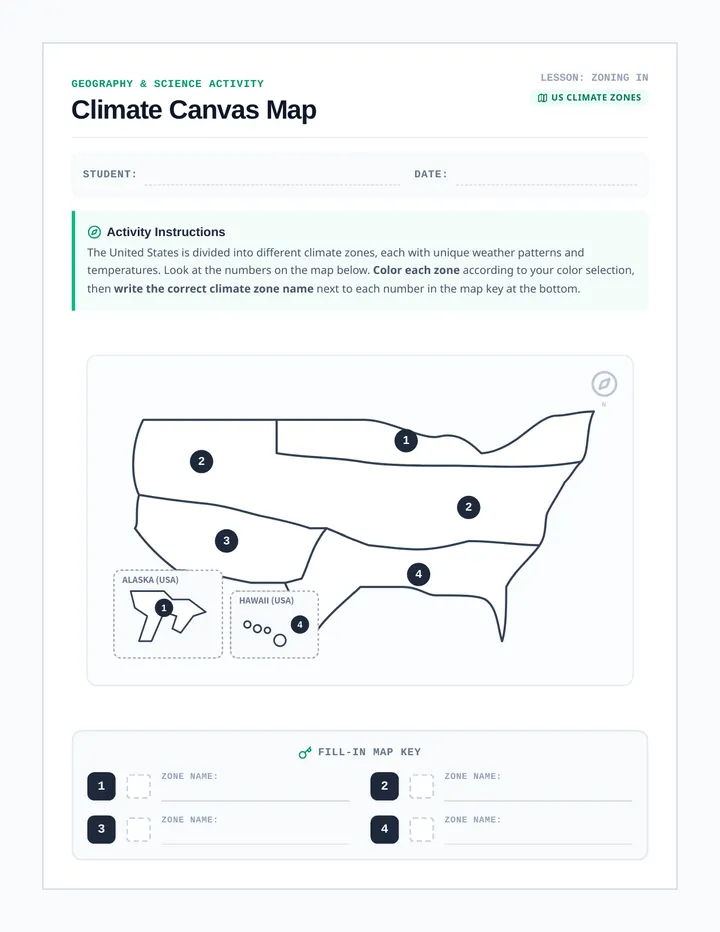
Climate Connections Slides Climate Connections
How Weather and Soil Define Our World
Lesson 3
The Great US Mix-Up
Match these photos to their location on the map!
A: Hot & Dry Desert
B: Humid Coastal Marsh
C: Cold Alpine Tundra
"Why can't a cactus grow in the New York marsh?"
Temperature
Precipitation
US Climate Zones
Arid (Dry)
Very little rain. High temperatures in day, low at night. Found in the Southwest.
Humid Subtropical
Hot, muggy summers and mild winters. Lots of rain. Found in the Southeast.
Humid Continental
Four distinct seasons. Snowy winters and warm summers. Found in the Northeast and Midwest.
MAP VIEW
Imagine these zones layered over state lines...
Nature's Blanket: Vegetation
Climate determines what grows. What grows determines what animals (and people) live there.
Forests
Need regular rainfall. Northeast & Southeast.
Grasslands
Moderate rain. The "Breadbasket" (Midwest).
Desert Scrub
Can store water. Found in the Southwest.
Tundra
Frozen soil. High mountains & far North.
Environmental Scientist Training
Time to analyze the data. Use your "Climate Lab Report" to connect the weather patterns of each region!
Goal: Explain how climate helps geographers group states into regions.
Climate Lab Report Worksheet Lab Report: ENV-003
Climate Lab Report
Subject: Analyzing Regional Weather Patterns
Scientist:
Date:
Part 1: Regional Climate Data
Study the table below showing typical weather for three mystery cities in different regions.
Mystery City Summer Temp Winter Temp Precipitation City X 95° F 45° F Very Low (Dry) City Y 90° F 55° F Very High (Humid) City Z 75° F 20° F Moderate (Snowy)
IDENTIFY CITY X:
(Which region is dry & hot?)
IDENTIFY CITY Y:
(Which region is humid & hot?)
IDENTIFY CITY Z:
(Which region has cold winters?)
Part 2: The Green Link
Geographers often use vegetation to help define regional boundaries. Look at the photo descriptions and choose the climate they belong in.
Observation: Dense Pine & Maple Forests
Needs regular rain and 4 distinct seasons.
Arid
Continental
Observation: Scrub Brush & Saguaro Cactus
Needs very little water; survives high heat.
Arid
Tropical
Observation: Tall Grass Prairies (Grasslands)
Moderate rain; flat land; deep soil.
Tundra
Continental
Summary Conclusion
Why do you think geographers group states together based on their climate? How does the climate affect how people in that region live?
Verified by the Department of Climatology // Document ENV-4-3
Climate Connections Teacher Guide Teacher Facilitation Guide
Lesson 3: Climate Connections
Instructor's Manual
Teaching Strategy: Environmental Logic
The goal of this lesson is to move from "reading a map" to "interpreting data." Students should begin to see that regions aren't just collections of states—they are areas that share environmental traits.
Misconception Alert
Students often confuse weather with climate . Remind them: "Weather is what you wear today; Climate is what's in your closet."
Visual Connection
When discussing vegetation, show photos of "The Breadbasket" (Midwest) vs. "The Sun Belt" (Southwest/Southeast). Ask how the vegetation might affect the jobs people have in those areas (farming vs. tourism).
Lab Report Answer Key
Part 1: Regional Climate Data
City X
Southwest (Arid)
City Y
Southeast (Humid)
City Z
Northeast / Midwest
Part 2: The Green Link
Forests: Humid Continental
Cactus: Arid
Grasslands: Continental / Moderate
Summary Conclusion
Accept answers that mention: Humans group states by climate because it helps us understand the resources available (crops, water) and how people need to build houses or dress. It helps geographers organize the world into "rooms" that share similar characteristics.
Climate Mystery Bag
Bring in items representing different climates (sunscreen, snow mitten, umbrella, sand) and have students place them on a classroom map in the correct climate zones.
Regional Boundaries Slides Regional Boundaries
Categorizing the United States
Lesson 4
The Great State Sort
Imagine you have 50 puzzle pieces, but no picture of the finished puzzle. How would you group them together?
By Landforms?
By Climate?
FL
NY
TX
CA
IL
Sorting in Progress...
The 5 Regions of the U.S.
Northeast
Forests
Cold Winters
Rocky Coasts
Southeast
Midwest
Flat Plains
Farming
Great Lakes
Southwest
Deserts
Arid/Hot
Plateaus
West
Mountains
Varied
Redwoods
Remember: These are grouped because they share Physical and Environmental traits!
What makes a Region?
Location
Where it is on the compass.
Landforms
Plains, mountains, or valleys.
Climate
Average weather over time.
Geographer's Secret:
State borders are human-made , but regions are geographer-made to help us organize and study the massive size of the United States!
Reference Map Creation
Time to build your master reference. We will color-code the 5 regions and label the anchor states.
Regional Master Map Worksheet Master Regional Map
Classroom Reference Document // Geographic Unit 1
Geographer:
Date:
Mapping Protocol
Using your classroom map, color-code the states in each region according to the key below. Then, label the Major Anchor Cities marked with an 'X' on your map.
Map Activity Space
(Color states and label anchor cities here)
Region Key
NORTHEAST
Maine to Pennsylvania
SOUTHEAST
Virginia to Florida
MIDWEST
Ohio to Kansas
SOUTHWEST
Texas, OK, NM, AZ
WEST
Montana to Hawaii
Anchor Cities
• New York City
• Atlanta
• Chicago
• Dallas
• Los Angeles
Region Checkpoint
Which region do you think is the largest by land area? Why do you think that region has fewer states than some smaller regions (like the Northeast)?
Property of Classroom Cartography // Ref-4-A
State Sort Cards Printable Activity: State Sort Cards
Lesson 4 Hook / Support Material
Instructions: Cut along the dotted lines. Use these cards for the "State Sort" game. Students should group cards together based on the clues provided before seeing the official regional map.
MAINE
Clue: Cold, snowy winters and a rocky coastline with many pine forests.
FLORIDA
Clue: Low elevation with many swamps and very humid, tropical weather.
IOWA
Clue: Flat plains as far as you can see; home to thousands of corn farms.
ARIZONA
Clue: Dry, hot air and colorful red rock canyons with very little rain.
CALIFORNIA
Clue: Massive mountain ranges and a long coastline on the Pacific Ocean.
TEXAS
Clue: A very large state with hot weather, plateaus, and dry plains.
Teacher Tip
You can print multiple sets and have students work in groups. If they struggle, give them a hint about the 5 region names (NE, SE, MW, SW, West) and see if that helps them sort the cards.
Regional Boundaries Teacher Guide Teacher Facilitation Guide
Lesson 4: Regional Boundaries
Instructor's Manual
The Synthesis Lesson
This is the "aha!" moment of the unit. Students take the disparate pieces of data from Lessons 1-3 (location, landforms, climate) and see how geographers use them to create the five official regions.
Lesson Flow
15 min
State Sort (Hook)
Hand out the cards. Don't tell them the regions yet. Let them struggle with "how to group these." This builds spatial reasoning and pattern recognition.
15 min
The Big Reveal
Use the slides to introduce the 5 regions. Compare their sorts to the "official" version. Discuss why certain states (like Texas or Maryland) can be tricky to place.
25 min
Cartography Workshop
Students create their Master Regional Maps. This will be an anchor document used in Lesson 5 and throughout the rest of the unit.
Differentiation Tips
Scaffolded Support
Give students a map that already has the regional boundaries drawn, and they focus on coloring and labeling only.
Extension Challenge
Have students identify "Sub-regions" (e.g., separating the Pacific Northwest from California/the Southwest).
Master Map Checklist
Northeast
ME, NH, VT, MA, RI, CT, NY, NJ, PA
Southeast
MD, DE, WV, VA, KY, TN, NC, SC, GA, FL, AL, MS, AR, LA
Midwest
OH, IN, IL, MI, WI, MN, IA, MO, ND, SD, NE, KS
Southwest
OK, TX, NM, AZ
West
MT, WY, CO, ID, UT, NV, WA, OR, CA, AK, HI
Region Profiles Slides Region Profiles
Synthesizing Our Geographic Discoveries
Lesson 5: Final Project
Where in the US is This?
"Dear Class, I'm standing in a place where the air is incredibly humid and the Spanish moss is hanging from every tree. I can see a swamp in the distance and it's 90 degrees in October! Where am I?"
- Mystery Traveler
What clues gave it away?
Climate: Humid & Hot
Vegetation: Spanish Moss & Swamps
Conclusion: SOUTHEAST
Region Profile Project
You are now travel experts! Your team will create a profile for one US region.
Location
Major states and relative location.
Landforms
Mountains, rivers, and plains.
Climate
Average weather and rainfall.
Unique Fact
Something only found there.
Putting it all together
Don't just list facts—explain the connection !
The Golden Rule:
"Because the [Landform] is here, the [Climate] is like this, which makes the [Region] unique."
1
Look at your Map Detective notes.
2
Check your Climate Lab data.
3
Use your Regional Map as a guide.
Expedition Teams: Deploy!
Open your project folders and start your Region Profile cards. Travel agents, to your stations!
Presentation Day is Coming!
Region Profile Template Region Profile Card
Travel Expert Final Project // Document PRO-5
Team Assigned Region
Team Members:
Date:
I. Regional Location
List the major states in this region and describe where it is located on a compass.
II. Landforms & Water
What mountains, rivers, plains, or oceans define this region?
III. Representative Scene
Sketch a typical scene here
(Include landforms and vegetation)
IV. Climate Profile
Describe the average temperature, seasons, and precipitation.
V. Vegetation & Ecosystem
What kind of plants and trees grow here? Why?
The Expert's Conclusion
How do the physical features of this region (landforms/climate) make it different from its neighbors?
Expedition Report // Verified Geographic Data
Region Profiles Teacher Guide Teacher Facilitation Guide
Lesson 5: Region Profiles Project
Instructor's Manual
The Performance Task
This final lesson serves as a summative assessment. Students must demonstrate their ability to synthesize physical and environmental data to define and describe a specific US region.
Grading Rubric
Criteria Excellent (4) Good (3) Developing (2) Accuracy All data (states, landforms, climate) is 100% accurate. Mostly accurate; 1-2 minor errors. Several errors in geography or data. Synthesis Clearly explains the link between landforms and climate. Mentions landforms and climate but lacks deep connection. Lists facts separately without connections. Presentation Profile card is visually organized and fully completed. Mostly complete; some areas lack detail. Messy or missing several sections.
Group Management
Assign regions to teams of 3-4. Give each student a "specialty" (e.g., The Climatologist, The Cartographer, The Landform Specialist) to ensure everyone contributes their specific knowledge.
Reflection Questions
As teams present, ask the rest of the class to compare the presented region to their own. "How is the climate in the Southwest different from the Midwest? How does that change their farms?"
Mystery Postcard Hook Key
Postcard 1 (Southeast):
"Spanish moss... humid... October 90 degrees..."
Postcard 2 (Northeast):
"Rocky cliffs... lobster for dinner... freezing snow in Jan..."
Postcard 3 (West):
"Redwoods... massive mountains... the Pacific Ocean..."
Postcard 4 (Midwest):
"Corn fields for miles... Great Lakes... very flat..."