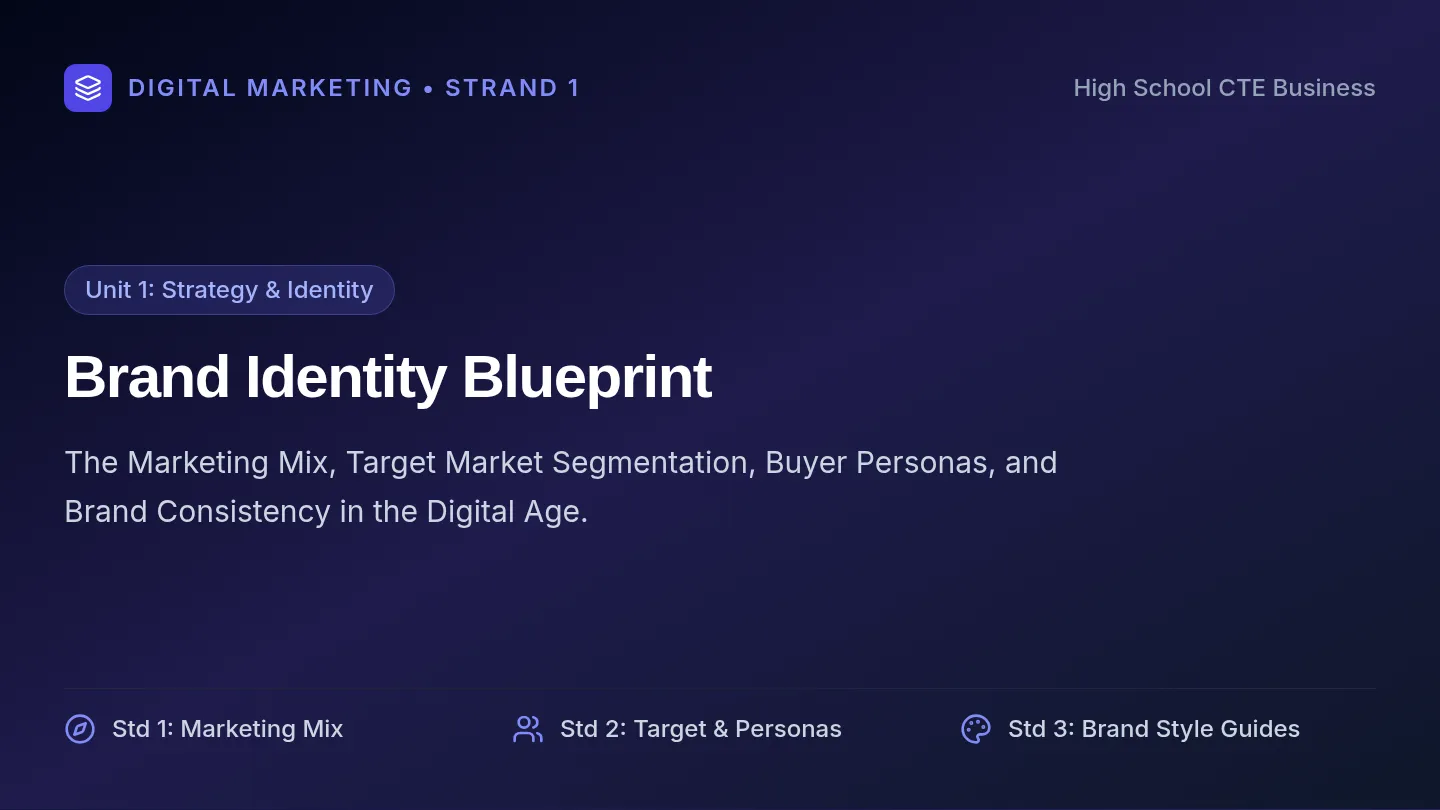
Ticker Tactics Slides
Stock Market Game Edition
NYSE // NASDAQ // SMG LAB
Mastering the Exchange
Ticker Tactics:
Decoding the Market
From 1792 Wall Street tree agreements to skyscraper ribbons and live digital charts: uncover ticker symbols, compare exchanges, decode price momentum, and make smart buy/sell moves.
MARKET PULSE:
AAPL +1.84% ▲ DIS -0.72% ▼ NVDA +3.15% ▲ KO +0.28% ▲
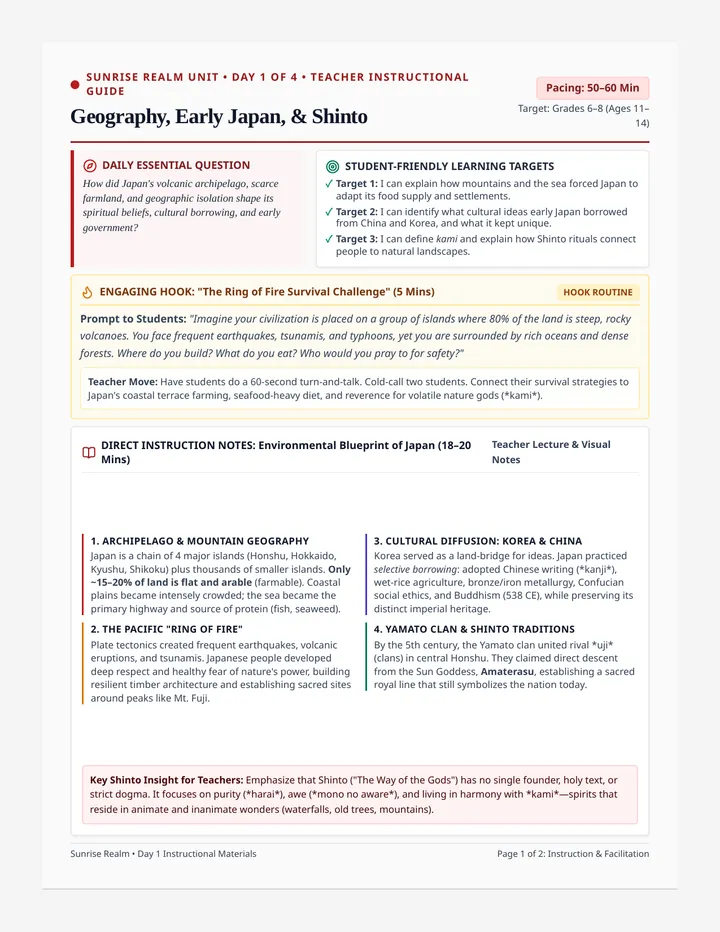
Historical Roots
How Wall Street Began: The NYSE
1792 • 68 Wall Street
1792
The Buttonwood Pact
24 stockbrokers met under a buttonwood tree at 68 Wall Street, signing an agreement to trade securities only with each other.
Built on rules & trust
1867
The Ticker Tape
Edward Calahan invented the stock ticker. Telegraphs printed prices on paper tape with a loud ticking sound, coining "tickers."
Instant national prices
TODAY
Digital Hybrid
Human floor brokers still ring the bell at 11 Wall Street, but millions of trades now execute in microseconds across servers.
Microsecond liquidity
Why an exchange? It creates a centralized marketplace so everyone sees identical, fair market prices.
Specimen Examination
The Tape Up Close: Vintage vs. Modern
1867 vs. Modern Era
1867 MECHANICAL TAPE 15-Min Telegraph Lag
NYC 128 1/4 • PRR 52 3/8 • X 114 1/2
WU 68 1/8 BO 44 1/2 DIS 31 3/4
- • Paper Ribbon: Inked telegraph wheel printout.
- • Fractions: Quoted in 1/8th dollars ($0.125).
- • Delivered by running messenger boys.
Source of famous NYC "Ticker Tape Parades"
2020s DIGITAL LED TAPE Microsecond Speed
AAPL 228.50 ▲ NVDA 128.00 ▲
MSFT 418.20 ▼ TSLA 250.08 ▲
- • Optical Pixels: Fiber-optic internet stream.
- • Decimals: Exact pennies ($0.01) with color cues.
- • Streams directly to your SMG dashboard.
Switched from fractions to decimals in April 2001
From 15-minute delayed paper printouts to microsecond digital streams worldwide. Live Data in SMG
Cultural Legacy
The Ticker Tape Parade: Canyon of Heroes
Broadway & Wall Street
LOWER MANHATTAN CANYON Oct 28, 1886 • First Parade
Add Ticker Parade Photo
Office workers hurled spent telegraph spools out 40-story windows!
1 Born During the Statue of Liberty Parade (1886)
Wall Street brokers looked out windows at marching crowds and impulsively threw miles of spent ribbon into the street.
2 Thousands of Tons of Paper
Aviator Charles Lindbergh was showered with 1,750 tons of tape in 1927. Apollo 11 astronauts received over 3,000 tons in 1969!
3 The Tradition Lives On
Today, celebrations still carry the name "Ticker Tape Parade", using shredded recycled paper instead of telegraph tape.
Over 200 parades have marched up Broadway's Canyon of Heroes to celebrate world heroes. From Waste to World Fame
Everyday Financial Media
The Ticker Everywhere: Buildings & Broadcasts
Public Market Displays
Times Square Building Tower 7-Story Curved Glass
One Times Square and NASDAQ MarketSite wrap giant curved electronic ribbons around Manhattan street corners.
ONE TIMES SQUARE LIVE 24/7
NASDAQ +1.4% ▲ AAPL 228.50 ▲
NVDA 128.00 ▲ TSLA 250.08 ▼
Over 330,000 pedestrians view prices daily without checking a screen.
Television Financial "Chyron" CNBC / Bloomberg
Networks maintain continuous scrolling tickers at the screen bottom while commentators speak.
Add TV Broadcast Image
Allows instant scanning in muted settings like offices, airports, and gyms.
Moving ticker ribbons keep investors informed effortlessly in everyday public spaces. Continuous Market Awareness
Clash of the Exchanges
Tale of Two Giants: NYSE vs. NASDAQ
Auction vs. Dealer Network
EST. 1792 • "THE BIG BOARD" 11 Wall Street, NYC
New York Stock Exchange
An Auction Market with a Physical Trading Floor
- Trade Model: Designated Market Makers (DMMs) facilitate auctions.
- Listings: Established blue chips, industrials, consumer giants.
- Tickers: Historically 1 to 3 letters (F, DIS, KO).
Listings: Ford • Coca-Cola • Disney
EST. 1971 • 100% ELECTRONIC Virtual Network
NASDAQ
A Dealer Market (Computer Telecommunications)
- Trade Model: Multiple electronic dealers compete on bid/ask spread.
- Listings: Tech giants, cloud software, biotech innovators.
- Tickers: Historically 4 or 5 letters (AAPL, MSFT, NVDA).
Listings: Apple • Microsoft • Nvidia
Acronym: National Association of Securities Dealers Automated Quotations. Trade Both in SMG
Market Language
Cracking the Ticker Symbol Code
1 to 5 Letters
1 Character Count Exchange Clues
- 1–3 Letters: NYSE roots (F = Ford, KO = Coca-Cola).
- 4–5 Letters: NASDAQ roots (MSFT = Microsoft, AAPL = Apple).
2 Clever & Memorable Tickers
Companies pick fun symbols: LUV (Southwest), HOG (Harley-Davidson), WOOF (Petco), CAKE (Cheesecake Factory).
Simulated Quote Terminal
AAPL
Apple Inc. • NASDAQ
Last Price $228.50
Day Change +1.52% ▲
SMG Warning: Always verify company full name. A single letter typo can buy the wrong company!
Check your SMG portfolio: Are your holdings 1–3 letter or 4+ letter tickers?
Technical Vision
Interpreting Price Trends & Ranges
Reading the Tape
52-Week Range
Highest and lowest price a stock traded at over the past 365 days.
Low: $110 High: $195
Now: $175 (Near High)
Shows current strength vs. historical extreme.
The 3 Big Trends
- ▲ Uptrend: Higher highs & higher lows.
- ▼ Downtrend: Lower lows & lower highs.
- ▬ Sideways: Range consolidation.
"The trend is your friend!"
Zooming Out
A single red day doesn't ruin a strong stock. Always check 1-month and 3-month charts!
Don't let 1-day noise trigger emotional panic sells.
Patience beats panic in SMG.
Green = Price gain • Red = Price decline • % Change compares price to purchase base Look Beyond 1 Day
Trade Execution
The Art of the Trade: Buy vs. Sell
Strategy & Timing
When & Why to BUY
- Strong Fundamentals: Growing revenue, customer demand, and real earnings.
- Buying Dips: Great business drops temporarily on broad market news.
- Sector Diversification: Spreading risk across healthcare, tech, energy.
Market Order: Instant price • Limit Order: Fixed target price
When & Why to SELL
- Taking Profit: Hit your price goal! Lock it in before pullbacks.
- Cutting Losses: Down 7–10% and company thesis is broken.
- Opportunity Cost: Better investment needs available cash.
Realized: Sold for cash • Unrealized: Still on paper
SMG Tip: Idle cash loses to inflation, but frequent rapid overtrading incurs unnecessary trading commissions!
Live Guided Practice
Your Mission: The SMG Portfolio Audit
Class Activity
01
Log In & Pick 2 Stocks
Open your Stock Market Game portfolio. Select 2 stocks you currently own.
Account access
02
Inspect Tickers
Record exact ticker, exchange (NYSE vs NASDAQ), and verify company name.
Verify symbols
03
Chart Ranges
Look up price, 52-week High/Low, and determine if 1-month trend is up or down.
Analyze momentum
04
Make the Call
Choose your next tactical move: BUY MORE, HOLD, or SELL with a written thesis!
Tactical decision
Complete Part 3 on your printed Portfolio Lab sheet!
Time: 15–20 Minutes
Review & Debrief
Market Close: The 3 Big Takeaways
Final Bell
#1
Exchanges & Tickers
NYSE is an auction market (1-3 letters, blue chips). NASDAQ is a dealer network (4-5 letters, tech leaders).
Structure shapes the market.
#2
Zoom Out on Trends
Single red days don't dictate success. Always evaluate 52-week ranges and multi-month trends before trading.
Patience beats panic.
#3
Plan Your Exit
Know in advance when you will sell: taking target profits or cutting a loss when your thesis is invalidated.
Discipline makes traders.
Exit Check: If your stock gained 15% this week, is that profit already real money in your SMG account? (Unrealized vs Realized!)
Answer on Lab
Ticker Tactics Portfolio Lab
Stock Market Game • Student Investigation
Ticker Tactics: Market Decoding Lab
NAME:
D: PERIOD:
SMG TEAM ID:
PART 1
Historical Roots & Ticker Anatomy
1. The Buttonwood Agreement (1792):
Why did 24 stockbrokers establish a formal agreement under a tree on Wall Street instead of trading informally?
2. Birth of the "Ticker Tape" (1867):
Why was Edward Calahan's mechanical ticker machine called a "ticker", and how did it change trading?
Ticker Length Decoder: Complete the table below. (Hint: NYSE historically used 1-3 letters; NASDAQ used 4-5 letters).
| Company Name | Ticker Symbol | Letter Count | Likely Primary Exchange |
|---|
| The Walt Disney Company | DIS | 3 | NYSE |
| Microsoft Corporation | MSFT | | |
| Ford Motor Company | F | | |
| Alphabet Inc. (Google) | GOOGL | | |
PART 2
Interpreting Price Trends & Ranges
NVDA NVIDIA Corporation • NASDAQ
$128.00 +3.84 (+3.09%) ▲
PREV CLOSE
$124.16
DAY RANGE
$123.50 - $129.10
52-WK LOW
$45.50
52-WK HIGH
$140.76
3. 52-Week Range Position: Is NVDA trading closer to its 52-week low or its 52-week high? What does this suggest about investor sentiment over the past year?
4. Trend Classification: If a stock experiences "higher highs" and "higher lows" on a 3-month chart, which trend is it displaying?
Uptrend (Bullish) Downtrend (Bearish) Sideways / Consolidation
5. The "1-Day Trap": A student logs into The Stock Market Game and sees their stock is down 2.4% today (red). Explain why selling immediately based only on today's price change might be a mistake.
Ticker Tactics • Page 1 of 2 Turn over for Part 3: Live Portfolio Audit
PART 3
Live Stock Market Game Portfolio Audit
Instructions: Inspect 2 active holdings from your team account
Mission: Pull up your live Stock Market Game portfolio on your device. Select two stocks you have purchased. Record their data below and perform a tactical evaluation.
1 PORTFOLIO HOLDING #1
Ticker Tactics Teacher Guide
Teacher Facilitation Guide & Lesson Plan
Ticker Tactics: Teacher Guide
GRADE LEVEL: 7–12 / Economics
PACING: 45–55 Minutes
FOCUS: NYSE vs NASDAQ & SMG Lab
Learning Objectives
- Contrast the NYSE (1792 auction market) and NASDAQ (1971 electronic dealer network).
- Decode ticker symbols and correlate character counts to exchange listing heritage.
- Interpret 52-week price ranges, percent change, and directional momentum.
- Audit active Stock Market Game holdings to articulate written Buy, Hold, or Sell justifications.
Required Materials
- • Ticker Tactics Slides (Projector)
- • Portfolio Lab sheets (1 per student)
- • Student devices logged into active SMG accounts
Class Pacing & Instructional Sequence
10 MIN
Hook & NYSE Origins (Slides 1–2): Introduce the 1792 Buttonwood agreement under the tree on Wall Street. Discuss why informal curb trading caused distrust and how the 1867 mechanical ticker tape standardized national pricing.
12 MIN
NYSE vs. NASDAQ & Ticker Anatomy (Slides 3–4): Deep dive into the two exchange models: Physical Auction Market (NYSE) vs. Virtual Dealer Market (NASDAQ). Compare blue chip vs. tech culture and explain 1-3 letter vs. 4-5 letter ticker conventions.
10 MIN
Trends & Buying vs. Selling (Slides 5–6): Demonstrate 52-week High/Low ranges, moving beyond 1-day noise, and distinguishing realized from unrealized gains. Emphasize setting sell rules before entering trades.
18 MIN
SMG Live Portfolio Audit & Debrief (Slides 7–8 & Lab): Students audit 2 stocks in their live Stock Market Game accounts, chart trendlines, and defend a Buy More, Hold, or Sell thesis. Conclude with the exit challenge on paper profits.
Teacher Talking Points: NYSE vs. NASDAQ
Auction Market (NYSE) vs. Dealer Market (NASDAQ)
NYSE (Auction): Buyers and sellers submit bids through Designated Market Makers (DMMs) who physically and electronically match orders.
NASDAQ (Dealer): Multiple independent computer dealers buy and sell from their own inventory, competing on spread.
Why Did Tech Giants Choose NASDAQ?
When NASDAQ launched in 1971 as the world's first electronic exchange, younger growth companies like Apple (1980) and Microsoft (1986) couldn't meet the strict asset requirements of the historic NYSE, forging NASDAQ's tech identity.