Physics Sub Teacher Guide Substitute Teacher Plan
Physics Sub Day Plan
Monday, November 16, 2026 • Freshman Physics & AP Physics
Room:__________
Main Office:Ext. ______
Neighbor Teacher:__________
Welcome & Quick Start
Thank you for covering today! Please project the Sub Day Agenda Slides as students enter each period. Attendance should be taken in the first 5 minutes. All printed materials (Unit 1 Patterns tests and Picket Fence Lab handouts) are stacked on the front lab table.
Freshman Physics: Review & Unit 1 Patterns Test
Testing Day
First 15–20 min
Finish Unit 1 Review: Students work quietly with table partners to finish any remaining problems on their Unit 1 Patterns Review packet and check answers against the posted review key.
Next 35–40 min
Unit 1 Patterns Test: Clear desks, distribute tests, and maintain a silent testing environment.
Final 5 min
Collect & Reset: Collect all tests and scratch paper in alphabetical or seat order.
Testing Rules & Materials
Allowed: Pencil, scientific calculator (no phones as calculators), and teacher-provided reference sheet if attached.Not Allowed: Phones, smartwatches, earbuds, notes, or talking during the test.Bags: Placed along the side/back wall or zipped under chairs before tests are handed out.
When Students Finish Early
Students raise their hand or bring their test to the front tray.
Verify their Name and Period are written on the test.
Students must remain silent until the last test is collected. They may read a book or work on homework for another class (no phones).
Today's Period Assignment (Fill In / Check Desk)
Per 1
________
Per 2
________
Per 3
________
Per 4
________
Per 5
________
Per 6
________
AP Physics: Picket Fence Free Fall Lab
Hands-On Lab
Goal: Students work in groups of 2–3 to drop a clear plastic "picket fence" through a photogate to measure the acceleration due to gravity (\(g \approx 9.8\text{ m/s}^2\)). Distribute the Picket Fence Lab Handout to each student.
0–10 min
Launch & Setup: Project Slide 3. Students form groups, pick up lab sheets, and connect the photogate to their lab interface/computer.
10–35 min
Data Collection: Groups complete 5 clean vertical drops onto the foam catch pad and record the \(v\text{–}t\) slope (\(a\)) for each trial.
35–50 min
Analysis & Clean-Up: Students calculate mean \(g\), percent error, and answer conclusion questions. Reset all lab stations before dismissal.
Lab Safety Reminders
Always place a foam pad or folded towel directly under the photogate so the plastic picket fence does not crack.
Drop the picket fence straight down—never throw it.
Keep aisles clear of backpacks during the lab.
Quick Troubleshooting
No data recording? Check that the photogate LED blinks red when blocked and software is in Picket Fence mode.Weird \(g\) values? Remind students to drop it vertically without tilting or hitting the photogate sides.
End-of-Day Substitute Report
Substitute Name:
Contact Email / Phone:
Absences / Tardies or Students Who Missed the Test:
How did Freshman Physics testing & AP Physics lab go? (Equipment issues or notes):
Helpful Students / Shout-Outs:
Sub Day Agenda Slides Physics • Nov. 16, 2026
Substitute Agenda
Welcome to Physics!
Freshman Physics
Finish Unit 1 Patterns Review & Take the Unit 1 Patterns Test
AP Physics
Picket Fence Free Fall Lab: Measuring Acceleration Due to Gravity (\(g\))
Please be respectful, follow all safety & testing expectations, and have a great day!
Freshman Physics
Review & Unit 1 Patterns Test
Part 1: Review (15–20 min)
Finish any remaining questions on your Unit 1 Patterns Review .
Check your work quietly with your table partner.
Put away all review packets before the test begins.
Part 2: Unit 1 Test
Allowed: Pencil & scientific calculator only.No phones, earbuds, or smartwatches out at any time.Silent room until every test is collected.Finished early? Turn in your test and read or work silently.
Remember to write your Name and Period on your test! Good luck!
AP Physics • Lab Day
Picket Fence Free Fall Lab
Procedure Overview
Form groups of 2–3 and pick up a lab handout.
Mount the photogate horizontally and place the foam catch pad directly underneath.
Open data-collection software in Picket Fence mode.
Drop the picket fence straight down through the gate for 5 clean trials .
Record the slope of the \(v\text{ vs. }t\) graph as \(a\) for each trial.
Lab Goal
Determine the experimental acceleration due to gravity (\(g\)) and compare it to \(9.80\text{ m/s}^2\).
Protect the Gear
Always drop onto the foam pad. Never throw or bend the plastic picket fence!
AP Physics • Wrap-Up
Data Analysis & Clean-Up
Before You Finish
Calculate your mean \(g\) across all 5 trials.
Compute percent error using \(g_{\text{accepted}} = 9.80\text{ m/s}^2\).
Complete all analysis & conclusion questions on your handout.
Station Reset Checklist
Unplug photogates and coil cables neatly.
Return picket fences and foam pads to the lab bin.
Wipe down lab benches and push in stools.
Turn in your lab handout to the front tray.
Thank you for keeping our lab safe and organized!
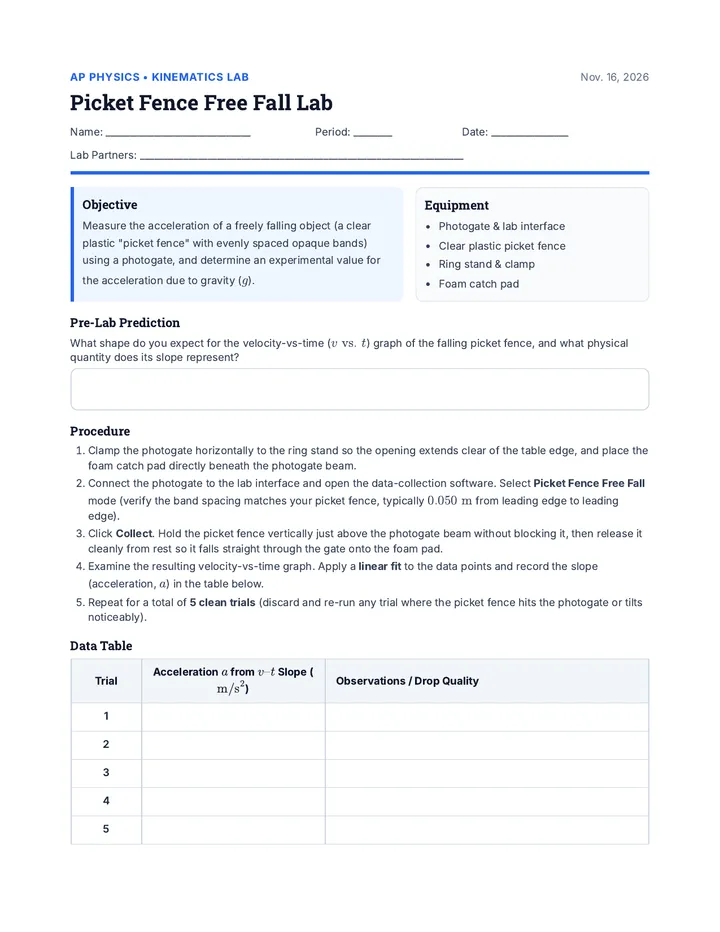
Picket Fence Lab Handout AP Physics • Kinematics Lab Nov. 16, 2026
Picket Fence Free Fall Lab
Name: ______________________________
Period: ________
Date: ________________
Lab Partners: ___________________________________________________________________
Objective
Measure the acceleration of a freely falling object (a clear plastic "picket fence" with evenly spaced opaque bands) using a photogate, and determine an experimental value for the acceleration due to gravity (\(g\)).
Equipment
Photogate & lab interface
Clear plastic picket fence
Ring stand & clamp
Foam catch pad
Pre-Lab Prediction
What shape do you expect for the velocity-vs-time (\(v\text{ vs. }t\)) graph of the falling picket fence, and what physical quantity does its slope represent?
Procedure
Clamp the photogate horizontally to the ring stand so the opening extends clear of the table edge, and place the foam catch pad directly beneath the photogate beam.
Connect the photogate to the lab interface and open the data-collection software. Select Picket Fence Free Fall mode (verify the band spacing matches your picket fence, typically \(0.050\text{ m}\) from leading edge to leading edge).
Click Collect . Hold the picket fence vertically just above the photogate beam without blocking it, then release it cleanly from rest so it falls straight through the gate onto the foam pad.
Examine the resulting velocity-vs-time graph. Apply a linear fit to the data points and record the slope (acceleration, \(a\)) in the table below.
Repeat for a total of 5 clean trials (discard and re-run any trial where the picket fence hits the photogate or tilts noticeably).
Data Table
Trial
Acceleration \(a\) from \(v\text{–}t\) Slope (\(\text{m/s}^2\))
Observations / Drop Quality
1
2
3
4
5
Data Analysis & Calculations
Picket Fence Free Fall Lab
1. Mean Experimental Value of \(g\)
Show your calculation for the average of your 5 trials:
2. Percent Error Calculation
Use \(g_{\text{accepted}} = 9.80\text{ m/s}^2\) and \(\%\text{ Error} = \frac{|g_{\text{exp}} - g_{\text{acc}}|}{g_{\text{acc}}} \times 100\%\):
Analysis Questions
1. Why is it important to drop the picket fence vertically without tilting it as it passes through the photogate? How would tilting affect the apparent spacing between bands?
2. Does the initial height from which you drop the picket fence above the photogate change the slope of the \(v\text{ vs. }t\) graph? Explain using kinematics.
3. Identify two possible sources of experimental error (random or systematic) in this lab, and state whether each would make your measured \(g\) higher or lower than \(9.80\text{ m/s}^2\).
4. If you repeated this lab with a picket fence that had twice the mass (and identical band spacing), how would your measured acceleration compare? Explain why.
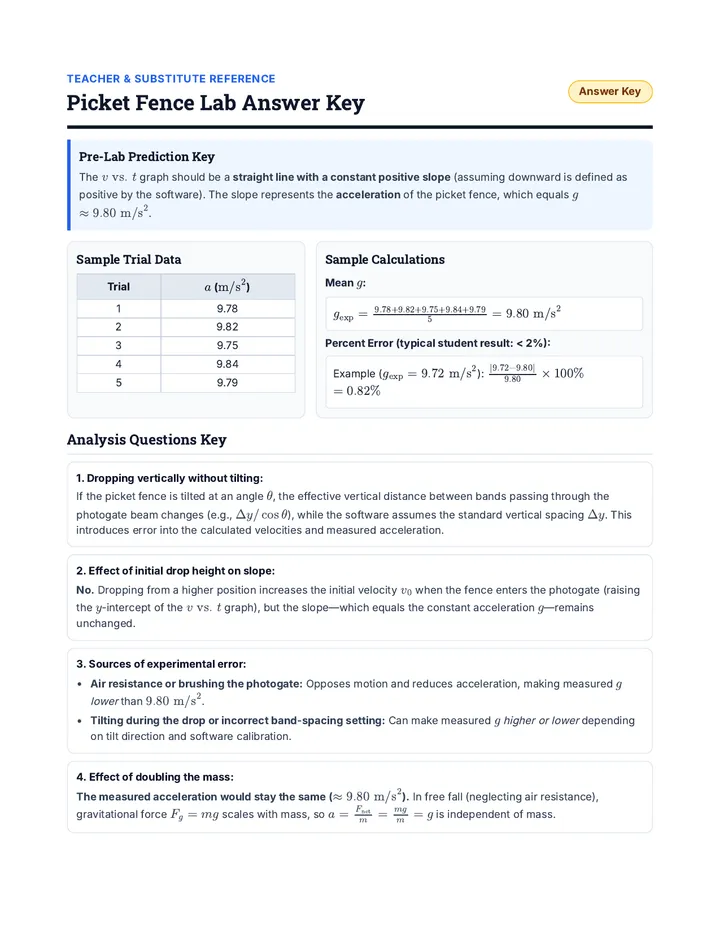
Picket Fence Lab Key Teacher & Substitute Reference
Picket Fence Lab Answer Key
Answer Key
Pre-Lab Prediction Key
The \(v\text{ vs. }t\) graph should be a straight line with a constant positive slope (assuming downward is defined as positive by the software). The slope represents the acceleration of the picket fence, which equals \(g \approx 9.80\text{ m/s}^2\).
Sample Trial Data
Trial
\(a\) (\(\text{m/s}^2\))
1
9.78
2
9.82
3
9.75
4
9.84
5
9.79
Sample Calculations
Mean \(g\):
\(g_{\text{exp}} = \frac{9.78 + 9.82 + 9.75 + 9.84 + 9.79}{5} = 9.80\text{ m/s}^2\)
Percent Error (typical student result: < 2%):
Example (\(g_{\text{exp}} = 9.72\text{ m/s}^2\)): \(\frac{|9.72 - 9.80|}{9.80} \times 100\% = 0.82\%\)
Analysis Questions Key
1. Dropping vertically without tilting:
If the picket fence is tilted at an angle \(\theta\), the effective vertical distance between bands passing through the photogate beam changes (e.g., \(\Delta y / \cos\theta\)), while the software assumes the standard vertical spacing \(\Delta y\). This introduces error into the calculated velocities and measured acceleration.
2. Effect of initial drop height on slope:
No. Dropping from a higher position increases the initial velocity \(v_0\) when the fence enters the photogate (raising the \(y\)-intercept of the \(v\text{ vs. }t\) graph), but the slope—which equals the constant acceleration \(g\)—remains unchanged.
3. Sources of experimental error:
Air resistance or brushing the photogate: Opposes motion and reduces acceleration, making measured \(g\) lower than \(9.80\text{ m/s}^2\).Tilting during the drop or incorrect band-spacing setting: Can make measured \(g\) higher or lower depending on tilt direction and software calibration.
4. Effect of doubling the mass:
The measured acceleration would stay the same (\(\approx 9.80\text{ m/s}^2\)). In free fall (neglecting air resistance), gravitational force \(F_g = mg\) scales with mass, so \(a = \frac{F_{\text{net}}}{m} = \frac{mg}{m} = g\) is independent of mass.