Propeller Challenge Slides PBL STEM Unit: Motion & Energy
15-Meter Speedway
Engineering Challenge: Physics in Action
The Fastest Propeller Car
Can your engineering team harness electrical energy, maximize thrust, and crush the 15-meter speed record?
Teams of 3–4 Track: 15.0 m DC Motor Powered
Slide 1 of 6
Mission Constraints & Materials
Build Specifications
Chassis & Axles
Rigid cardboard frame, low-friction metal axles, plastic wheels, hot glue, and tape. Alignment determines rolling resistance!
Electric Circuit
High-speed DC motor, toggle switch, and soldered wire connections. Polarity dictates forward thrust vs. reverse drag!
15m Track Target
Vehicle must stay in its lane for 15 full meters. Split times clocked at 5m, 10m, and 15m to map instantaneous speed.
Rule: Propulsion must come solely from propeller air thrust—no powered wheels! Slide 2 of 6
Tracking Motion: Distance-Time Graphs
Speed Analysis
Calculating Speed
Speed = Distance / Time (v = d / t)
Measured in meters per second (m/s).
Reading the Slope
Steeper slope = Greater speed.Curving upward = Accelerating (gaining speed).Flat horizontal line = Stopped (speed = 0 m/s).
Split-Time Challenge
Your car will not travel at one constant speed. Does it launch with high acceleration and plateau, or maintain steady thrust?
Interval 1 0 – 5m
Interval 2 5 – 10m
Interval 3 10 – 15m
Question: How does changing energy input change the slope of your line? Slide 3 of 6
Energy Transformations on the Track
Energy Transfers
1. Chemical Potential
Stored in battery electrolytes waiting for a closed circuit.
2. Electrical Energy
Electrons flow through soldered copper wires to the motor coils.
3. Kinetic (Motion)
Spinning propeller pushes air backward; car accelerates forward!
Energy Loss: Thermal & Sound Energy
Friction in motor brushes and axle bearings turns useful energy into thermal energy (heat) and sound energy (whirring propeller). Less friction = higher speed!
Law of Conservation: Total Energy In = Kinetic Energy + Thermal + Sound Slide 4 of 6
Your Independent Design Variables
Trade-Off Analysis
Variable A: Battery Source
Voltage vs. Mass Trade-off
2× AA Batteries (3.0 Volts): Lighter total vehicle mass (~48g), but lower electrical potential to spin motor.
1× 9V Battery (9.0 Volts): Triple voltage spins motor at much higher RPM, but adds heavier mass (~45g).
Variable B: Propeller Type
Thrust vs. Motor Load
Blade Count (2 vs. 3 vs. 4 Blades): More blades bite more air for initial thrust, but create more drag on motor.
Diameter & Pitch Angle: Larger diameter moves more air mass; steep pitch increases air velocity per turn.
Engineering Rule: Change ONE variable at a time between test trials! Slide 5 of 6
Project Roadmap: From Stations to Speed
1–2 Week Timeline
Phase 1
Station Rotations
Test voltage, graphs, pitch, & friction hands-on.
Phase 2
Blueprints & Wiring
Design chassis, solder switch circuit, mount motor.
Phase 3
15m Speed Trials
Clock 5m, 10m, 15m splits; plot graph curves.
Phase 4
Energy Audit & Race
Calculate average speed, audit energy, crown champions!
Safety First: Goggles required at soldering and hot-glue stations! Slide 6 of 6
Station Rotation Lab Packet Propeller Propulsion STEM Lab
Station Rotations: Motion & Energy
Target: 15m Track | Grades 6–8
Student Name:
Team Members:
Period:
Date:
STATION 1
Graphing the Glide: Distance vs. Time
Speed = Distance / Time
Three prototype cars traveled down a 15-meter track. Examine the sample distance-time data below:
Car Model
Time to 5m
Time to 10m
Time to 15m (Total)
Average Speed (m/s)
Car A (Lightweight 3V)
2.5 s
5.2 s
7.5 s
Car B (High-Volt 9V)
1.2 s
2.6 s
4.0 s
Car C (Heavy Chassis)
3.8 s
8.0 s
12.5 s
1. Calculate average speed for Cars A, B, and C over the full 15 meters (\(v = 15\text{ m} / \text{total time}\)). Write values in table.
2. Which car would have the steepest slope on a distance-time graph? Explain how slope reveals speed:
STATION 2
Motor Voltage & Energy Flow
Chemical → Electrical → Kinetic
Connect the test DC motor to 2× AA batteries (3.0V) and then to a 9V battery. Observe RPM, motor hum, and warmth.
2× AA (3.0 Volts) Observations: Notice propeller sound pitch and motor vibration:
1× 9V Battery (9.0 Volts) Observations: Notice propeller sound pitch and motor vibration:
3. Trace the energy path: What form of energy is stored in the battery, what does it become in the wires, and what two forms of "wasted" energy are produced by the spinning motor?
Station Rotation Lab Packet • Page 1 of 2 • Turn over for Stations 3 & 4
Station Rotations: Aerodynamics, Friction & Synthesis
Student Copy • Page 2
STATION 3
Propeller Pitch & Thrust Force
Newton's 3rd Law / Kinetic Energy
Test two different propellers (e.g., small 2-blade vs. large 3-blade). Hold the index card 10 cm behind the propeller to feel air displacement.
Propeller Type
Diameter (cm)
Air Deflection (Low/Med/High)
Motor Strain / Speed
Propeller A (Small / 2-blade)
Propeller B (Large / 3-blade)
4. Why does pushing air backward make the car accelerate forward? Connect this to kinetic energy and thrust:
STATION 4
Friction & Wheel Alignment
Thermal Energy Dissipation
Roll the test cardboard chassis down a gentle ramp: Trial 1 with parallel straight axles; Trial 2 with crooked/rubbing axles.
Trial 1: Parallel Axles Coast distance (cm) & roll smoothness:
Trial 2: Misaligned Axles Coast distance (cm) & wheel rubbing:
5. Where did the car's kinetic energy go when the wheels rubbed against the cardboard body? Name the energy type:
Engineering Design Decision (Hypothesis)
Based on Stations 1–4, what battery configuration (2× AA 3.0V vs. 1× 9V) and propeller type will your team select for Prototype 1? Justify your choice with scientific concepts (voltage, mass, thrust, friction):
Unit: Propeller Propulsion • Stations 1–4 Synthesis Page 2 of 2
Station Setup Teacher Guide Teacher Facilitation & Logistics
Station Rotations Teacher Guide
TEACHER ONLY • ANSWER KEY
Unit Timing: Days 1–2 (Bridge between Motion & Energy)
Rotation Timing: 10–12 min per station + 10 min debrief
Group Size: 3–4 students per station group
Station Setup & Materials Checklist
Station
Required Hardware / Supplies
Teacher Prep Tip
1: Graphing Glide
Laminated sample graph cards, dry-erase markers, metric rulers, student lab packets.
Place distance-time reference anchor chart at table.
2: Motor Voltage
2× DC 3-6V hobby motors mounted to blocks, 2× AA battery holders, 9V battery snaps, alligator clips.
Do NOT run 9V continuously; motors can heat up after 2 min.
3: Propeller Pitch
Test motor rig with quick-swap hub, 2-blade vs. 3-blade propellers, index card on stand, metric tape.
Mark 10 cm target line for consistent air deflection testing.
4: Friction & Wheels
2 test cardboard chassis: Car A with aligned straw bearings; Car B with intentionally skewed axles, mini ramp.
Keep ramp angle at exactly 15° so gravity pull is constant.
Station 1 Answer Key & Standards Connection (MS-PS3-1, MS-PS2-2):
Car A Average Speed: \(15\text{ m} / 7.5\text{ s} = \mathbf{2.0\text{ m/s}}\).Car B Average Speed: \(15\text{ m} / 4.0\text{ s} = \mathbf{3.75\text{ m/s}}\) (Fastest car).Car C Average Speed: \(15\text{ m} / 12.5\text{ s} = \mathbf{1.2\text{ m/s}}\) (Slowest car).Slope Explanation: Car B has the steepest slope because slope \(= \Delta\text{distance}/\Delta\text{time}\). A steeper line means more meters are covered in fewer seconds.
Station 2 Answer Key & Energy Flow (MS-PS3-2, MS-PS3-5):
Observations: At 3.0V, motor emits low whir and moderate RPM. At 9.0V, motor emits high-pitched whine, strong vibration, and noticeable airflow.Energy Transformation Chain: Chemical Potential (battery) → Electrical (copper leads) → Kinetic / Mechanical (motor shaft & air).Thermal & Sound Losses: Internal brush resistance and air friction convert useful energy into Thermal Energy (warm motor housing) and Sound Energy (whirring noise).
Station Rotations Teacher Guide • Page 1 of 2 • Solutions for Stations 3 & 4 on reverse
Station Rotations: Keys, Misconceptions & Debrief
TEACHER COPY • Page 2
Station 3 Answer Key (Aerodynamics & Thrust):
Propeller Deflection: The larger 3-blade propeller moves significantly more air volume, bending the index card further, but increases current draw on the battery.Newton's 3rd Law Connection: The spinning propeller exerts a force on the air backward (action). The air exerts an equal and opposite force pushing the car forward (reaction thrust), imparting kinetic energy to the chassis.
Station 4 Answer Key (Friction & Alignment):
Coast Distance: Parallel axles travel 2–3× further than misaligned axles. Misaligned axles veer into walls and screech against cardboard.Energy Dissipation: The mechanical kinetic energy of the car is dissipated as Thermal Energy due to friction between the metal axle and the plastic/cardboard housing.
Common Middle School Misconceptions
Misconception 1: "9V is always faster because more volts = automatically better."
Reality: A 9V battery has much higher voltage, but it is also heavier (~45g) than two AA batteries. If chassis is too heavy, the acceleration advantage is reduced. Furthermore, high voltage drains faster.
Misconception 2: "Energy was destroyed because the car stopped."
Reality: Energy cannot be created or destroyed (Law of Conservation of Energy). The kinetic energy was transformed into thermal energy (heat in axles/carpet) and sound energy.
Misconception 3: "A flat line on a distance-time graph means constant speed."
Reality: On a distance-time graph, a horizontal flat line means distance is not changing—the vehicle is completely stopped (\(v = 0\)). Constant speed is a straight diagonal line.
Whole-Class Debrief Prompts
Bring students together before they begin car blueprints. Ask:
"If you had to choose between cutting 20 grams of cardboard mass vs. upgrading from 3V to 9V, which would improve acceleration more?"
"Why does our circuit need an on/off switch instead of just taping the wires directly to the battery terminals?"
"What happens if your motor spins the propeller in reverse?" (Pushes air forward, driving car backward!)
Unit: Propeller Propulsion • Teacher Facilitation Guide Page 2 of 2
Car Blueprint Student Log Phase 2 • Engineering Design & Assembly
Propeller Car Engineering Blueprint
Target: 15-Meter Track
Vehicle Codename:
Lead Circuit Tech:
Chassis / Axle Lead:
Aerodynamics / Data:
Circuit Schematic & Wiring Diagram
Series Circuit: Power → Switch → Motor
Verify polarity before soldering! The motor must spin the propeller so air pushes backward.
[ Battery Source ] 2× AA (3V) or 1× 9V
[ Toggle Switch ] Opens / closes circuit loop
[ DC Motor & Prop ] Solder leads to lugs
Chassis Blueprint (Scale: 1 box = 2 cm)
Top View & Side View Required
Sketch your cardboard cutout, axle positions (must be exactly parallel), motor pylon height, and battery placement for balance:
← Front (Propeller Clearance) Center of Mass Zone Rear Axle →
+ • + • + • + • + • + • + • + • + • + • + • +
Target Chassis Length: _______ cm Target Width: _______ cm Propeller Ground Clearance: > 2.5 cm
Propeller Car Engineering Blueprint • Page 1 of 2 • Prototype Build Specifications on reverse
Prototype Specifications & Quality Checkpoints
Student Copy • Page 2
Selected Engineering Variables
Design Component
Team Specification
Scientific Justification
Battery Configuration
□ 2× AA (3.0V) □ 1× 9V
Propeller Selection
Blades: _____ Diameter: _____ cm
Total Vehicle Mass
Scale Reading: ________ grams
Bench Quality Checkpoints (Sign Off Before Track Testing)
Solder Joint Integrity: Tug test on motor and switch wires shows solid, shiny solder bond. Free Wheel Spin: Wheels spin for 3+ seconds freely with zero wobble or rubbing against chassis.
Thrust Vector Direction: Propeller blows air backward; vehicle moves forward on test table. Center of Mass Balance: Vehicle does not tip backwards or sideways when battery is seated.
Build & Assembly Troubleshooting Log
Engineers expect challenges! Record at least two assembly hurdles, what you modified, and the result:
Obstacle / Failure Mode
Engineering Redesign / Fix
Status
□ Fixed
□ Fixed
Teacher Verification Signature: ____________________________ Page 2 of 2
Circuit Assembly Reference Sheet Maker Workshop Reference
Circuit Soldering & Assembly Guide
EYE PROTECTION MANDATORY
Workshop Safety First:
• Iron in Stand: Return soldering iron to coiled stand immediately after every joint.
• Never Touch Tip: The metal barrel is 350°C (660°F). Hold only insulated grip.
• Hot Glue Caution: Keep fingers clear of nozzle. Cool burns under cold water immediately.
1 Wire Stripping & Mechanical Hook
Use wire strippers to remove exactly 5 mm of plastic insulation. Twist exposed copper strands tightly together.
The Golden Rule: Thread wire through the motor or switch eyelet and bend into a tight hook. Solder creates electrical contact; the mechanical hook provides physical strength!
2 Soldering the Joint (3-Second Rule)
Wipe iron tip on damp sponge. Heat the lug and wire together with the iron tip for 1–2 seconds .
Form a "Shiny Volcano": Touch lead-free solder to the heated metal joint (not the iron tip). When molten solder flows smooth and shiny, pull iron away and keep wire still for 5 seconds.
3 Switch & Polarity Verification
Splice the on/off switch in line along the positive (red) lead between battery snap and motor.
Airflow Direction Check: Turn switch ON. Hold hand behind propeller. If wind blows in your face, polarity is correct! If air blows forward, swap the two motor wire connections.
4 Low-Friction Axle Straw Bearings
Never glue metal axles directly to cardboard! Cut plastic drinking straws to match chassis width as axle sleeves.
Parallel Alignment: Hot-glue straws perpendicular to chassis centerline. Thread metal axle through. Leave 1 mm gap between wheel and straw edge so plastic does not rub.
Assembly Troubleshooting Quick Fixes
Symptom
Probable Cause
Shop Fix
Dull, blobby solder joint ("cold joint")
Component was moved while cooling or wire was not pre-heated.
Touch iron tip to reheat joint until solder re-liquefies, then hold perfectly still.
Car travels backward when switched on
Motor polarity reversed (propeller spins clockwise instead of counter-clockwise).
Desolder leads at motor terminals and reverse the red/black connections.
Motor hums loudly but car will not roll
Axle binding, wheel rubbing cardboard, or glue jammed on motor shaft.
Inspect motor shaft for glue drips; gently pull plastic wheels outwards to eliminate rubbing.
Workshop Reference • Propeller Propulsion PBL Keep Posted at Soldering Bench
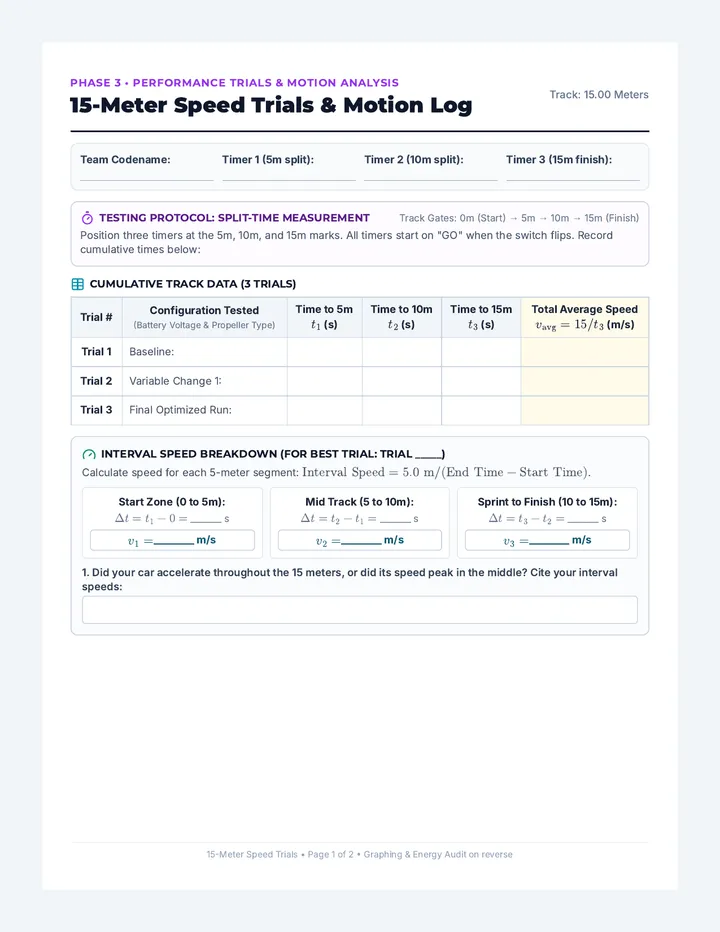
Speed Trials Lab Report Phase 3 • Performance Trials & Motion Analysis
15-Meter Speed Trials & Motion Log
Track: 15.00 Meters
Team Codename:
Timer 1 (5m split):
Timer 2 (10m split):
Timer 3 (15m finish):
Testing Protocol: Split-Time Measurement Track Gates: 0m (Start) → 5m → 10m → 15m (Finish)
Position three timers at the 5m, 10m, and 15m marks. All timers start on "GO" when the switch flips. Record cumulative times below:
Cumulative Track Data (3 Trials)
| Trial # | Configuration Tested
Interval Speed Breakdown (For Best Trial: Trial _____)
Calculate speed for each 5-meter segment: \(\text{Interval Speed} = 5.0\text{ m} / (\text{End Time} - \text{Start Time})\).
Start Zone (0 to 5m): \(\Delta t = t_1 - 0 = \) _______ s
\(v_1 =\) ________ m/s
Mid Track (5 to 10m): \(\Delta t = t_2 - t_1 = \) _______ s
\(v_2 =\) ________ m/s
Sprint to Finish (10 to 15m): \(\Delta t = t_3 - t_2 = \) _______ s
\(v_3 =\) ________ m/s
1. Did your car accelerate throughout the 15 meters, or did its speed peak in the middle? Cite your interval speeds:
15-Meter Speed Trials • Page 1 of 2 • Graphing & Energy Audit on reverse
Distance-Time Graph & Energy Audit
Student Copy • Page 2
Plotting Motion: Distance (m) vs. Time (s)
Plot Trial 1 (dashed line) vs. Best Trial (solid line)
15m (Finish) • • • • • • • • • • • • • • • • • • • • • • •
10m (Gate 2) • • • • • • • • • • • • • • • • • • • • • • •
5m (Gate 1) • • • • • • • • • • • • • • • • • • • • • • •
0m (Start) 2s 4s 6s 8s 10s 12s 14s+
Horizontal Axis: Time Elapsed (seconds) • Vertical Axis: Track Position (meters)
2. Compare the slopes of your lines on the graph. How does the graph visually prove which vehicle run was faster?
The 15-Meter Energy Audit (Conservation of Energy)
Trace how stored energy transformed during your 15-meter run. Fill in each box with the specific energy type:
Energy Input:
(Stored in battery cells)
Transfer Medium:
(Flowing through wires)
Useful Work Output:
(Car movement down track)
Where did the "lost" energy go? Identify two energy drains:
Thermal Energy source:
Sound Energy source:
3. Final Engineering Trade-Off Reflection:
Explain how changing your battery (AA vs. 9V) or propeller affected your car's speed. What was the trade-off between electrical voltage, vehicle mass, and aerodynamic drag?
Unit: Propeller Propulsion • Performance Trials Report Page 2 of 2
Project Showcase Scoring Rubric PBL Summative Assessment • NGSS MS-PS2-2 & MS-PS3-1, MS-PS3-5
Propeller Car Project Showcase Rubric
Total Points: 20 pts
Team Codename:
Student Name:
Fastest 15m Time:
Evaluator:
Criterion
4 • Exemplary
3 • Proficient
2 • Developing
1 • Beginning
Motion Graphing & Speed Analysis (MS-PS2-2)
Split times (5m, 10m, 15m) plotted flawlessly; line slopes accurately interpreted; interval speeds calculated with correct units (\(\text{m/s}\)).
Split times plotted with minor scaling errors; average speed calculated accurately; slope connected to speed.
Graph missing split data points or axes labels; speed calculation attempted with math or unit error.
Graph incomplete or incorrectly plotted as bar chart; speed calculation missing.
Energy Transformation & Audit (MS-PS3-5)
Accurately maps complete path: Chemical → Electrical → Kinetic; thoroughly explains thermal & sound dissipation using Conservation of Energy.
Correctly identifies chemical, electrical, and kinetic energy; identifies heat/sound as wasted energy with basic explanation.
Confuses energy forms (e.g., calls battery "electricity"); identifies only one energy transformation step.
Energy transformation chain omitted or claims energy was destroyed when car stopped.
Variable Testing & Iteration (ETS1-3)
Systematically isolates one variable (battery voltage or propeller); justifies trade-offs (mass vs. thrust) using data from 3 distinct trials.
Tests independent variable across trials; describes how modification impacted vehicle speed.
Changed multiple variables at once without isolating cause; troubleshooting log contains superficial entries.
Only 1 trial completed; no variable changes or design iterations attempted.
Circuit Soldering & Craftsmanship (Engineering)
Shiny, secure solder joints pass tug test; toggle switch operates cleanly; axles are parallel with minimal friction in straw bearings.
Solder connections functional and secure; switch functions; wheels spin freely with minor axle wobble.
Loose or cold solder joint required repair; wheels rub against cardboard chassis; motor pylon loose.
Circuit disconnected or taped instead of soldered; wheels bound tightly against frame.
Track Performance & Teamwork (15m Run)
Car completes full 15m in-lane under its own propeller thrust; all team members actively fulfill assigned roles and timer duties.
Car completes 15m with minor wall graze; team collaborates well to record split times.
Car stalled before 15m or required manual push; team had difficulty coordinating timers.
Car failed to launch or veered out immediately; uneven team participation.
Score Breakdown
Motion Graphing: ____ / 4
Energy Audit: ____ / 4
Variable Iteration: ____ / 4
Circuit Assembly: ____ / 4
Track Run & Team: ____ / 4
Total Score: ____ / 20
Teacher Commendations & Engineering Feedback:
Unit: Propeller Propulsion • Summative Project Rubric Page 1 of 1