Budget Breakdown Slides
School Finance & Leadership
Fiscal Policy Simulation
Strategic Resource Allocation
Budget Breakdown
How public school districts navigate revenue constraints, fixed expenditure mandates, and high-stakes trade-offs to balance the ledger.
3 Revenue Pillars
Local, State, Federal
85% Personnel
Fixed staffing costs
Balanced Budget
Zero deficit mandate
Where Does the Money Come From?
The Three Revenue Pillars
National Average Blend
~45% Local
Property Taxes
Collected via local residential and commercial real estate taxes. Generates wealth disparities across district boundaries.
Constraint: Limited by assessed valuation & local caps.
~45% State
Foundation Aid
Calculated through weighted pupil formulas (ADMs) to bridge funding gaps between rich and poor communities.
Constraint: Tied strictly to average daily student attendance.
~10% Federal
Categorical Grants
Targeted strictly toward vulnerable populations: Title I (low-income learners), IDEA (special ed), and meals.
Restriction: Cannot supplant general fund operations.
Key Fiscal Rule: "Categorical" federal dollars cannot be transferred to cover general fund deficits! Legal Mandate
Where Does the Money Go?
The 85% Staffing Reality
Typical District Expenditure Model
Personnel & Benefits
Teachers, aides, nurses, counselors, administrators, pensions
80-85%
Operations & Maintenance
Utilities, building repairs, custodial, yellow bus transit
8-10%
Instructional Supplies & Tech
Textbooks, software licenses, lab supplies, student devices
4-6%
District Governance & Services
Audits, legal compliance, board insurance, district office
2-4%
The School Finance Paradox
Because schools are service institutions, over 80 cents of every dollar pays for educators and staff.
When facing a multimillion-dollar deficit, you cannot balance the books by cutting paper clips. Cuts inevitably impact personnel.
Fixed structural costs (health insurance + step salary increases) grow 3–5% annually regardless of revenue growth.
Fiscal Pressures
What Triggers a Budget Crisis?
The Structural Squeeze
Declining Enrollment
State foundation aid is distributed per-pupil. Losing 100 students strips roughly $1,000,000 in revenue while building maintenance costs stay unchanged.
The Funding Cliff
Temporary relief grants expire after 3 years, leaving funded interventionists, social workers, and programs stranded without ongoing money.
Uncontrollable Cost Inflation
Utility rates, diesel, special ed out-of-district tuitions, and employee medical coverage escalate far faster than statutory state funding increases.
Unfunded Mandates
Legislatures regularly mandate specialized compliance reporting, curriculum shifts, or testing protocols without providing the necessary funds.
Statutory Requirement: Public school districts cannot incur a year-end deficit. Balanced budgets are legally compulsory.
Simulation Scenario
Oakridge Unified School District
Fiscal Year 2026-27
Projected Revenue
$48,600,000
Enrollment drop of 115 students reduces state allocation.
Baseline Expenditures
$50,000,000
Contractual step increases + 7% health premium jump.
Operating Deficit
-$1,400,000
Must cut or reallocate exactly $1.4M to balance.
Total Students
4,200 K-12
School Campuses
6 Buildings
Certified Staff
310 FTE
Reserve Fund
1.8% (Minimum)
Your Task: Act as the District Budget Committee to balance the ledger while protecting educational quality.
Leadership Strategy
The 4 Rules of Ethical Budgeting
Deliberation Guide
1
Cuts Furthest from Students
Examine central office contracts, software licenses, energy savings, and travel before touching classroom teachers or aides.
2
Equity Over Equality
Flat percentage cuts unfairly damage high-need schools. Allocate and preserve resources based on student vulnerability.
3
Prioritize Recurring Savings
Dipping into reserves only delays the crisis 12 months. Structural deficits require structural expenditure reductions.
4
Watch Hidden Downstream Costs
Cutting early reading specialists or custodial repairs leads to higher remediation bills and major building failures later.
Transition: Open your "Deficit Dilemma Simulation Activity" to begin balancing the ledger.
Deficit Dilemma Simulation Activity
Oakridge Unified School District • Board of Education
Deficit Dilemma Simulation Activity
Deficit: -$1,400,000
Committee Member:
Assigned Role:
Date:
Fiscal Year Briefing: Oakridge Unified 4,200 Students • 6 Campuses
Due to an enrollment drop of 115 pupils and an 8% spike in health insurance rates, Oakridge faces a mandatory budget gap of $1,400,000. State statute requires a balanced ledger. Select reductions from the menu below to reach or exceed $1.4M while protecting instructional equity.
Menu of Expenditure Reductions & Revenue Items
Check chosen items; record savings on Page 2
| Sel. | Code | Proposed Fiscal Action | Fiscal Impact | Risk Level |
|---|
| A. Central Office & Operations | | | | |
| | | | |
| A-1 | Freeze all central administrator travel, memberships & off-site PD | +$80,000 | Low Impact | |
| | | | |
| A-2 | Implement HVAC temperature setbacks & summer energy shutdowns | +$130,000 | Low Impact |
|
| A-3 | Consolidate yellow bus routes; extend secondary walk zones to 2 miles | +$190,000 | Medium |
|
| A-4 | Eliminate Assistant Director of Curriculum FTE position | +$125,000 | Medium |
| B. Instructional Technology & Services |
|
| B-1 | Cancel third-party digital benchmark testing & supplemental apps | +$95,000 | Medium |
|
| B-2 | Defer student 1:1 Chromebook cycle by 1 calendar year (grade 5 & 9) | +$220,000 | Medium |
| C. School Staffing, Instruction & Athletics |
|
| C-1 | Increase High School class size cap (24 → 28) via attrition (4 FTEs) | +$360,000 | High Impact |
|
| C-2 | Reduce Elementary Art & Music specialists by 2 FTEs (share sites) | +$175,000 | High Impact |
|
| C-3 | Freeze 4 non-mandated general education classroom aide vacancies | +$150,000 | High Impact |
|
| C-4 | Reduce middle & high school extracurricular & athletic stipends by 25% | +$115,000 | Medium |
| D. Revenue Generation & Local Fees |
|
| D-1 | Institute $125 per-sport High School athletic participation fee | +$60,000 | Medium |
|
| D-2 | Raise community facility & auditorium weekend rental rates by 30% | +$50,000 | Low Impact |
Oakridge School Budget Simulation • Session I Turn to Page 2 to compile ledger and justify decisions →
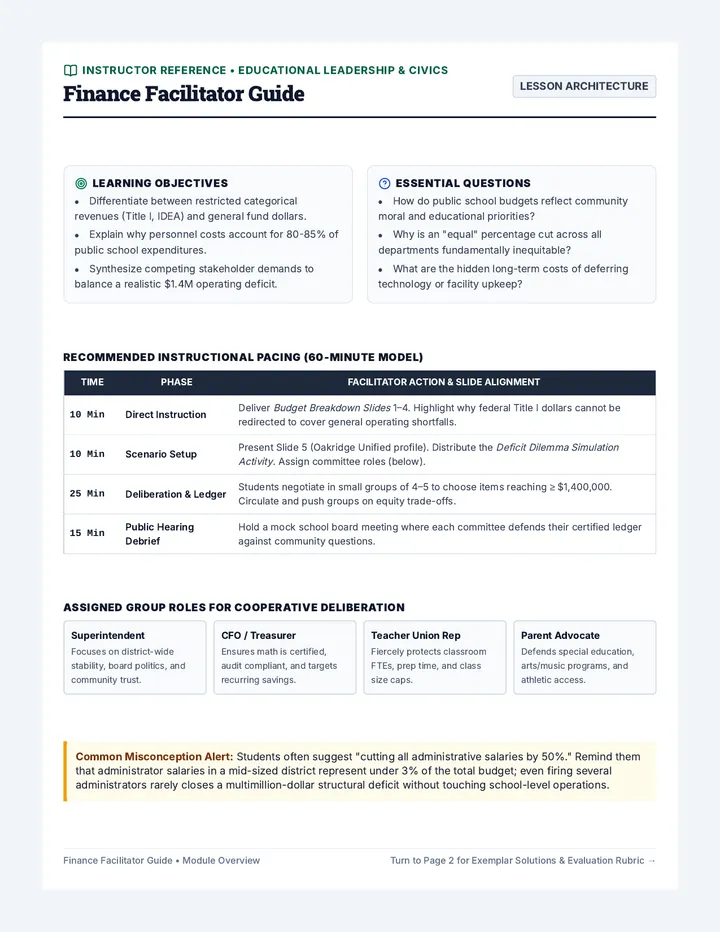
Finance Facilitator Guide
Instructor Reference • Educational Leadership & Civics
Finance Facilitator Guide
Lesson Architecture
Learning Objectives
- Differentiate between restricted categorical revenues (Title I, IDEA) and general fund dollars.
- Explain why personnel costs account for 80-85% of public school expenditures.
- Synthesize competing stakeholder demands to balance a realistic $1.4M operating deficit.
Essential Questions
- How do public school budgets reflect community moral and educational priorities?
- Why is an "equal" percentage cut across all departments fundamentally inequitable?
- What are the hidden long-term costs of deferring technology or facility upkeep?
Recommended Instructional Pacing (60-Minute Model)
| Time | Phase | Facilitator Action & Slide Alignment |
|---|
| 10 Min | Direct Instruction | Deliver Budget Breakdown Slides 1–4. Highlight why federal Title I dollars cannot be redirected to cover general operating shortfalls. |
| 10 Min | Scenario Setup | Present Slide 5 (Oakridge Unified profile). Distribute the Deficit Dilemma Simulation Activity. Assign committee roles (below). |
| 25 Min | Deliberation & Ledger | Students negotiate in small groups of 4–5 to choose items reaching ≥ $1,400,000. Circulate and push groups on equity trade-offs. |
| 15 Min | Public Hearing Debrief | Hold a mock school board meeting where each committee defends their certified ledger against community questions. |
Assigned Group Roles for Cooperative Deliberation
Superintendent
Focuses on district-wide stability, board politics, and community trust.
CFO / Treasurer
Ensures math is certified, audit compliant, and targets recurring savings.
Teacher Union Rep
Fiercely protects classroom FTEs, prep time, and class size caps.
Parent Advocate
Defends special education, arts/music programs, and athletic access.
Common Misconception Alert: Students often suggest "cutting all administrative salaries by 50%." Remind them that administrator salaries in a mid-sized district represent under 3% of the total budget; even firing several administrators rarely closes a multimillion-dollar structural deficit without touching school-level operations.