An AP Human Geography unit covering geographic data, thinking spatially, scales of analysis, and regional analysis to understand how geographers interpret our world.
LEVEL 3: NATIONAL SCALE OF ANALYSIS (e.g., country-by-country datasets)
LEVEL 4: LOCAL SCALE OF ANALYSIS (e.g., subnational state, county, or zip code level)
LEVEL 5: CENSUS TRACT (Most granular neighborhood level)
Part 5 KEY
Poverty Case Analysis Key Answers
Slides 11-14, 16-20
1. Define data aggregation in your own words, and explain how Map A (State-level) represents aggregated data.
Exemplary Answer: Data aggregation is the compilation and averaging of individual data points into larger group totals or averages. Map A represents aggregated data because all individual household, neighborhood, and county-level poverty statistics in Texas are combined into a single average value for the entire state, masking the internal differences.
2. Describe how "zooming in" to the county or census tract scale (Map B) changes a geographer's conclusions about the distribution of wealth and poverty in a state.
Exemplary Answer: Zooming in reveals high spatial variation (uneven distribution) rather than a uniform pattern. While the state average might suggest a moderate middle-income region, the county/census tract level reveals intense, concentrated pockets of severe poverty (like along the Rio Grande border) and areas of extreme wealth (suburban centers). Zooming in prevents over-generalization.
Teacher Support Document • AP Human Geography Page 2 of 4
Visual Evidence & Comparative Mapping Key
Answer Key • Topic 1.6
Part 6 KEY
Borders & Refugee Distributions Key
Slides 27-29
Border Barriers Analysis
Exemplary Answer: A global scale suggests the entire world is walling off boundaries uniformly. However, the regional/Schengen map reveals barriers are highly localized reactions to specific migration corridors (e.g., Balkan route), showing it is a targeted regional conflict rather than a uniform worldwide shift.
Refugee Flow Distributions
Exemplary Answer: A regional map makes it look like every country in Europe absorbs a portion of the 3.49 million refugees. The national scale reveals massive inequity: Germany and Turkey bear nearly all the physical responsibility, which is critical for making realistic humanitarian aid allocations.
Part 7 KEY
Cereal Yield Case Study Key
Slides 23, 25
Source A (Regional Scale)
What this hides: Hides the highly successful agricultural revolutions in nations like Egypt and South Africa, painting the entire continent as universally food-insecure and low-yielding.
Source B (National Scale)
What this reveals: Reveals that agricultural productivity varies widely across national boundaries based on technology, access to fertilizers, irrigation systems, and local climatic variations.
Teacher Support Document • AP Human Geography Page 3 of 4
AP FRQ Scoring & DOL Key
Answer Key • Topic 1.6
Part 8 KEY
Application FRQ Key & Scoring Rubric
Slide 6
1. Correct Scale Choice
Census-Tract Level (Local scale of analysis).
2. Core Scoring Explanation
State-level funding would spread capital too thinly, missing pockets of extreme neighborhood poverty within rich states (e.g., Austin zip codes vs border towns).
Slide 9 Task A: DESCRIBE the difference between map scale and scales of analysis.
Model Student Response: Map scale is a ratio expressing physical distance on a map relative to physical ground reality (such as 1:24,000 scale). On the other hand, the data scale of analysis refers to how data is aggregated, categorized, or grouped within specific political or geographic boundaries, such as country-by-country, state-by-state, or local county lines.
Slide 30 Task B: EXPLAIN how a national scale of analysis can generalize spatial data.
Model Student Response: A national scale of analysis generalizes spatial data because it aggregates all localized subnational statistics into a single state-wide or country-wide average. By calculating a national average for poverty, wealth, or agricultural yield, the local variations, anomalies, and geographic disparities (e.g., rich urban districts versus impoverished rural communities) are hidden, presenting a misleading picture of spatial uniformity.
Slides 21-26
Exit Ticket Multiple-Choice Answer Key
Question 1 Answer: Natural Increase Rate colored by world region.
B) Regional scale
Question 2 Answer: Why local scales are critical for tracing outbreaks.
C) Reveals masked patterns
Question 3 Answer: Meaning of a fractional scale of 1:1,000,000.
B) Small-scale map
Teacher Support Document • AP Human Geography Page 4 of 4
Formal Regions: Case Notes & Explanations
Slides 5, 6
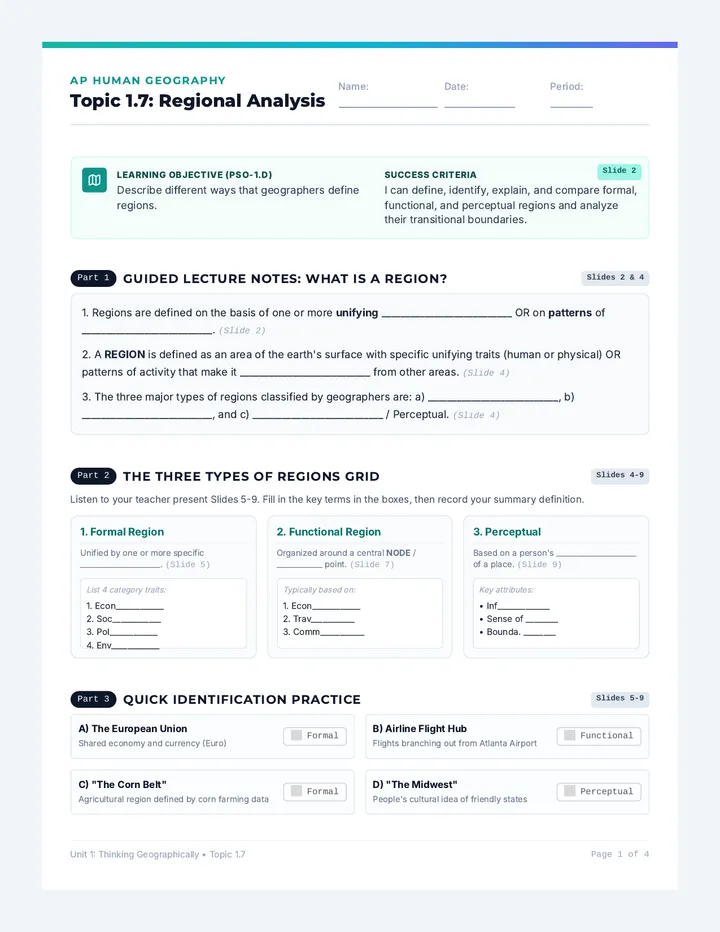
• Social/Cultural: The Islamic World has Muslim adherents primarily clustered in ____________________ and ____________________ Asia and North Africa.
• Environmental: The ____________________ Desert separates North Africa and Sub-Saharan Africa.
Social/Cultural Explanation
Explain why the "Islamic World" is categorized as a formal region rather than a functional one.
Environmental Explanation
Explain how climatic parameters like desert borders form physical formal regions.
Spatial Diagram Drawing Lab Sketch Space
Geographers visualize spaces using diagrams. Draw a clean representation of both regional structures below.
Sketch A: Formal Region Border (Draw a rigid political border with uniform, unvarying territory inside)
Pencil sketch here
Sketch B: Functional Region Node (Draw a central node [focal point] with connection lines fading outwards)
Pencil sketch here
Part 6
Functional Regions: The Power of the Node
Slides 7, 8
Explain How does a television broadcast market function as a nodal/functional region? Identify the "node" in this example.
Identify the node and describe the decay of signal strength as distance increases...
Compare How do county lines (which are formal regions) differ from television market regions (which are functional) in terms of their boundaries?
Compare sharp legal borders versus fading connections to a central city...
Unit 1: Thinking Geographically • Topic 1.7 Page 2 of 4
Perceptual Regions and Boundary Conflicts
AP Human Geography • Topic 1.7
Part 7
Perceptual/Vernacular Regions: mapping "The South"
Slide 9
• A perceptual region is based on a person's ___________________________ or perception of a certain location.
• It helps establish a sense of ___________________________ and cultural identity.
• Boundaries often ___________________________ because people have unique standards for what defines the region.
Explain According to Slide 9, what are two different criteria someone might use to draw the boundary of "the American South"? Why do these criteria result in different map boundaries?
List criteria from Slide 9 (such as Confederate States, winter precipitation, Baptist majority) and explain...
Identify Identify another perceptual region you use in your everyday life (e.g., "The Ghetto", "Upstate", "The East Side"). What defines this area in your mind?
Your perceptual region example and what defines it...
Regions develop their meaning from humans — so _____________________ decide how they appear and the boundaries are many times not _____________________. (Slide 10)
Overlapping & Transitional borders
Slide 10 highlights overlapping regions of Latin America, Mesoamerica, and the Caribbean.
Explain why borders are "transitional":
Contested Regional Borders
Look at Slide 11's maps. A state like Maryland appears in the "Northeast" in one map, but in the "Southern" in another.
Explain why these borders are contested:
Unit 1: Thinking Geographically • Topic 1.7 Page 3 of 4
AP FRQ Practice & Exit Ticket
AP Human Geography • Topic 1.7
Part 9
AP-Style Regional Analysis FRQ Task
Slides 12, 13
Regions can act as a ___________________________ between local, national, regional, and global scales. (Slide 12)
Prompt Context (Slide 13):
Geographers apply regional analysis at different scales. Consider the map of the United States divided into **12 Federal Reserve Districts** (functional monetary regions centered on node cities like Atlanta and Dallas).
Task A: DEFINE functional region. Define
Define functional region incorporating the concept of a focal point or node...
Task B: EXPLAIN how the Federal Reserve Districts map functions as a scale of analysis. Explain
Explain how dividing the country into districts allows geographers and economists to spot regional trends...
Slides 3-13
Part 10
Demonstration of Learning (Exit Ticket)
1. A researcher maps the United States by grouping states based on whether they have a "Right to Work" law. What type of region has the researcher created?
A) Formal region B) Functional region C) Perceptual region
2. The transition zone where the dry climate of the Sahara Desert shifts into the tropical wet climate of Central Africa is best described as having what type of boundary?
A) Absolute line B) Transitional border C) Contested political border
3. Why are the boundaries of perceptual/vernacular regions like "The Midwest" or "The South" often overlapping and contested?
A) They are defined by official government documents. B) They rely on individual mental maps and informal perspectives.
Unit 1: Thinking Geographically • Topic 1.7 Page 4 of 4
Environmental Formal Region
Model Response: Unified by physical arid features, rainfall levels under 100mm, and matching desert sandy landforms across the entire desert geographic belt.
Spatial Diagram Sketching Lab Key Teacher Guide
Expectations for Sketch A:
Students should draw a crisp shape with a bold border (representing a political or environmental limit) and color or pattern the inside uniformly to show that the unifying trait is homogenous throughout.
Expectations for Sketch B:
Students should draw a prominent central dot labeled "Node" or "Focal Point." They must draw lines or arrows radiating outward that get thinner or lighter at the edges, demonstrating the decay of connection.
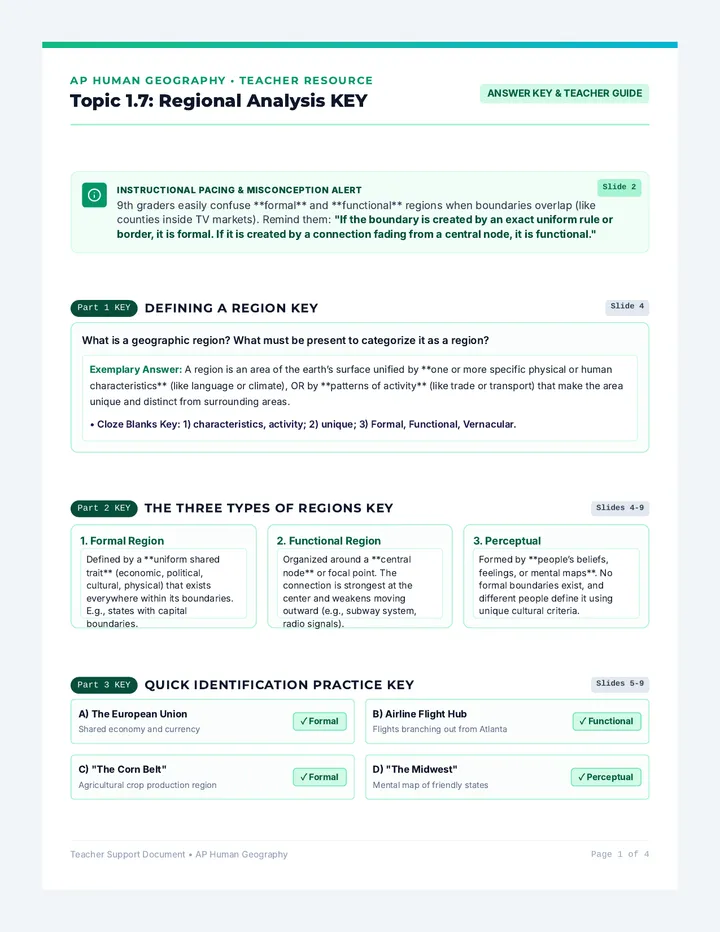
Part 6 KEY
Functional Regions: Nodes & Decay Key
Slides 7, 8
Q1: How does a television broadcast market function as a nodal region? Identify the node.
The transmitter tower or central city station acts as the **node**. The functional region is defined by the broadcast signal's reach. As you travel further from the node, signal strength decays (distance decay), defining the boundary where people can no longer watch that station.
Teacher Support Document • AP Human Geography Page 2 of 4
Perceptual Regions & Transition Zones Key
Answer Key • Topic 1.7
Part 6 KEY
Perceptual Regions Key Answers
Slide 9
Two different criteria used to draw "the South"? Why do borders differ?
Model Response: One person might define the South historically using Confederate state borders (11 states). Another might define it culturally by Baptist religious majorities or linguistically by dialect. These criteria differ because they rely on personal mental associations and subjective definitions of regional identity, which can vary wildly.
Model Response: Borders are transitional because human characteristics (like language, religion, or food) do not end abruptly at physical borders. Instead, culture shifts gradually across a border zone (e.g., blend of US and Mexican culture along the border).
Contested Regional Borders
Model Response: Since regions are human-constructed, people use different criteria. Some group Maryland with the Northeast due to high urbanization and wealth, while others group it with the South based on historical, agricultural, and cultural ties.
Teacher Support Document • AP Human Geography Page 3 of 4
AP FRQ Scoring & DOL Key
Answer Key • Topic 1.7
Part 8 KEY
Scoring Guidelines: AP Regional Analysis FRQ
Slides 12, 13
Task A: DEFINE functional region (1 Point).
Model Response: A functional region is an area of the earth's surface organized around a central node or focal point, which is connected to surrounding areas through transport, economic activities, or communication.
Task B: EXPLAIN how the Federal Reserve Districts map functions as a scale of analysis (1 Point).
Model Response: The map functions as a scale of analysis because it groups economic and banking data by regional boundaries rather than treating the country as one uniform entity. This allows researchers to isolate regional economic strengths or weaknesses, analyze local inflation rates, and target monetary policy to specific nodal economic centers.
Slides 3-13
Exit Ticket Multiple-Choice Answer Key
Question 1 Answer: States grouped by "Right to Work" law.
A) Formal region
Question 2 Answer: Sahara shifting into tropical climates.