Banana Ripening Lab Worksheet
Biology Laboratory Investigation
Carbohydrate Detective Lab
Tracking Starch Hydrolysis and Sugar Accumulation in Ripening Bananas
Name:
Date:
Partner(s):
Station:
Biochemical Context & Ripening Stages
Amylose → Glucose / Fructose via Amylase
Unripe green bananas store energy as insoluble starch (amylose & amylopectin). As ethylene gas triggers ripening, amylase hydrolyzes starch polymers into soluble, sweet reducing monosaccharides (glucose & fructose).
Stage 1: Green High starch (~80%), firm
Stage 2: Yellow Amylase hydrolyzing
Stage 3: Brown High sugar (>20%), soft
Safety:
• Wear splash goggles near hot bath • Lugol's iodine causes permanent biological stains • Always handle test tubes with metal clamps
Pre-Lab Inquiry: Carbohydrate Chemistry & Experimental Design
Complete Before Testing
1. Monosaccharide: Prefix "mono-" means: Chemical Ex: Food Ex:
2. Disaccharide: Prefix "di-" means: Chemical Ex: Food Ex:
3. Polysaccharide: Prefix "poly-" means: Chemical Ex: Food Ex:
4. Independent Variable (IV): Factor intentionally manipulated/tested:
5. Dependent Variable(s) (DV): Biochemical indicators/properties measured:
6. Hypothesis: If ripening advances, then starch/sugar levels will:
Reagents & Gear: Green, Yellow, & Brown Bananas • Lugol's Iodine • Benedict's Reagent • Boiling Water Bath (85-95°C) • Spot Plate & Tubes
A Part 1: Starch Indicator Assay (Lugol's Iodine Test)
Spot Plate • Room Temp
- Label four wells on a clean spot plate: G (Green), Y (Yellow), B (Brown), and C (Control: Distilled Water).
- Place a pea-sized sample (~0.5 g) of mashed banana into its well. Add 3 drops of distilled water to well C.
- Add 2 drops of Lugol's iodine reagent directly onto each sample. Do not touch dropper tips to samples.
- Observe immediately. Compare results to the visual standards on Page 2 and record in Table 1 & Table 2.
B Part 2: Reducing Sugar Assay (Benedict's Test)
Heat-Activated • Water Bath 85-95°C
- Number 4 heat-resistant glass test tubes: 1 (Green), 2 (Yellow), 3 (Brown), and 4 (Water Control).
- Add 1.0 g of mashed banana to tubes 1–3. Add 2.0 mL of distilled water to each tube and swirl to mix. (Tube 4 gets 2.0 mL water).
- Add 2.0 mL (approx. 40 drops) of Benedict's reagent to each tube. Swirl gently to blend.
- Place all tubes simultaneously into a boiling water bath (85–95°C) for exactly 4 minutes.
- Using clamps, transfer tubes to a rack. Compare color changes to the test diagrams on Page 2 and record data.
Unit 2: Biochemistry & Macromolecules Continue to Page 2 for Indicator Standards & Fruit Observations → Page 1 of 3
Chemical Indicator Standards & Ripening Observations
Visual test comparisons, student baseline recording, and stage-by-stage banana results.
Lab Station ID:
Lugol's Iodine Test Visual Standards Spot Plate Assay
Negative (-) Amber / Yellow
→
Positive (+++) Dark Blue / Black
Benedict's Test Color Gradient Boiled Tubes
None (-) Blue
Low (+) Green
Mod (++) Yellow
High (+++) Red
Table 1: Indicator Reference Standards (Record Test Outcomes) Write expected test results based on controls and visuals
| Indicator Reagent | Target Carbohydrate | Heat Required? | Negative Test Color (-) | Positive Test Color (+) |
|---|
| Lugol's Iodine | Starch (Amylose) | No (Room Temp) | | |
| Benedict's Solution | Reducing Sugars (Mono/Disaccharides) | Yes (Boiling Bath) | | |
Table 2: Banana Ripening Stages & Chemical Indicator Results Scale: (-) None, (+) Trace, (++) Moderate, (+++) Abundant
| Ripeness Stage & Picture | Physical Texture | Iodine Color | Starch | Benedict's Color | Simple Sugar | Carbohydrates |
|---|
| | | | | | |
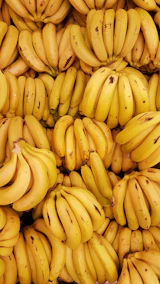 | | | | | | |
Stage 1: Green Unripe / Firm
| | | | | | |
|
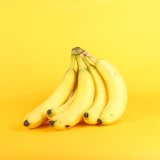
Stage 2: Yellow Ripe / Sweet
| | | | | | |
|

Stage 3: Brown Overripe / Soft
| | | | | | |
|
Control Distilled H₂O
| Clear liquid | | | | | |
Lab Station Analysis & Empirical Patterns
1. Inverse Relationship Pattern: State the relationship between starch abundance and simple reducing sugar abundance across ripening stages. Cite evidence from Table 2.
2. Control Validity: Why was distilled water tested in both assays? Explain what result would indicate contamination or a faulty indicator reagent.
Biochemistry Inquiry: Carbohydrate Transformations Continue to Page 3 for NYS Regents Cluster & Bar Graphing Task → Page 2 of 3
NYS Regents Biology Cluster
Fruit Ripening & Carbohydrate Metabolism
NYSSLS: HS-LS1-2, HS-LS1-6 & SEP-4
Phenomenon: Commercial fruit distributors harvest bananas while completely green. During transport, the plant hormone ethylene (C₂H₄) triggers transcription of the amylase gene. Amylase enzyme breaks insoluble starch down into soluble glucose:
Starch Polymer (C₆H₁₀O₅)ₙ + n H₂O —[ Amylase Enzyme ]→ Glucose Monomers n (C₆H₁₂O₆)
Table 3: Quantitative Glucose Concentration During Ripening Empirical spectrophotometric measurements
| Ripening Stage | Days Post-Harvest | Starch Content (%) | Glucose Concentration (g / 100g) |
|---|
| Stage 1: Green (Unripe) | Day 1 | ~80% | 1.5 |
| Stage 2: Breaking (Yellow-Green) | Day 4 | ~45% | 6.0 |
| Stage 3: Ripe (All Yellow) | Day 7 | ~12% | 14.5 |
| Stage 4: Overripe (Brown Flecks) | Day 10 | < 3% | 21.0 |
Graphing Task: Construct a Bar Graph of Glucose vs. Ripening Stage
Include: Title • Labeled Axes • Proper Scale • Data Bars
Graph Title:
Glucose (g/100g)
25 20 15 10 5 0 Day 1 (Green) Day 4 (Breaking) Day 7 (Yellow) Day 10 (Brown)
1. Macromolecule Subunit Structure (HS-LS1-6): Based on the biological model, which basic monomer is linked together in repetitive chains to synthesize the complex carbohydrate starch stored in plant cells?
(1) Glucose
(2) Amino acid
(3) Nucleotide
(4) Fatty acid
2. Data Trends & Energetics (HS-LS1-6): Using the data from Table 3 and your graph, describe the rate of glucose production between Day 1 and Day 10, and explain the metabolic advantage of soluble glucose over insoluble starch for cellular respiration in animal seed dispersers.
3. Plant Signaling & Storage Feedback (HS-LS1-3): A grocer places an unripe green banana (Day 1) into a sealed bag containing an overripe banana (Day 10). Predict whether the glucose concentration in the green banana will reach Day 7 levels faster or slower than a banana kept on an open counter. State the biochemical mechanism responsible.
Biochemistry Inquiry: Carbohydrate Transformations NYS Regents Life Science Biology Assessment Page 3 of 3