Dough Dynamics Slides
Bio-Kitchen Laboratory
Module 4: Bioenergetics
Microbiology & Cellular Respiration
Dough Dynamics:
The Living Chemistry of Bread
Investigating how microscopic yeast cells transform carbohydrates into energy, gas, and airy artisan loaves.
Cellular Respiration
Fermentation Pathways
Controlled Experiment
The Baking Mystery
Observation & Inquiry
Why Does Bread Have Air Holes?
Flour and water alone create dense, flat dough. Add a pinch of living yeast, and the mixture swells into a spongy, inflated matrix.
Every air pocket inside a slice of bread is the fossilized record of a gas bubble produced by cellular metabolism!
The Crumb Architecture
1. Gluten Network Stretchy proteins form elastic walls that trap escaping gas.
2. Gas Production Metabolic \( \text{CO}_2 \) expands and inflates thousands of microscopic cavities.
3. Thermal Setting Oven heat solidifies starches and proteins, locking the airy crumb in place.
Driving Question: What biological process generates this gas?
The Organism
Cellular Biology
Eukaryotic Microbe
Saccharomyces cerevisiae
"Sugar-eating fungus of the beer/bread"
Yeast are single-celled fungi possessing membranes, a nucleus, mitochondria, and enzyme systems just like human cells.
Facultative Anaerobe
Can switch between oxygen-dependent and oxygen-independent energy pathways!
Cytoplasm: Glycolysis Hub
Initial breakdown of glucose happens here without oxygen, releasing 2 net ATP.
Mitochondria: Aerobic Engine
When oxygen is plentiful, pyruvate enters mitochondria for maximum ATP synthesis.
Fermentation Regeneration
Without oxygen, yeast converts pyruvate into ethanol and \( \text{CO}_2 \) to recycle \( \text{NAD}^+ \).
Key Takeaway: The gas produced is a byproduct of yeast fueling its cellular survival!
Metabolic Comparison
Chemical Pathways
Aerobic Respiration + Oxygen
\( \text{C}_6\text{H}_{12}\text{O}_6 + 6\text{O}_2 \rightarrow 6\text{CO}_2 + 6\text{H}_2\text{O} + 36\text{--}38\text{ ATP} \)
- High energy yield (36-38 ATP per glucose)
- Occurs during initial dough mixing & kneading
- Byproducts: Water & Carbon Dioxide
Enables rapid yeast colony growth and initial expansion.
Alcoholic Fermentation No Oxygen
\( \text{C}_6\text{H}_{12}\text{O}_6 \rightarrow 2\text{C}_2\text{H}_5\text{OH} + 2\text{CO}_2 + 2\text{ ATP} \)
- Low energy yield (2 net ATP per glucose)
- Dominates inside dense proofing dough as \( \text{O}_2 \) depletes
- Byproducts: Ethanol (bakes off) & \( \text{CO}_2 \)
Both pathways generate carbon dioxide to inflate dough!
Notice: In both pathways, Carbon Dioxide (\( \text{CO}_2 \)) is released into the dough!
Inquiry Variables
Designing the Experiment
What Environmental Conditions Maximize Yeast Activity?
Bakers manipulate environmental inputs to control proofing time. Choose one independent variable to test:
Temperature
How kinetic energy influences enzyme collisions vs. protein denaturation.
e.g., Cold (4°C), Warm (37°C), Boiling (80°C+)
Sugar Substrate
How different carbohydrate structures affect enzymatic breakdown rates.
e.g., Glucose vs. Sucrose vs. Starch vs. Artificial
Salinity / Osmolarity
How osmotic pressure and salt affect water retention and cell membrane integrity.
e.g., 0% Salt vs. 1% Salt vs. 5% Salt
Scientific Rule: Change only ONE independent variable; keep all other variables rigorously controlled!
Measurement Protocol
Quantifying Gas Output
How Will You Measure Cellular Respiration?
Gas is invisible, so we quantify the physical displacement caused by carbon dioxide production over time.
A
Balloon Circumference
Attach an uninflated latex balloon over the mouth of a flask or test tube. As respiration generates \( \text{CO}_2 \), the balloon inflates.
Metric: Balloon circumference in cm using flexible tape every 5 minutes for 25 minutes.
B
Dough / Foam Column Rise
Mix standard flour-yeast slurry inside a transparent graduated cylinder. Trapped \( \text{CO}_2 \) bubbles force the column upward.
Metric: Total volume rise in milliliters (mL) or height in millimeters (mm) over time.
Record baseline measurements at time \( t = 0 \) minutes before incubation! Triplicate trials recommended
Student Deliverable
Experiment Report
Synthesizing Your Scientific Evidence
You will complete the 3-page Dough Dynamics Experiment Report.
Section 1
Hypothesis & Setup
Define independent, dependent, and controlled variables. Predict outcomes using biological theory.
Section 2
Data & Graphing
Record time-series metrics. Plot rate of gas production (\(\Delta \text{V} / \Delta t\)) across all treatments.
Section 3
CER & Bakery Link
State your Claim, cite quantitative Evidence, and explain the biological Reasoning (enzymes & ATP).
Ready to begin your investigation?
Equip your goggles and lab report!
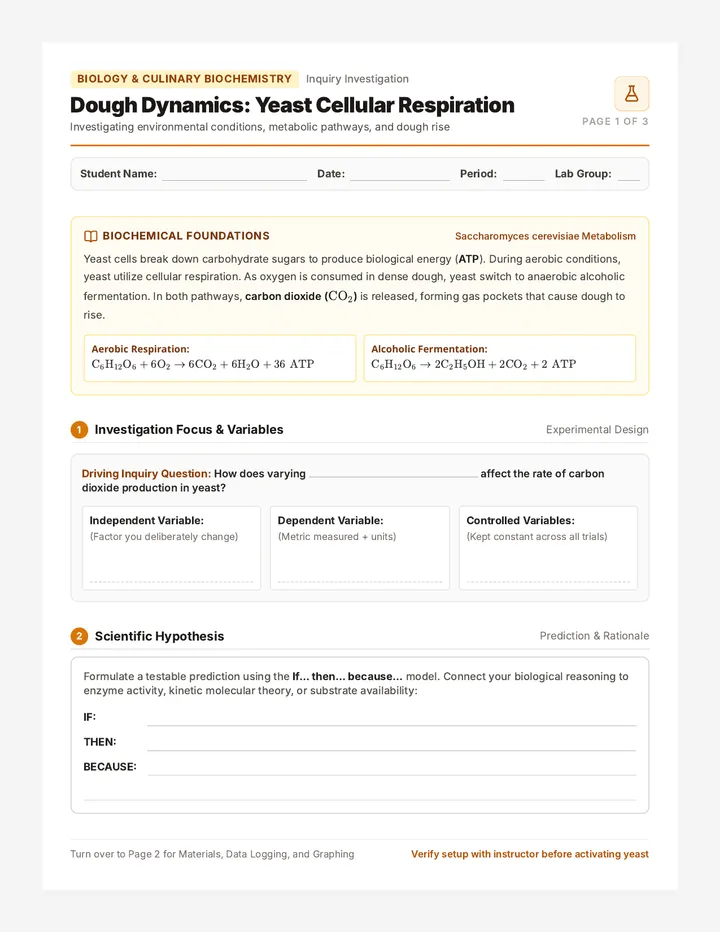
Dough Dynamics Lab Report
Biology & Culinary Biochemistry Inquiry Investigation
Dough Dynamics: Yeast Cellular Respiration
Investigating environmental conditions, metabolic pathways, and dough rise
Page 1 of 3
Student Name:
Date:
Period:
Lab Group:
Biochemical Foundations
Saccharomyces cerevisiae Metabolism
Yeast cells break down carbohydrate sugars to produce biological energy (ATP). During aerobic conditions, yeast utilize cellular respiration. As oxygen is consumed in dense dough, yeast switch to anaerobic alcoholic fermentation. In both pathways, carbon dioxide (\( \text{CO}_2 \)) is released, forming gas pockets that cause dough to rise.
Aerobic Respiration: \( \text{C}_6\text{H}_{12}\text{O}_6 + 6\text{O}_2 \rightarrow 6\text{CO}_2 + 6\text{H}_2\text{O} + 36\text{ ATP} \)
Alcoholic Fermentation: \( \text{C}_6\text{H}_{12}\text{O}_6 \rightarrow 2\text{C}_2\text{H}_5\text{OH} + 2\text{CO}_2 + 2\text{ ATP} \)
1 Investigation Focus & Variables
Experimental Design
Driving Inquiry Question: How does varying affect the rate of carbon dioxide production in yeast?
Independent Variable: (Factor you deliberately change)
Dependent Variable: (Metric measured + units)
Controlled Variables: (Kept constant across all trials)
2 Scientific Hypothesis
Prediction & Rationale
Formulate a testable prediction using the If... then... because... model. Connect your biological reasoning to enzyme activity, kinetic molecular theory, or substrate availability:
IF:
THEN:
BECAUSE:
Turn over to Page 2 for Materials, Data Logging, and Graphing Verify setup with instructor before activating yeast
Dough Dynamics Lab Report | Data Collection & Graphical Analysis
Page 2 of 3
3 Setup & Treatment Conditions
Record Specific Test Parameters
Condition A (Control)
Baseline standard parameters
Condition B (Treatment 1)
Experimental modification
Condition C (Treatment 2)
Experimental modification
4 Quantitative Data: Gas Production Over Time
Units: Circumference (cm) or Height (mm)
| Treatment Condition | 0 min (Base) | 5 min | 10 min | 15 min | 20 min | 25 min | Total \( \Delta \) |
|---|
|