Graph Shifters Station Booklet
PHYSICS MOTION LAB
GRAPH SHIFTERS
STATION BOOKLET
STUDENT EDITION
Name: _____________________
Date: __________
Period: ______
MISSION BRIEF
Welcome, Graph Shifter! Your mission is to master the physics of motion by translating graphs across dimensions. Remember the golden rules: Velocity (v) is the slope of the Position (d-t) graph. Acceleration (a) is the slope of the Velocity (v-t) graph.
STATION 1
The Matchmaker (Qualitative Analysis)
Analyze the three position-time (\(d-t\)) graphs below. Match each with its corresponding velocity-time (\(v-t\)) graph and acceleration-time (\(a-t\)) graph from the options below. Write your choices and justifications below.
Graph A
d t
Graph B
d t
Graph C
d t
Velocity Options (v-t)
- v-1: Constant negative value line below zero.
- v-2: Horizontal line sitting exactly on zero.
- v-3: Constant positive value line above zero.
Acceleration Options (a-t)
- a-1: Horizontal line sitting exactly on zero.
- a-2: Linear line sloping upward.
- a-3: Constant negative value line below zero.
Your Alignments & Analysis
Graph A Match
Velocity (v-t):
Accel. (a-t):
Physical justification:
Graph B Match
Velocity (v-t):
Accel. (a-t):
Physical justification:
Graph C Match
Velocity (v-t):
Accel. (a-t):
Physical justification:
Unit: Kinematics Graphing Station 1: The Matchmaker Page 1 of 4
PHYSICS MOTION LAB
GRAPH SHIFTERS
STATION BOOKLET
STUDENT EDITION
STATION 2
Slope Climbers (Quantitative Calculations)
Perform quantitative slope calculations on the segmented Position vs. Time (\(d-t\)) graph below. Use the coordinate points of each interval to calculate the exact velocity. Then, draw the corresponding Velocity vs. Time (\(v-t\)) graph on the grid.
Position vs. Time (d-t) Source Graph Examine the coordinate markers closely for calculations.
Pos d (m) Time t (s)
1086420
012345678910
(0,0) (2,8) (6,8) (10,0)
Slope Calculations
Interval 1: t = 0s to 2s Formula: \(\text{slope} = \frac{d_f - d_i}{t_f - t_i}\)
Work: _________________________
Velocity = ________ m/s
Interval 2: t = 2s to 6s
Work: _________________________
Velocity = ________ m/s
Interval 3: t = 6s to 10s
Work: _________________________
Velocity = ________ m/s
Your Velocity Plotting Grid
Plot the computed velocity values as horizontal steps across the corresponding time windows.
Vel v (m/s) Time t (s)
+4+20-2-4
012345678910
DRAW YOUR VELOCITY LINES ON THIS GRID
Unit: Kinematics Graphing Station 2: Slope Climbers Page 2 of 4
PHYSICS MOTION LAB
GRAPH SHIFTERS
STATION BOOKLET
STUDENT EDITION
STATION 3
Shift Masters (Reverse Engineering)
You are given a Velocity vs. Time (\(v-t\)) graph with linear segments. Your challenge is twofold: 1) Calculate acceleration (the slope) to sketch the Acceleration vs. Time (\(a-t\)) graph. 2) Calculate area under the curve to sketch the Position vs. Time (\(d-t\)) graph, starting at position \(d = 0\).
Source Velocity-Time Graph (v-t)
Vel v (m/s) Time (s)
+4+20-2-4
0123456789
1. Plot Position vs. Time (d-t) Compute area to find displacement. Start at (0,0).
Pos d (m) Time (s)
1086420
0123456789
2. Plot Acceleration vs. Time (a-t) Compute slope of velocity segments.
Accel (m/s²) Time (s)
+2+10-1-2
0123456789
Show Your Step Calculations
1. Displacement Calculations (Area)
0s to 3s:
Displacement = _______ m | Final position = _______ m
3s to 6s:
Displacement = _______ m | Final position = _______ m
2. Acceleration Calculations (Slope)
Slope of 0s to 3s interval:
Acceleration = _______ m/s²
Slope of 3s to 6s interval:
Acceleration = _______ m/s²
Unit: Kinematics Graphing Station 3: Shift Masters Page 3 of 4
PHYSICS MOTION LAB
GRAPH SHIFTERS
STATION BOOKLET
STUDENT EDITION
STATION 4
Motion Decoders (Physical Scenarios)
Read the real-world scenario of the pizza delivery robot below. Translate the physical narrative directly into kinematics graphs and verbal explanations of slopes.
THE DELIVERY ROBOT LOGS
"The autonomous pizza delivery robot starts at the pizza kitchen (position = 0 m). It rolls down a straight sidewalk at a constant velocity of 2 m/s for exactly 4 seconds. The robot then stops for 3 seconds to hand over a hot pepperoni pizza. After the hand-off, it reverses and speeds back towards the kitchen at -4 m/s for 2 seconds."
Position vs. Time (d-t) Sketch
Pos d (m) Time (s)
1086420
0123456789
Velocity vs. Time (v-t) Sketch
Vel v (m/s) Time (s)
+4+20-2-4
0123456789
Synthesis & Conceptual Check
1. In terms of direction, what does the negative velocity (-4 m/s) indicate in the robot's physical movement?
2. If a position-time graph has a perfectly horizontal flat line, what is its velocity? Why? Explain using the concept of slope.
3. Under what scenario would a velocity-time graph have a non-zero, flat horizontal acceleration? Describe the motion of such an object.
Unit: Kinematics Graphing Station 4: Motion Decoders Page 4 of 4
Graph Shifters Teacher Guide
PEDAGOGICAL STRATEGY
GRAPH SHIFTERS
FACILITATION GUIDE
TEACHER EDITION
Target Grade 9-12 (Physics/PS)
Pacing 45-60 Minutes
Group Size 3-4 Students
Math Level Algebra I Slopes
STATION SETUP CHECKLIST
- • Station 1: Print and laminate coordinate option cards or display them on tablets. Provide red/blue/green colored pencils.
- • Station 2: Ensure students have calculators. Grid lines are 1-unit spaced for straightforward rise-over-run calculation.
- • Station 3: Provide rulers/straightedges to draw perfect flat and slanted slope segments on blank grids.
- • Station 4: Post a small "Pizza Robot" sign or prop (optional toy robot) to add a creative, contextual lab anchor.
MISCONCEPTION ALERT
The "Hill-Climbing" Fallacy:
Students often read position-time graphs as literal physical hills. Emphasize that a positive slope means moving forward along a flat horizontal sidewalk, not walking uphill.
Slope to Value Translation:
When shifting from \(d-t\) to \(v-t\), students struggle to realize that a constant slanted line turns into a flat, horizontal constant value line. Use physical demonstration of walking.
Pacing & Differentiation Strategy
Pacing Blueprint:
- Introduction (5 min): Demonstrate a "slope walk" across the room to show how velocity matches slope.
- Station Rotation (40 min): Divide students into groups of 3-4. Spend 10 minutes at each of the 4 stations.
- Debrief & Summary (10 min): Discuss Station 4 robot kinematics and clear up remaining doubts.
Differentiation Paths:
- Scaffolding support: For struggling students, write down the rise and run points explicitly on Station 2 and walk them through one calculation.
- Extension challenge: Challenge advanced students to explain what occurs to acceleration during "instantaneous" velocity changes in Station 3 (concept of infinite acceleration spikes).
The "Slope Shift" Matrix
| Position-Time Graph (\(d-t\)) | Velocity-Time Graph (\(v-t\)) | Acceleration-Time Graph (\(a-t\)) |
|---|
|
Graph Shifters Quick Guide
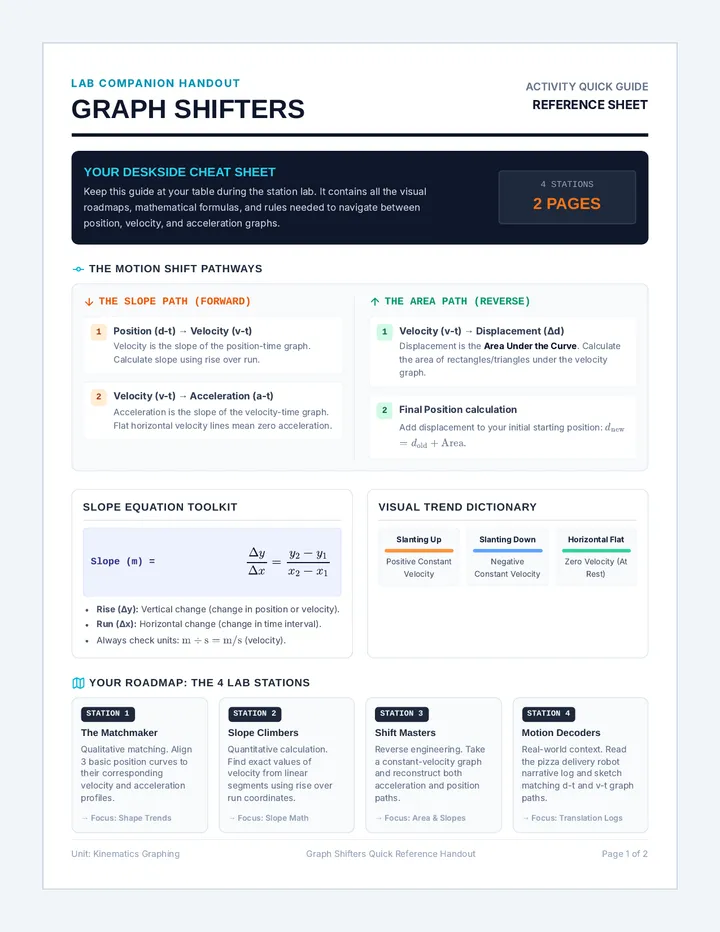
LAB COMPANION HANDOUT
GRAPH SHIFTERS
ACTIVITY QUICK GUIDE
REFERENCE SHEET
YOUR DESKSIDE CHEAT SHEET
Keep this guide at your table during the station lab. It contains all the visual roadmaps, mathematical formulas, and rules needed to navigate between position, velocity, and acceleration graphs.
4 STATIONS 2 PAGES
THE MOTION SHIFT PATHWAYS
THE SLOPE PATH (FORWARD)
1
Position (d-t) → Velocity (v-t)
Velocity is the slope of the position-time graph. Calculate slope using rise over run.
2
Velocity (v-t) → Acceleration (a-t)
Acceleration is the slope of the velocity-time graph. Flat horizontal velocity lines mean zero acceleration.
THE AREA PATH (REVERSE)
1
Velocity (v-t) → Displacement (Δd)
Displacement is the Area Under the Curve. Calculate the area of rectangles/triangles under the velocity graph.
2
Final Position calculation
Add displacement to your initial starting position: \(d_{\text{new}} = d_{\text{old}} + \text{Area}\).
SLOPE EQUATION TOOLKIT
Slope (m) = \[\frac{\Delta y}{\Delta x} = \frac{y_2 - y_1}{x_2 - x_1}\]
- Rise (Δy): Vertical change (change in position or velocity).
- Run (Δx): Horizontal change (change in time interval).
- Always check units: \(\text{m} \div \text{s} = \text{m/s}\) (velocity).
VISUAL TREND DICTIONARY
Slanting Up
Positive Constant Velocity
Slanting Down
Negative Constant Velocity
Horizontal Flat
Zero Velocity (At Rest)
YOUR ROADMAP: THE 4 LAB STATIONS
Station 1 The Matchmaker
Qualitative matching. Align 3 basic position curves to their corresponding velocity and acceleration profiles.
→ Focus: Shape Trends
Station 2 Slope Climbers
Quantitative calculation. Find exact values of velocity from linear segments using rise over run coordinates.
→ Focus: Slope Math
Station 3 Shift Masters
Reverse engineering. Take a constant-velocity graph and reconstruct both acceleration and position paths.
→ Focus: Area & Slopes
Station 4
Graph Shifters Station Cards
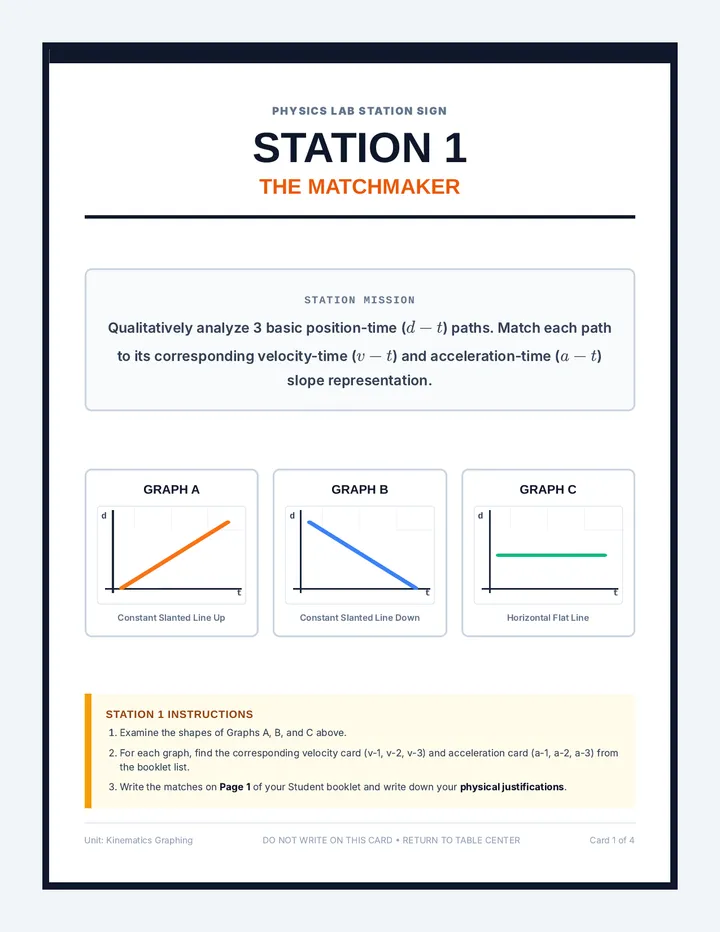
PHYSICS LAB STATION SIGN
STATION 1
THE MATCHMAKER
STATION MISSION
Qualitatively analyze 3 basic position-time (\(d-t\)) paths. Match each path to its corresponding velocity-time (\(v-t\)) and acceleration-time (\(a-t\)) slope representation.
GRAPH A
d t
Constant Slanted Line Up
GRAPH B
d t
Constant Slanted Line Down
GRAPH C
d t
Horizontal Flat Line
STATION 1 INSTRUCTIONS
- Examine the shapes of Graphs A, B, and C above.
- For each graph, find the corresponding velocity card (v-1, v-2, v-3) and acceleration card (a-1, a-2, a-3) from the booklet list.
- Write the matches on Page 1 of your Student booklet and write down your physical justifications.
Unit: Kinematics Graphing DO NOT WRITE ON THIS CARD • RETURN TO TABLE CENTER Card 1 of 4
PHYSICS LAB STATION SIGN
STATION 2
SLOPE CLIMBERS
STATION MISSION
Perform rise-over-run calculations for three linear segments of a multi-part Position vs. Time (\(d-t\)) graph to obtain numerical values of velocity.
SOURCE POSITION-TIME (d-t) GRAPH
1086420
012345678910
Position d (m) Time t (s) (0,0) (2,8) (6,8) (10,0)
STATION 2 INSTRUCTIONS
- Locate Page 2 of your booklet.
- For each interval (0-2s, 2-6s, 6-10s), write down the coordinate endpoints and calculate the slope: \(v = \frac{\Delta d}{\Delta t}\).
- Use your calculated slopes to plot a corresponding Velocity vs. Time (v-t) graph in the blank student grid.
Unit: Kinematics Graphing DO NOT WRITE ON THIS CARD • RETURN TO TABLE CENTER Card 2 of 4
PHYSICS LAB STATION SIGN
STATION 3
SHIFT MASTERS
STATION MISSION
Perform a dual shift! Starting with a segmented Velocity-Time graph, calculate slopes to plot an Acceleration graph, and calculate area bounds to plot a Position graph.
SOURCE VELOCITY-TIME (v-t) GRAPH
+4+20-2-4
0123456789
Velocity v (m/s) Time t (s)
STATION 3 INSTRUCTIONS
- Locate Page 3 of your booklet.
- Displacement (Area): Calculate the area of the rectangle for each 3-second block (Base × Height). Accumulate these values from a start point of (0,0) to plot position on grid 1.