A lesson exploring the complex social hierarchy of the Antebellum South, challenging the myth that all Southerners were slaveholders while analyzing the economic and social factors that sustained the institution of slavery.
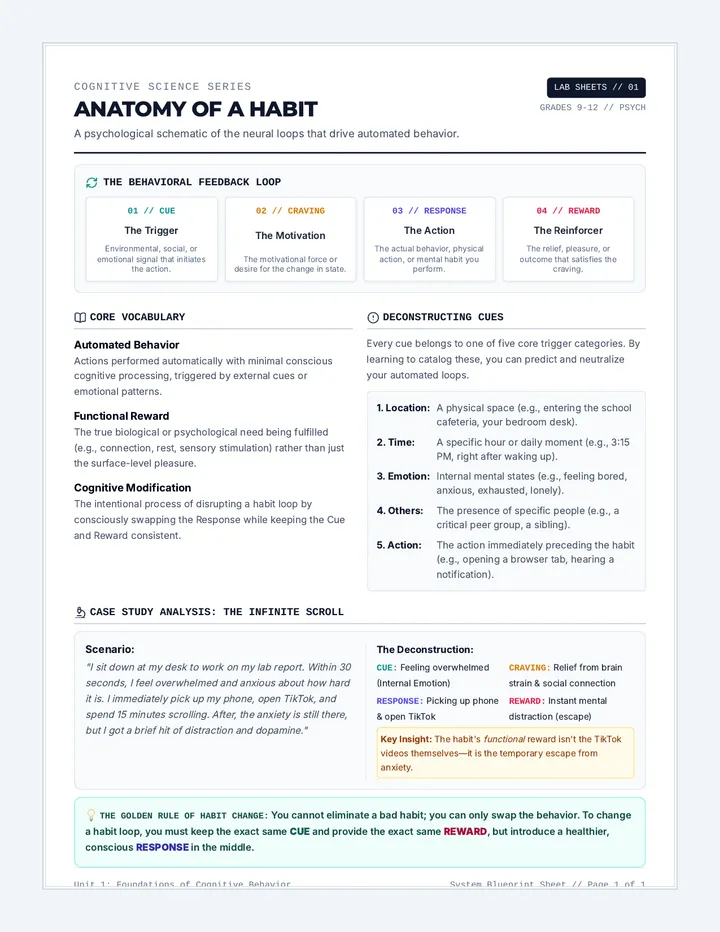
A three-part cognitive psychology series designed for Grades 9-12. Students learn the science of automation, explore how to isolate triggers and cravings, redesign unhelpful routines, and restructure their environments to make habit modification effortless.
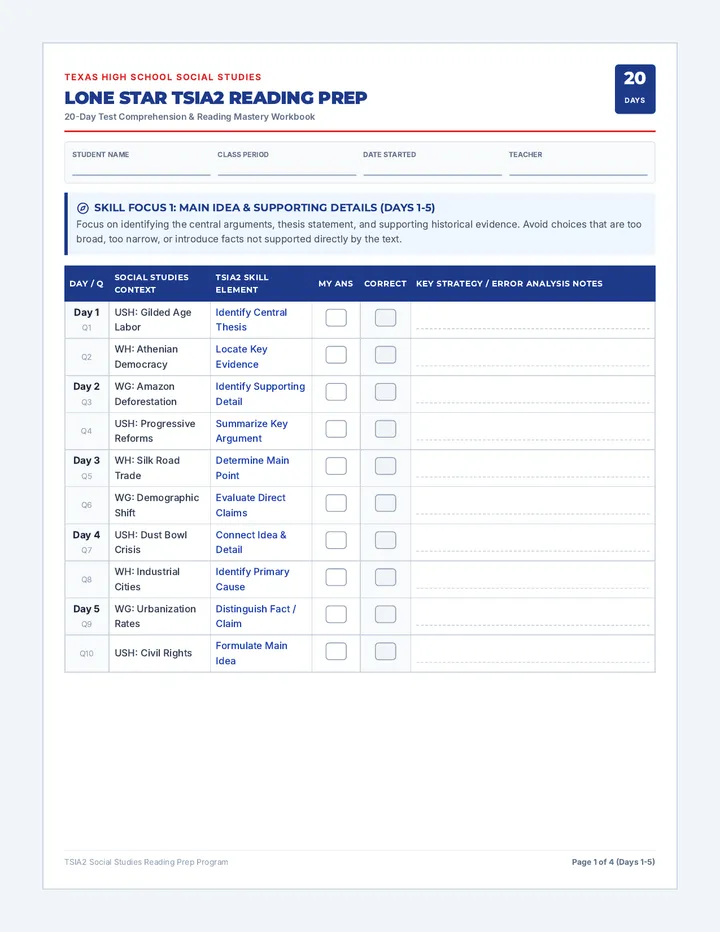
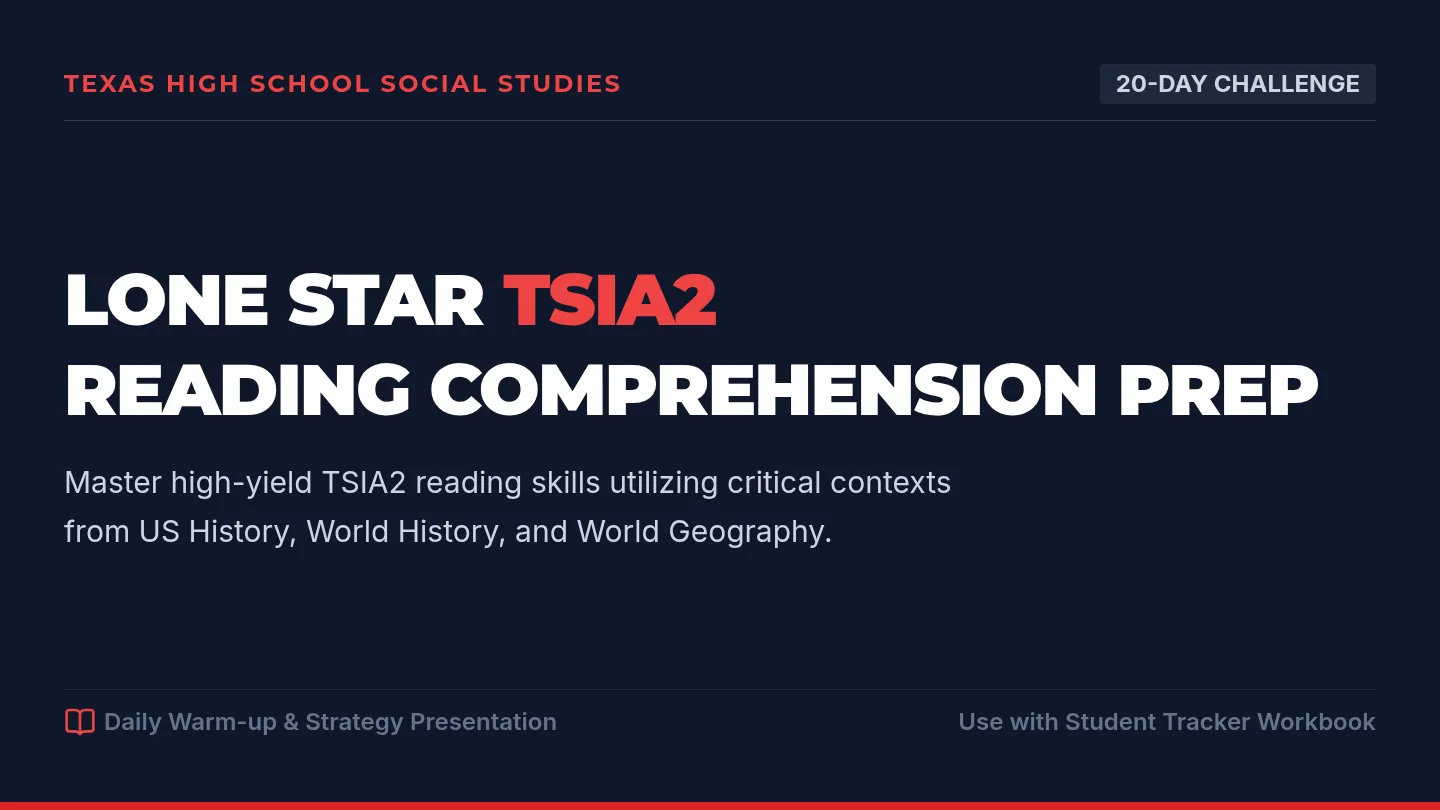
A comprehensive 20-day test preparation program combining Texas High School Social Studies content (US History, World History, and World Geography) with high-yield TSIA2 Reading comprehension skills, complete with daily warm-up slides and a highly-structured student tracking workbook.
A 46-slide interactive presentation designed for the 20-day TSIA2 Reading Prep program. Features alternate Question and Answer/Strategy slides matching the social studies contexts (US History, World History, and World Geography) and skills on the tracker sheet. Fully stylized with deep navy and crimson, using high-yield passages, identical answer choice styling, and clear strategic breakdowns with text sizing strictly kept at or above 24px.
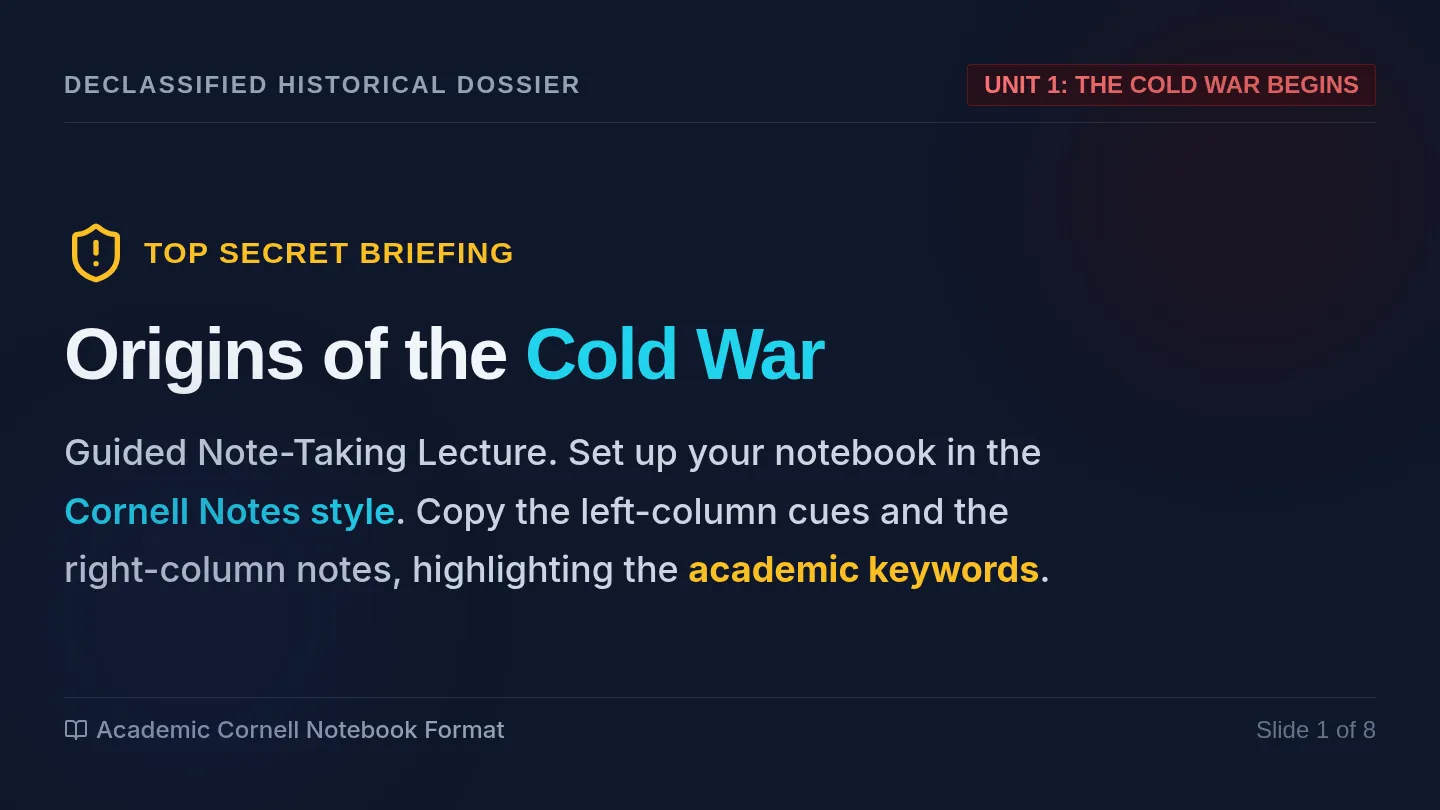
Create a multi-lesson sequence covering the Cold War, focusing on origins, global expansion, and domestic impacts.
Satu slot pengajaran interaktif mengenai kegiatan ekonomi utama di dunia termasuk primer, sekunder, dan tertier. Slaid ini membimbing murid memahami impak sektor ekonomi kepada manusia dan negara melalui aktiviti perbincangan dan tiket keluar.
A highly-structured 4-page printable student tracking workbook for the 20-day TSIA2 Social Studies reading prep. Contains custom grids for all 40 questions with designated spaces for student answers, correct answers, English skills, and strategy notes.
A comprehensive unit on child development from birth through age 18, focusing on physical, cognitive, and social-emotional growth across early childhood, middle childhood, and adolescence.
Lesson 8 of the Habit Architects unit. Students learn how to design personal reward structures and periodic tracking audits to maintain long-term habit health and recover quickly from routine disruptions.
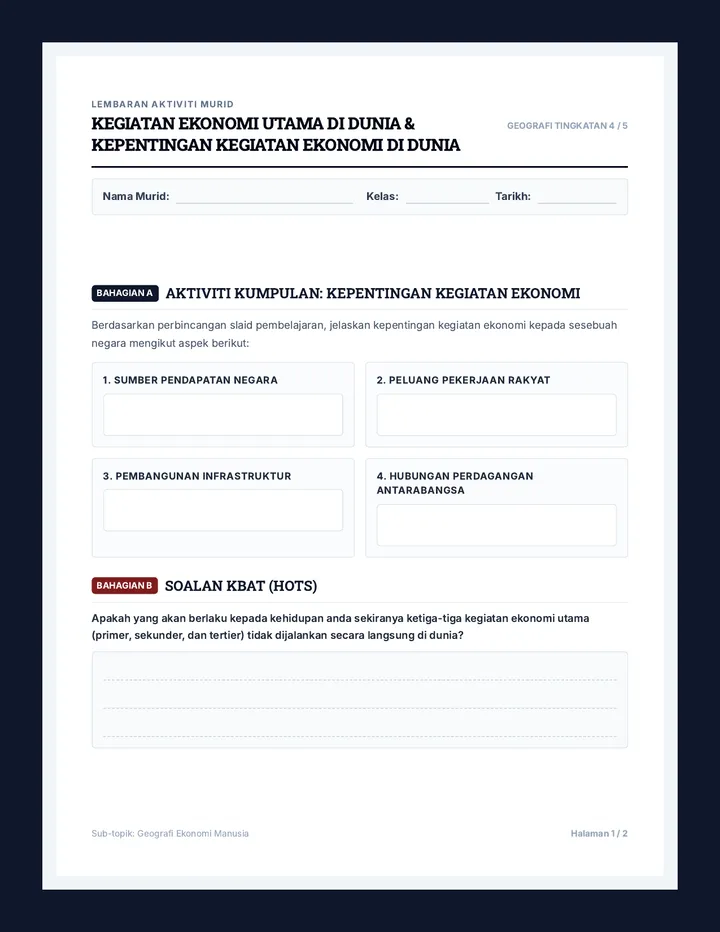
Lembaran kerja bercetak dua muka surat bertemakan Minimalist Academic. Mengandungi ruang catatan Aktiviti Kumpulan, soalan KBAT, dan templat Tiket Keluar (Exit Ticket) yang sepadan dengan slaid pengajaran.
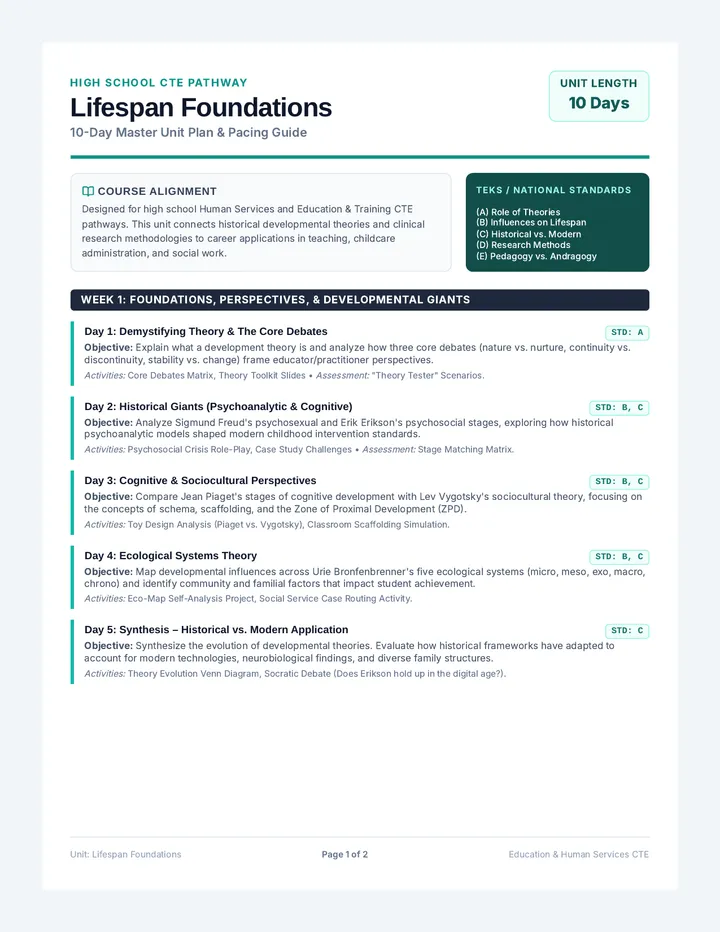
A comprehensive instructional sequence designed for high school CTE pathways in Education & Training and Human Services. The unit introduces students to the foundational theories, modern research methodologies, and instructional models (pedagogy vs. andragogy) that govern lifespan human development.
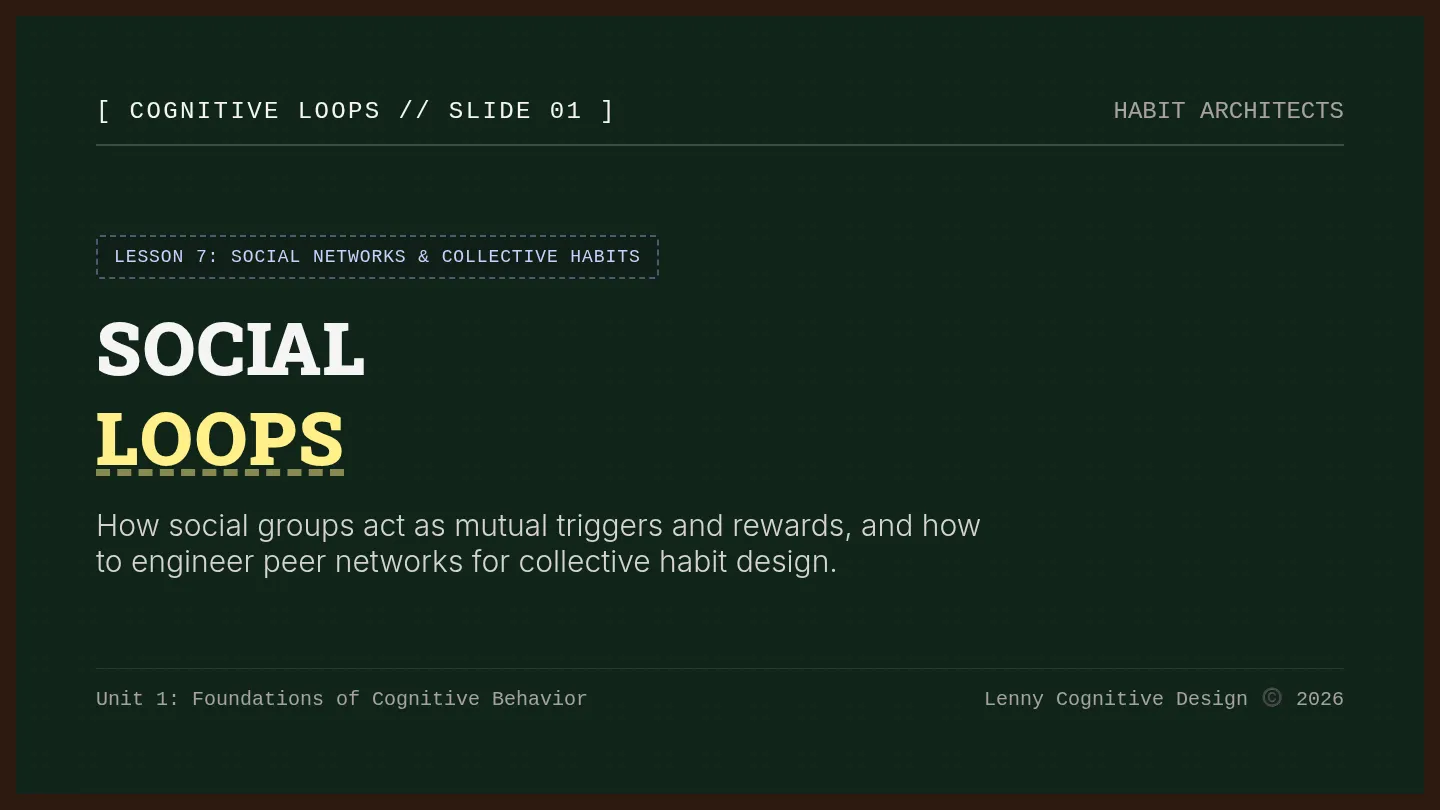
Lesson 7 of the Habit Architects unit. Students deconstruct how social groups influence habit cues and design supportive loops to engineer collective habits.
Slaid pengajaran interaktif bertemakan Minimalist Academic mengenai kegiatan ekonomi utama di dunia serta kepentingan kegiatan ekonomi. Mengandungi maklumat sektor ekonomi primer, sekunder, dan tertier serta objektif pembelajaran dan aktiviti pengukuhan murid.