Plague Trail Slides Plague Trail
Mapping the Spread of the Black Death
6th Grade Social Studies
Warm-up: Moving Worlds
Look at the modern trade routes on the map.
Key Questions:
Modern Trade Route Comparison Map
Think about speed, safety, and the "invisible passengers" that might hitch a ride.
The Black Death Arrives
Embedded media
Watch: 0:00 - 3:24
Look For:
Your Mission: Mapping the Plague
Gather Your Supplies:
Blank Map
Colored Pencils
Data Point Sheet
The Instructions:
1
Color-code the spread by year (1347-1351).
2
Trace the Silk Road (overland) in brown.
3
Draw Sea Routes in blue dots.
The Shadow of History
"If the plague happened today, would it spread faster or slower ? Why?"
Think About:
✈️ Modern Air Travel
🏥 Modern Medicine/Vaccines
Think About:
🚿 Public Sanitation
📱 Information Sharing
Plague Trail Worksheet Plague Trail Investigation
Geographic Spread of the Black Death (1347–1351)
Student:
Date:
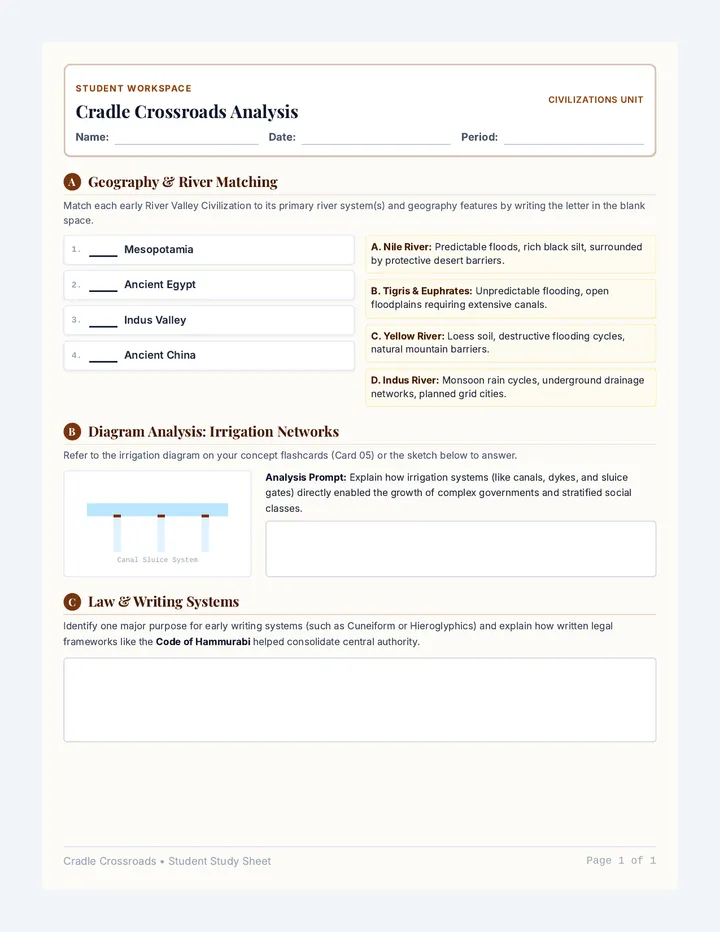
Part 1: Video Evidence
Watch the video segment (0:00–3:24) and answer the following questions based on the geographic clues provided.
1. Which specific geographic areas were hit by the plague first? Why do you think this was the case?
2. Based on the video, why were coastal cities more vulnerable than inland villages at the start of the outbreak?
3. Why did the disease spread so quickly across Europe once it arrived? (Think about sanitation and living conditions).
Part 2: Mapping Chronology
Data Points for Your Map:
1347: Sicily, Constantinople, Messina (Italy/Byzantine)
1348: Mainland Italy, France, Spain, North Africa
1349: England, Germany, Austria, Switzerland
1350: Scandinavia (Norway/Sweden), Scotland, Iceland
1351: Russia, Northern Poland
Trade Routes: Overland Silk Road from Asia; Maritime paths across the Mediterranean.
Mapping Instructions:
Phase 1: Use different colors (or shades of one color) to fill in the regions hit in each year listed above. Create a legend on your map!
Phase 2: Trace the Silk Road (overland route) using a solid brown line. Show how it enters the Black Sea area.
Phase 3: Draw Sea Routes using dashed blue lines connecting major port cities mentioned in the data.
Part 3: Final Reflection
If the plague happened today, would it spread faster or slower than it did in 1347? Support your answer with at least two reasons based on modern technology vs. medieval conditions.
Plague Trail Map Worksheet Black Death Geographic Map
Student Investigation Map
1347–1351 C.E.
Mediterranean Sea Black Sea England France Spain Italy Germany Poland Russia North Africa Asia Minor Scandinavia Messina Constantinople
Mapping Subject:
The Path of the Plague
Use the legend below to color-code by year.
N
Map Legend
1347: Arrival
1348: Rapid Growth
1349: Central Europe
1350: Northern Reach
1351: Final Waves
Silk Road Route
Step 1: Color
Fill each region using colors to match the years in the legend.
Step 2: Trace
Trace the Silk Road and draw dashed blue lines for sea routes.
Plague Trail Teacher Guide Teacher Resource
Plague Trail Facilitation Guide
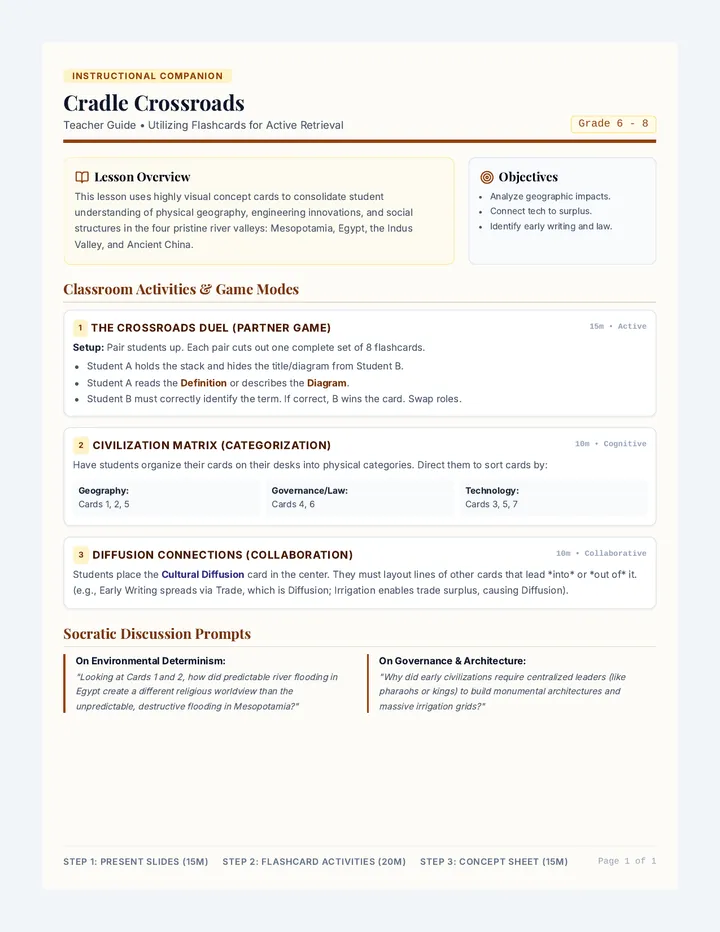
Lesson: Geographic Spread of the Black Death
6th Grade Social Studies
Duration
45–50 Minutes
Objective
Students will map the spread of the plague and identify trade as the primary conduit for transmission.
Preparation Checklist
Print **Plague Trail Worksheet** (1 per student)
Print **Plague Trail Map Worksheet** (1 per student)
Check tech: YouTube link (0:00–3:24)
Prepare colored pencils (Blue, Brown, and 4-5 others for years)
Instructional Pacing
5 min
Warm-up: Moving Worlds
Use Slide 2. Discuss how Amazon or FedEx moves goods today vs. camel caravans and wooden ships in 1347. Highlight the difference in **speed**.
10 min
Video Investigation
Segment: 0:00–3:24
Pause at **2:25** (Silk Road) and **3:13** (Map). Ensure students are filling out Part 1 of their worksheet during the pauses.
25 min
Mapping Activity
Students use the data table on the worksheet to color the map. **Key concept:** They should see the plague "creep" from the Mediterranean ports (1347-48) north toward Russia (1351).
Worksheet Answer Key
Part 1: Video Questions
Q1 (Initial areas): Coastal/Port areas like Sicily, Messina, and Italy. Reason: Ships arrived from Asia carrying infected rats/fleas directly to docks.
Q2 (Coastal vs Inland): Coastal cities were trade hubs. Ships docked frequently, meaning more "points of entry." Inland cities only got it after travelers walked or rode there from the ports.
Q3 (Speed factors): Lack of germ theory (miasma theory), crowded/filthy cities, poor sanitation, and living in close proximity to animals.
Part 2: Map Accuracy Check
Silk Road: Should enter the map from the East, leading to the Black Sea/Constantinople.
Sea Routes: Should connect the Black Sea to Italy (Messina/Genoa) and then to France/England.
Chronology: South (1347) $\rightarrow$ Central (1348-49) $\rightarrow$ North/East (1350-51).
Discussion Booster: Modern vs. Medieval
Faster Today: Global flights can move an infected person around the world in < 24 hours (vs. months for a medieval ship).
Slower Today: Modern medicine, quarantine protocols, sanitation (no rats in homes), and vaccines can slow or stop transmission.