Metabolism Enzymes Retake Quiz
Name:
Date:
Period:
Quiz (Retake): Metabolism & Enzymes
AP Biology • Energy & Catalysis
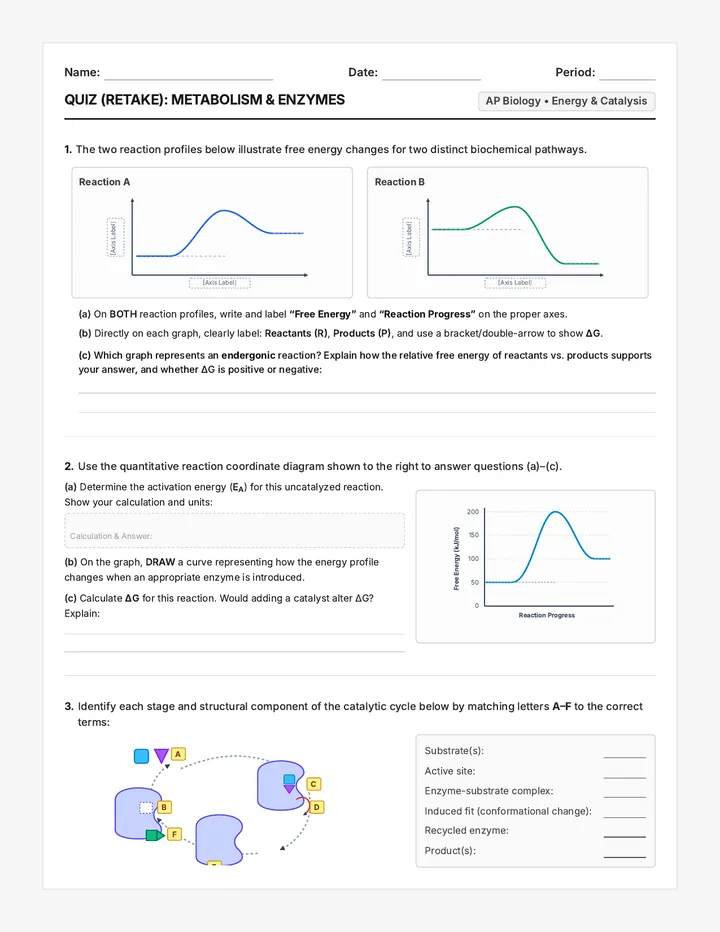
The two reaction profiles below illustrate free energy changes for two distinct biochemical pathways.
Reaction A [Axis Label] [Axis Label]
Reaction B [Axis Label] [Axis Label]
(a) On BOTH reaction profiles, write and label “Free Energy” and “Reaction Progress” on the proper axes.
(b) Directly on each graph, clearly label: Reactants (R), Products (P), and use a bracket/double-arrow to show ΔG.
(c) Which graph represents an endergonic reaction? Explain how the relative free energy of reactants vs. products supports your answer, and whether ΔG is positive or negative:
Use the quantitative reaction coordinate diagram shown to the right to answer questions (a)–(c).
(a) Determine the activation energy (EA) for this uncatalyzed reaction. Show your calculation and units:
Calculation & Answer:
(b) On the graph, DRAW a curve representing how the energy profile changes when an appropriate enzyme is introduced.
(c) Calculate ΔG for this reaction. Would adding a catalyst alter ΔG? Explain:
0 50 100 150 200 Free Energy (kJ/mol) Reaction Progress
Identify each stage and structural component of the catalytic cycle below by matching letters A–F to the correct terms:
A B C D E F
Substrate(s):
Active site:
Enzyme-substrate complex:
Induced fit (conformational change):
Recycled enzyme:
Product(s):
Quiz (Retake): Metabolism & Enzymes Page 2 of 2
Enzyme kinetics can be altered by various regulatory inhibitors. The graph below displays initial reaction velocity (V0) across increasing substrate concentrations under three distinct experimental conditions: no inhibitor, with a competitive inhibitor, and with a noncompetitive inhibitor.
Reaction Rate (V) Substrate Concentration [S] Theoretical Vmax 1 2 3
(a) Identify the exact condition represented by each numbered curve:
• Curve 1 represents:
• Curve 2 represents:
• Curve 3 represents:
(b) Explain why Curve 2 is still capable of reaching the same maximal velocity (Vmax) as Curve 1 at sufficiently high substrate concentrations:
(c) Explain on a conformational/molecular level why Curve 3 cannot reach the original Vmax, regardless of how much substrate is added:
Part 2 — Biochemical Vocabulary
Words are used once; not all words will be used.
• kinetic energy • catabolic pathway • exergonic • competitive inhibitor • potential energy • anabolic pathway • endergonic • noncompetitive inhibitor • enthalpy • metabolism • cofactor • allosteric site • entropy • enzyme • coenzyme • active site • free energy (ΔG) • substrate • denature • 1st law of thermodynamics • chemical bonds • saturated • activation energy • 2nd law of thermodynamics
-
A reaction that releases free energy to its surroundings and occurs spontaneously (ΔG < 0).
-
The physical law stating that energy can neither be created nor destroyed, only transformed.
-
Metabolic pathway that consumes energy to assemble complex macromolecules from simpler precursors.
-
The specific pocket or catalytic cleft on an enzyme where reactant molecules bind.
-
An inorganic non-protein helper molecule (such as zinc, iron, or magnesium) required for enzyme activity.
-
Inhibitor that binds to a regulatory region other than the active site, inducing an unfavorable conformational change.
-
The energy possessed by an object or molecular particles by virtue of their motion.
-
The disruption and loss of an enzyme’s tertiary 3D structure due to extreme temperature or pH, abolishing activity.
-
The physiological condition reached when all active sites across an enzyme population are occupied by substrate.
-
The total thermodynamic heat content or internal energy of a chemical system at constant pressure (H).
-
The minimum threshold quantity of initial energy needed to push reactant molecules into their transition state.
Metabolism Enzymes Teacher Key
Teacher Scoring Key
Metabolism & Enzymes (Retake)
Total: 25 Points
AP Biology • Energy, Enzymes & Catalysis • Retake Assessment Version
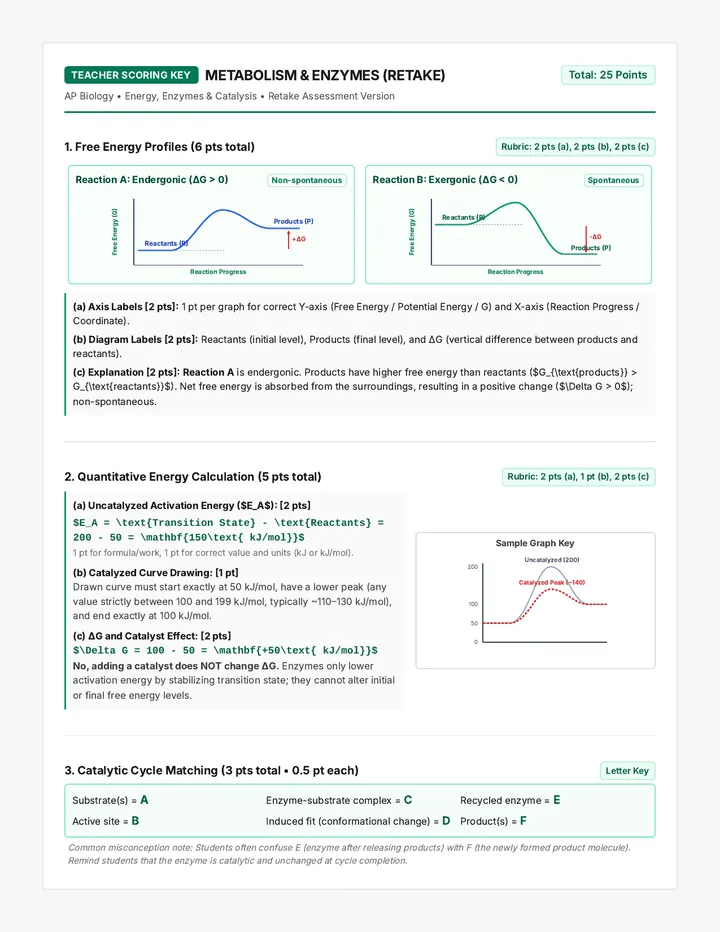
1. Free Energy Profiles (6 pts total) Rubric: 2 pts (a), 2 pts (b), 2 pts (c)
Reaction A: Endergonic (ΔG > 0) Non-spontaneous
Free Energy (G) Reaction Progress Reactants (R) Products (P) +ΔG
Reaction B: Exergonic (ΔG < 0) Spontaneous
Free Energy (G) Reaction Progress Reactants (R) Products (P) -ΔG
(a) Axis Labels [2 pts]: 1 pt per graph for correct Y-axis (Free Energy / Potential Energy / G) and X-axis (Reaction Progress / Coordinate).
(b) Diagram Labels [2 pts]: Reactants (initial level), Products (final level), and ΔG (vertical difference between products and reactants).
(c) Explanation [2 pts]: Reaction A is endergonic. Products have higher free energy than reactants ($G_{\text{products}} > G_{\text{reactants}}$). Net free energy is absorbed from the surroundings, resulting in a positive change ($\Delta G > 0$); non-spontaneous.
2. Quantitative Energy Calculation (5 pts total) Rubric: 2 pts (a), 1 pt (b), 2 pts (c)
(a) Uncatalyzed Activation Energy ($E_A$): [2 pts]
$E_A = \text{Transition State} - \text{Reactants} = 200 - 50 = \mathbf{150\text{ kJ/mol}}$
1 pt for formula/work, 1 pt for correct value and units (kJ or kJ/mol).
(b) Catalyzed Curve Drawing: [1 pt]
Drawn curve must start exactly at 50 kJ/mol, have a lower peak (any value strictly between 100 and 199 kJ/mol, typically ~110–130 kJ/mol), and end exactly at 100 kJ/mol.
(c) ΔG and Catalyst Effect: [2 pts]
$\Delta G = 100 - 50 = \mathbf{+50\text{ kJ/mol}}$
No, adding a catalyst does NOT change ΔG. Enzymes only lower activation energy by stabilizing transition state; they cannot alter initial or final free energy levels.
Sample Graph Key 0 50 100 200 Catalyzed Peak (~140) Uncatalyzed (200)
3. Catalytic Cycle Matching (3 pts total • 0.5 pt each) Letter Key
Substrate(s) = A
Active site = B
Enzyme-substrate complex = C
Induced fit (conformational change) = D
Recycled enzyme = E
Product(s) = F
Common misconception note: Students often confuse E (enzyme after releasing products) with F (the newly formed product molecule). Remind students that the enzyme is catalytic and unchanged at cycle completion.
Quiz Retake Answer Key: Metabolism & Enzymes Page 2 of 2
4. Enzyme Kinetics & Inhibitors (5 pts total) Rubric: 1.5 pts (a), 1.5 pts (b), 2 pts (c)
(a) Identification [1.5 pts • 0.5 pt each]:
Curve 1:
No inhibitor (uninhibited / normal)
Curve 2:
Competitive inhibitor
Curve 3:
Noncompetitive inhibitor
(b) Why Curve 2 reaches original $V_{\max}$ at high $[S]$: [1.5 pts]
Competitive inhibitors bind reversibly to the active site, directly competing with the substrate. When substrate concentration $[S]$ is made sufficiently high, substrate molecules vastly outnumber inhibitor molecules, effectively outcompeting them for active site occupancy. Thus, the enzyme achieves its normal maximum catalytic capacity ($V_{\max}$).
(c) Why Curve 3 cannot reach original $V_{\max}$ (Molecular Mechanism): [2 pts]
Noncompetitive inhibitors bind to an allosteric site (separate regulatory site), not the active site. This binding alters the enzyme’s tertiary conformation, warping the active site so it functions less effectively or cannot catalyze the reaction. Because substrate and inhibitor do not compete for the same site, adding excess substrate cannot displace the inhibitor or restore catalytic function, resulting in a permanently depressed $V_{\max}$.
Part 2 — Biochemical Vocabulary Solutions (11 pts • 1 pt each)
Questions 5–15
| # |
Correct Vocabulary Term |
Tested Definition / Key Concept |
| 5. |
exergonic |
Releases free energy, occurs spontaneously (ΔG < 0). |
| 6. |
1st law of thermodynamics |
Energy cannot be created or destroyed, only transformed. |
| 7. |
anabolic pathway |
Consumes energy to assemble complex macromolecules from simple units. |
| 8. |
active site |
Catalytic pocket where substrate molecules bind. |
| 9. |
cofactor |
Inorganic non-protein helper (e.g. minerals: Zn, Fe, Mg). |
| 10. |
noncompetitive inhibitor |
Binds to non-active / allosteric site causing conformational distortion. |
| 11. |
kinetic energy |
Energy associated with relative motion of matter. |
| 12. |
denature |
Loss of native 3D tertiary protein structure due to extreme heat or pH. |
| 13. |
saturated |
Condition when 100% of enzyme active sites are occupied. |
| 14. |
enthalpy |
Total thermodynamic heat content of a chemical system (H). |
| 15. |
activation energy |
Minimum threshold energy needed to reach transition state. |
Retake Diagnostic Tip: If students missed Q2 or Q4, review the distinction between kinetic barriers ($E_A$) and thermodynamic changes ($\Delta G$). Emphasize that enzymes and inhibitors alter transition states and reaction rates, but never shift equilibrium or $\Delta G$.