Enzyme Curves Worksheet
Enzyme Kinetics Graphing
Part I: Temperature Profiles • Part II: Substrate Saturation
Name: Date:
Period: Score: / 25
Core Concept: Enzymes are biological catalysts. Their reaction rates depend on kinetic collision frequency and tertiary protein conformation.
Biology Lab
1 Temperature vs. Catalytic Velocity
[Graph A: Human Salivary Amylase]
0 15 30 45 60 75 Temperature (°C) Rate (% Max) 0 50 100 T_opt (37°C)
0–37°C: Kinetic collision rise >40°C: Denaturation drop
a) Rate Behavior in Region A (0°C → 37°C):
Explain at the molecular level why reaction rate increases with temperature up to 37°C. Reference kinetic energy and collision frequency.
b) Precipitous Decline in Region B (>40°C):
Why does reaction velocity drop abruptly past 40°C instead of tapering gradually? Name the specific structural change occurring to the active site.
c) Temperature Reversibility Prediction:
If the enzyme is cooled from 65°C back to 37°C, will catalytic activity return? Contrast this with cooling from 10°C back to 37°C.
2 Substrate Concentration & Kinetic Plateau
[Graph B: Catalase Breakdown of H₂O₂]
0 20 40 60 80 Substrate Concentration [S] (mM) Rate (μmol/min) V_max (Saturation Plateau) Point X Point Y
Point X: Linear rate zone Point Y: Saturation plateau
a) The Initial Linear Phase (Point X):
Why does increasing [S] from 0 to 20 mM produce a steep, nearly linear increase in velocity? What is the limiting factor here?
b) The Plateau Mechanism (Point Y / V_max):
Explain why adding substrate past 60 mM fails to increase the reaction velocity. What physical state describes all enzyme active sites?
c) Overcoming the Plateau:
Propose an experimental modification that would double V_max beyond this plateau without altering temperature or pH.
Enzyme Kinetics Lab • Unit 3: Cellular Energetics Page 1 of 2 → Continue to Page 2
Section 2
pH Profiles & Comparative Multi-Variable Analysis
Student Name:
3 pH Profiles & Chemical Conformation
[Graph C: Pepsin vs. Trypsin]
0 2 4 6 8 10 12 Environmental pH Relative Activity (%) Pepsin (Opt ~2) Trypsin (Opt ~8)
• Pepsin: Gastric • Trypsin: Duodenum
a) Comparative Environmental Niches:
Identify the optimal pH for Pepsin and Trypsin. How do these optimums reflect the human organs where each operates?
b) Molecular Mechanism of pH Denaturation:
Explain how extreme pH changes alter the charge on amino acid R-groups, causing disruption of ionic bonds and active site shape.
c) Physiological Passage Scenario:
When acidic gastric juice enters the small intestine (pH neutralized to ~8), what happens to Pepsin's catalytic function? Why?
4 Cross-Variable Synthesis: Thermophile vs. Human & Enzyme Titration
Experimental Matrix
Biotech researchers are comparing human polymerase with Thermus aquaticus (Taq) polymerase (Graph D1), while also evaluating how doubling enzyme concentration alters saturation kinetics (Graph D2).
Graph D1: Temperature vs. Polymerase Activity
Temp (°C) [0 → 100] Rate Human (37°C) Taq (75°C)
Graph D2: Substrate Kinetics (1X vs. 2X Enzyme)
Substrate [S] (mM) Rate 2X [Enzyme] (V_max = 200) 1X [Enzyme] (V_max = 100)
a) Molecular Adaptation in Thermophiles (Graph D1):
Human polymerase denatures at 55°C, but Taq functions at 75°C. Propose one structural difference in Taq's protein bonding that confers thermal stability.
b) Enzyme Titration Effect on V_max (Graph D2):
When enzyme concentration is doubled from 1X to 2X, why does V_max double while the overall saturation profile shape is preserved?
c) Multi-Factor Challenge Scenario:
A student runs an assay with 2X human polymerase at 75°C with saturated substrate. Predict the resulting reaction rate (zero, intermediate, or max) and justify.
Enzyme Kinetics Lab • Unit 3: Cellular Energetics Page 2 of 2 • End of Worksheet
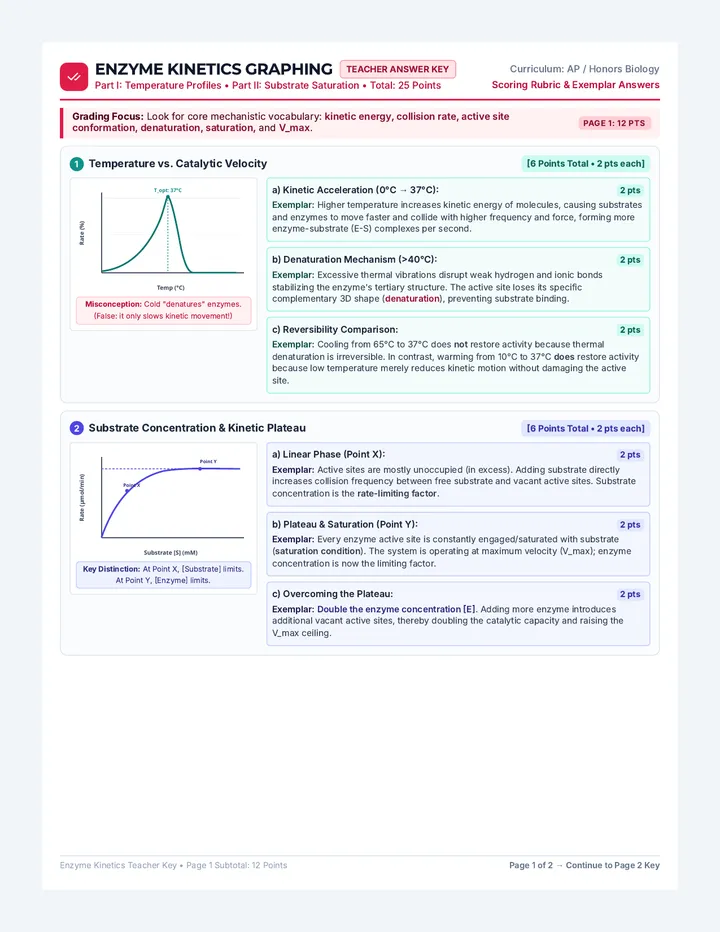
Enzyme Curves Answer Key
Enzyme Kinetics Graphing
Teacher Answer Key
Part I: Temperature Profiles • Part II: Substrate Saturation • Total: 25 Points
Curriculum: AP / Honors Biology
Scoring Rubric & Exemplar Answers
Grading Focus: Look for core mechanistic vocabulary: kinetic energy, collision rate, active site conformation, denaturation, saturation, and V_max.
Page 1: 12 Pts
1 Temperature vs. Catalytic Velocity
[6 Points Total • 2 pts each]
Temp (°C) Rate (%) T_opt: 37°C
Misconception: Cold "denatures" enzymes. (False: it only slows kinetic movement!)
a) Kinetic Acceleration (0°C → 37°C): 2 pts
Exemplar: Higher temperature increases kinetic energy of molecules, causing substrates and enzymes to move faster and collide with higher frequency and force, forming more enzyme-substrate (E-S) complexes per second.
b) Denaturation Mechanism (>40°C): 2 pts
Exemplar: Excessive thermal vibrations disrupt weak hydrogen and ionic bonds stabilizing the enzyme's tertiary structure. The active site loses its specific complementary 3D shape (denaturation), preventing substrate binding.
c) Reversibility Comparison: 2 pts
Exemplar: Cooling from 65°C to 37°C does not restore activity because thermal denaturation is irreversible. In contrast, warming from 10°C to 37°C does restore activity because low temperature merely reduces kinetic motion without damaging the active site.
2 Substrate Concentration & Kinetic Plateau
[6 Points Total • 2 pts each]
Substrate [S] (mM) Rate (μmol/min) Point X Point Y
Key Distinction: At Point X, [Substrate] limits. At Point Y, [Enzyme] limits.
a) Linear Phase (Point X): 2 pts
Exemplar: Active sites are mostly unoccupied (in excess). Adding substrate directly increases collision frequency between free substrate and vacant active sites. Substrate concentration is the rate-limiting factor.
b) Plateau & Saturation (Point Y): 2 pts
Exemplar: Every enzyme active site is constantly engaged/saturated with substrate (saturation condition). The system is operating at maximum velocity (V_max); enzyme concentration is now the limiting factor.
c) Overcoming the Plateau: 2 pts
Exemplar: Double the enzyme concentration [E]. Adding more enzyme introduces additional vacant active sites, thereby doubling the catalytic capacity and raising the V_max ceiling.
Enzyme Kinetics Teacher Key • Page 1 Subtotal: 12 Points Page 1 of 2 → Continue to Page 2 Key
Teacher Key Section 2
pH Profiles & Comparative Multi-Variable Analysis
Page 2: 13 Pts