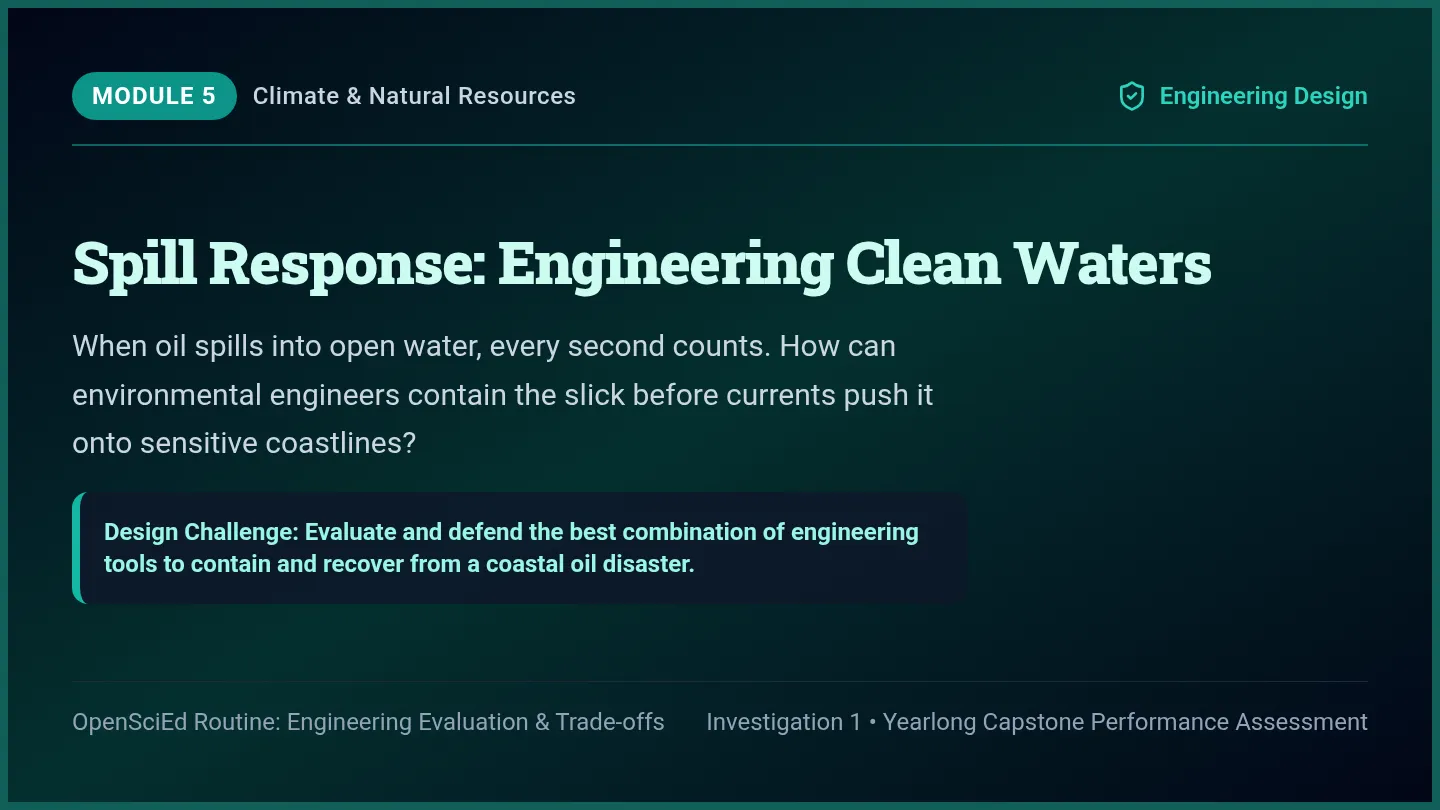
Investigation Questions: How does oil behave when it enters ocean waters? How do wind, waves, and shorelines interact with the spill?
Part 1: Silent Observation (Notice & Wonder)
What did you NOTICE in the images? (Direct Facts)
What do you WONDER? (Testable Science Questions)
Part 2: Initial Scientific Model (Land-Water Spill Interaction)
Draw a diagram showing how crude oil spilled out at sea reaches coastal land. Label: ocean water, floating oil slick, wind/current arrows, and shoreline/beach.
Part 3: Driving Question Board Sticky Note
Write 1 big question about natural resources, ocean water, or climate that you want our class to investigate this year:
Unit Essential Question: How do land and water interact? Investigation 1 Routine: Anchoring Phenomenon
Bars: Tiny, near-invisible blue bars (less than 1 inch/month).
Arid Hot Desert
Alaska / West
Fairbanks, Alaska
Line: Plunges far below zero (-10°F in January), peaking at 62°F in July.
Bars: Low snow/rain throughout year.
Subarctic Tundra
Social Studies Connection: Every region's climate shapes its agriculture, clothing, and natural resources!
Connecting Climate to Natural Resources
Investigation Routine
What We Discovered
• Climographs combine 30 years of temperature and rain data.
• Alaska's subarctic cold preserves spilled oil for decades because bacterial decay slows down in freezing water!
• Climate determines what plants, animals, and resources can exist.
Navigation to Module 3
Why was the Exxon Valdez carrying oil out of Alaska, and why was Deepwater Horizon drilling in the Gulf? Where do Earth's energy resources come from?
Coming Next in Module 3: Energy Harvest: Renewable vs. Nonrenewable Resources!
Get Ready, Do, Done: Climograph analysis sheet ready Notebook Check: Record the difference between weather and climate
Core Concept: Weather changes daily; climate is the 30-year seasonal pattern shown on a climograph.
Part 1: Weather or Climate? (Circle the correct answer)
1. "It is thunderstorming right now outside our school." [ Weather / Climate ]
2. "The desert southwest gets less than 8 inches of rain every year." [ Weather / Climate ]
3. "Florida has warm, humid summers and mild winters." [ Weather / Climate ]
Part 2: Climograph Reading Guide
Precipitation Bars (Left Axis)
Look at the blue vertical bars. Which month has the HIGHEST rainfall in your assigned city?
Temperature Line (Right Axis)
Look at the red curved line. What is the approximate temperature in July vs. January?
Part 3: Regional Comparison Challenge
Compare the climograph of Fairbanks, Alaska with Miami, Florida:
Fairbanks, Alaska (Subarctic)
Miami, Florida (Subtropical)
Part 4: Science Synthesis (Climate & Oil Spills)
In cold climates like Alaska, ocean water is often near freezing (32°F). In the Gulf of Mexico, water is 80°F. How might cold climate make an oil spill harder for nature to break down?
Key Skill: Left axis = Rain bars • Right axis = Temp line Investigation 1 • Regional Climatology
Risk: Hurricane damage & well blowout
West / Alaska
Pipelines & Ports
800-mile Trans-Alaska Pipeline pumps oil across frozen tundra to supertanker ports.
Risk: Tanker collision & ice hazards
Midwest Plains
Wind Corridors
Massive open winds across flat grasslands power giant turbine farms generating electricity.
Benefit: Zero water contamination
Southwest Desert
Solar Fields
300+ cloudless sunny days per year make vast desert solar arrays highly productive.
Benefit: Clean unlimited power
Social Studies Connection: A region's climate directly dictates its best renewable energy options!
Trade-offs & Navigation
Investigation Routine
The Energy Dilemma
Modern society relies heavily on nonrenewable petroleum for plastics, medicines, shipping, and heating. But transporting oil across oceans creates constant hazards.
What happens when natural extreme weather—like a Gulf hurricane or Arctic blizzard—hits an oil drilling rig or coastal refinery?
Navigation to Module 4
Different US regions face different natural hazards based on their climate. How can we track and map extreme events to protect humans and energy systems?
Coming Next in Module 4: Storm Trackers: Mapping Extreme Natural Hazards Region by Region!
Get Ready, Do, Done: Natural Resource Sort complete Notebook Check: Define renewable and nonrenewable with 1 example each
Student Investigation Sheet Module 3 • Energy Resources
Energy Harvest: Renewable vs. Nonrenewable
Name: ______________________ Date: ____________
Core Question: How do renewable and nonrenewable resources differ in how they form and how they affect Earth?
Part 1: Natural Resource Classification Sort
Energy Resource
Renewable or Nonrenewable?
Where on Earth does it come from?
One Environmental Impact
Solar Energy
Sunlight captured by panels
Clean; requires open land
Crude Oil (Petroleum)
Drilled from ancient rock layers
Spill hazards & emissions
Wind Energy
Moving air currents / turbines
Clean; requires steady wind
Coal
Mined from ancient swamp strata
Habitat loss & smoke pollution
Part 2: How Crude Oil Formed Over 300 Million Years
In your own words, summarize why crude oil is considered nonrenewable:
Part 3: Regional Geography & Energy Infrastructure
Explain why major offshore oil platforms are built in the warm waters of the Gulf of Mexico, while vast solar fields are built in the desert Southwest:
Part 4: Exit Reflection (Oil Spill Dilemma)
Why do oil spills happen even though oil companies spend millions on safety equipment?
Key Rule: Renewable replenishes quickly • Nonrenewable takes millions of years Standards: NGSS 4-ESS3-1
Offshore Spill Threat
Scenario B
River Flood vs. Pipeline
Record spring snowmelt and torrential rains wash away riverbeds, exposing and cracking buried oil pipelines.
Freshwater Contamination
Scenario C
Arctic Blizzard vs. Tanker
Sub-zero gales and thick sea ice blind ship navigators, forcing supertankers into shallow reefs (Exxon Valdez).
Coastal Catastrophe
Essential Question Answered: Natural processes and human energy infrastructure constantly collide!
Navigation to Engineering Solutions
Investigation Routine
What We Have Synthesized
• Extreme hazards occur in distinct regional climate zones.
• Storms and human error can trigger catastrophic oil spills.
• When crude oil hits water and coastlines, immediate action is required.
The Ultimate Challenge
How can engineers and scientists stop an active oil spill from destroying beaches and killing marine life? What tools work best?
Coming Next in Module 5: Spill Response: Engineering Containment & Cleanup Solutions!
Get Ready, Do, Done: Regional Hazard Map worksheet ready Notebook Check: Record the primary hazard for your home state
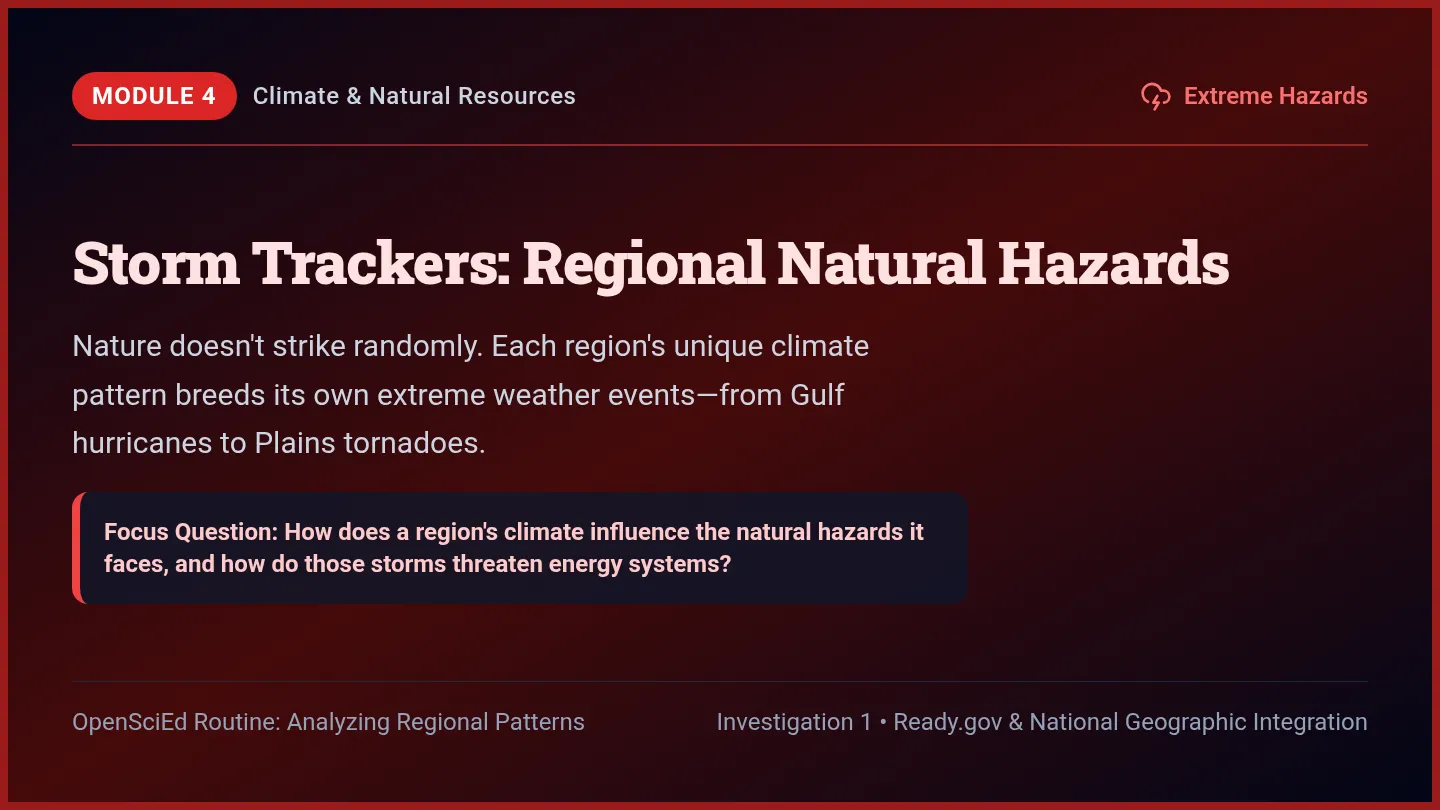
Core Question: How does regional climate determine what severe storms occur, and how do those storms threaten human energy systems?
Part 1: Regional Hazard Match
US Region
Primary Natural Hazard
Climate Condition Causing It
Threatened Energy Asset
Southeast / Gulf Coast
Hurricanes & Storm Surge
Warm ocean water over 80°F
Offshore oil platforms
Midwest / Plains
Tornadoes & Blizzards
Colliding warm & cold air masses
Power transmission lines
Southwest Desert
Drought & Heatwaves
Low rainfall and high heat
Hydroelectric reservoir dams
Part 2: What's Happening in Our State? (Ready.gov Exploration)
Top Hazard in Our State / Region:
One Community Preparedness Action:
Part 3: Hazard Collision Scenario
A Category 4 hurricane is heading directly toward offshore drilling rigs in the Gulf of Mexico. Explain two ways the hurricane's wind and storm surge could cause an oil spill into ocean waters:
Part 4: Exit Question
Why can't weather forecasters stop natural hazards from happening? What CAN humans do instead?
Key Finding: Regional climate determines hazard frequency and severity. Standards: NGSS 4-ESS3-2 & 3-ESS3-1
Does the tool fail in 6-foot waves, freezing subarctic cold, or high winds?
3
Wildlife Safety
Does the cleanup method accidentally harm fish eggs, coral reefs, or coastal birds?
4
Financial Cost
Is the technology feasible for regional coast guards and municipal teams?
UDL Strategy: Score each solution from 1 (Weak) to 3 (Strong) on your student evaluation rubric.
Unit Synthesis: Our Big Discoveries
Investigation 1 Complete
How Land, Water & Life Connect
Climate shapes regional temperature, rainfall, and extreme natural storms.
Natural resources power human society, but nonrenewable fossil fuels carry severe ecological risks.
Land and water systems interact constantly—spilled ocean pollutants migrate to coastal habitats.
Final Engineering Mission
Write your formal Spill Response Plan. Choose your primary cleanup tools, justify your selection with evidence, and defend your trade-offs!
Incident Brief: An oil tanker has run aground 5 miles offshore near a coastal wildlife refuge and sandy public beaches. High winds and ocean currents are pushing the oil toward shore. Evaluate your options and recommend a response plan.
Part 1: Cleanup Technology Decision Matrix
Technology
How It Works
Major Benefit
Limitation / Trade-off
1. Containment Booms
Floating barrier coralling surface oil
Stops oil from reaching shore
Fails in high waves or storm winds
2. Skimmer Vessels
Pumps floating oil into storage tanks
Removes large volume of oil
Very expensive; needs calm water
3. Sorbents (Sponges)
Absorbs oil while repelling water
Works in shallow water & rocks
Requires manual labor; oily waste
4. Bioremediation
Oil-eating bacteria break down oil
Natural; cleans deep sediments
Takes months or years to work
Part 2: Your Emergency Response Recommendation
Which tools should the Coast Guard deploy first, and why? State your claim and provide two pieces of evidence from the matrix:
Part 3: Managing Limitations
If weather suddenly turns stormy with 6-foot ocean waves, how will your response team adjust?
Part 4: Essential Question Capstone
Answer the unit essential question: How do land and water interact? (Use evidence from oil spills, weather, or natural resources):