Kinetic Coaster Slides Grade 1 STEM Explorer
35-Minute Fast Lab
Hands-On Marble Coaster
Ramp, Roll, and CLACK!
How does a tall hill make a marble zoom and push a cup?
1. Go High
Stored Energy
2. Zoom Down
Motion Energy
3. Push Cup!
Loud Sound
Our STEM Clock
Today's 35-Minute Adventure
Fast 35 Min
1
5 Min
The Spark
Listen to the marble clack sound!
Listen
2
7 Min
The Secret
High hill vs. low hill power.
Learn
3
15 Min
Build & Roll
Test 3 hills and slide your cup!
Hands-On
4
8 Min
Cup Rally
Color your cubes and celebrate!
Share
First Grade STEM Motto: We try, we test, we learn! Team Power!
Big Science Word
What is Energy?
Energy is the power to MOVE and make things change!
Without energy, everything stays still!
Running Fast
Energy in your legs!
Warm Sunshine
Energy heats Earth!
School Bell
Sound energy rings!
Energy Detectives
Use Your 3 Senses Today!
Detective Mode
1. SEE IT!
Watch the marble roll down the track fast!
Motion Energy
2. HEAR IT!
Listen for the loud CLACK when the marble hits!
Sound Energy
3. FEEL IT!
Rub your hands fast right now! Do you feel warm heat?
Heat / Friction
Check all 3 on Page 1 of your Lab Sheet!
The Secret
Tall Hill = Big Energy!
TALL HILL
Lots of Stored Energy
High up in the air, the marble is packed with energy waiting to go!
Result: Zooms FAST + Pushes Cup FAR!
LOW HILL
Little Stored Energy
Close to the floor, the marble only has a tiny bit of stored energy.
Result: Rolls slow + Cup barely budges!
Rule: Higher Start = Bigger Push!
STEM Lab Rules
3 Simple Rules for Builders
Be an Engineer
1
Build a Slope
Tape your track to a chair or book stack. Make it smooth!
High start → Floor
2
NO PUSHING!
Just open your fingers and LET GO. Gravity does the work!
Zero hand pushes!
3
Push the Cup!
Aim the bottom of your ramp right into the open paper cup mouth!
Color in your cubes!
Your Kit: 1 Track • 1 Marble • 1 Paper Cup • Blue Tape
Active STEM Time
15-Minute Build & Roll!
Testing Time
What to Do:
1 Trial 1: 1 book tall • Color cubes
2 Trial 2: 3 books tall • Color cubes
3 Trial 3: Chair tall • Color cubes!
Partner A holds track • Partner B rolls marble!
Need Help?
Marble fell off? Press the paper sides up to make higher walls.Cup didn't slide? Make the hill steeper for more energy!
Listen for the loudest CLACK!
Color in your cubes on Page 2! 1, 2, 3, 4, or 5 cubes!
Mission Complete
The Energy Secret Solved!
STEM Stars
What Did We Learn Today?
Higher Hill
Means more stored energy!
Faster Zoom
Transforms to motion energy!
Far Cup Slide
Energy passes into the cup!
Clean-Up Challenge: Marbles in the bag • Tape in the trash! 60 Seconds Go!
Energy Pacing Teacher Guide Energy Pacing Teacher Guide
Kinetic Coaster Challenge • 35-Minute First Grade STEM Lab
First Grade Focused
1st Grade Essential Question
How does making our ramp taller make the marble zoom faster and push the cup farther across the floor?
Standards Focus
NGSS: 1-PS4-1 (Vibrations & Sound), K-2-ETS1-1 & K-2-ETS1-2 (Engineering Design).
1st Grade Lab Kit (Pairs of 2)
Pre-Bagged in Gallon Ziploc
1 Marble in Tape Donut
1 Pre-creased Cardstock Track
1 3oz Paper Target Cup
5 Snap Cubes (Measuring)
*Provide 3 pre-cut tape tabs stuck to table edge. Chairs or book stacks provide ramp height.
35-Minute Fast Pacing Schedule for Grade 1
Time Phase Teacher Actions & Student Routine 1st Grade Check 00 – 05m 1. The Spark Drop marble from knee vs eye height onto desk: "Listen to the CLACK! Which one was louder?" Chant call-and-response: Teacher: "Energy is..." Kids: "The power to move!" All hands rub together to feel friction heat. 05 – 12m 2. The Secret Show Slides 3–6. Teach the #1 Golden Rule: NO PUSHING! Just let it go! Model placing the marble at the top and opening fingers. Check off 3 senses on Lab Sheet. Practice "hands-off release" gesture. 12 – 27m 3. Build & Roll Pass out pre-bagged kits. Pairs test 3 heights: 1 Book (low), 3 Books (med), Chair Top (tall). Students snap/count cubes to see how far the cup slides and color their cubes. Cubes colored on 3 trials on Lab Sheet. 27 – 32m 4. Rally Share Signal "Hands on your head!" Have 2 pairs demonstrate their loudest, farthest roll. Guide students to circle FAST and FAR on Page 2. Oral share: "Tall hill = far push!" 32 – 35m 5. Speed Reset 60-second cleanup song: Marbles into bag, cup in bag, track flat. Students complete the exit check star question at the bottom. All marbles secured in tape donuts.
Kinetic Coaster Challenge • Teacher Instructional Guide Page 1 of 2
First Grade Facilitation & Multi-Tier Extensions
Behavior Management • Scripted Prompts • Grades 2–4 Bridge Notes
Kinetic Coaster Lab Sheet Kinetic Coaster Lab
Grade 1 STEM Explorer • Energy in Action!
Grade 1 STEM
My Name:
My STEM Partner:
1 Energy Detective: What will you sense today?
Put a ✓ in each box!
I SEE IT!
Fast Motion Rolling
I HEAR IT!
Loud Cup Clack!
I FEEL IT!
Warm Rubbing Heat
2 Draw Your Ramp & Target Cup!
High Hill → Target Cup
Draw your tall starting hill on the left and the paper cup on the right. Circle your marble ready at the top!
↑ Start: Tall Hill (Stored Energy) Target Cup • Slide Finish →
Kinetic Coaster Challenge • Grade 1 Lab Sheet Page 1 of 2
Ramp Test & Cup Push!
Roll 3 Times • No Pushing • Color In the Cubes
Test Zone
3 Test 3 Heights: How Many Cubes Did the Cup Slide?
1 Low Hill (1 Book Tall)
Color the cubes the cup moved:
Distance:
Sound: Quiet Tap
2 Medium Hill (3 Books Tall)
Color the cubes the cup moved:
Distance:
Sound: Medium Clack
3 Super Tall Hill (Chair Top!)
Color the cubes the cup moved:
Distance:
Sound: LOUD CLACK!
4 Circle the Science Truth!
1. A TALL hill made the marble roll:
FAST SLOW
2. A fast marble made the cup slide:
FAR NOT FAR
5 STEM Star Check: Which hill gives the MOST motion energy?
Flat Line
(On the carpet)
Tall Mountain Hill
(High in air)
Baby Bump
(1 inch off floor)
Kinetic Coaster Challenge • Grade 1 Lab Sheet Page 2 of 2
Energy Transfer Master Key Grade 1 Energy Master Key
Kinetic Coaster Lab • Teacher Solutions & First Grade Scoring
Teacher Guide
1 Part 1: Senses
All 3 boxes checked:
• I SEE IT (Motion)
• I HEAR IT (Sound Clack)
• I FEEL IT (Friction Heat)
4 Part 4: Circles
1. Tall hill roll =
2. Fast marble =
5 Part 5: Star Exit
Correct: Tall Mountain Hill
Tallest hill gives the marble the most stored energy to push the cup.
2 Part 2: 1st Grade Blueprint Look-Fors
Visual Check
Left: High Start Hill
Student draws a ramp starting up high (against a chair or books) with marble at the peak.
Middle: Downward Slope
Shows a downward angle leading toward the floor. Avoids flat loop traps.
Right: Target Cup
Cup is drawn at the bottom exit ready to catch or get pushed across the floor.
3 Part 3: Expected Cube Coloring Ranges
Trial Height Cubes Colored by Student Observed Sound & Action Trial 1 (Low Hill) 1 to 2 cubes colored (■ ■ □ □ □) Quiet tap; cup budges only 1–2 inches. Trial 2 (Medium Hill) 2 to 3 cubes colored (■ ■ ■ □ □) Medium clack; cup slides noticeably. Trial 3 (Tall Hill) 4 to 5 cubes colored (■ ■ ■ ■ ■) Loud CLACK! Cup zooms across floor tiles.
1st Grade On-the-Fly Oral Check: "Why did your marble push the cup so far on Trial 3?" Student response to look for: "Because it was way up high on the chair, so it rolled super fast!"
Kinetic Coaster Challenge • Grade 1 Master Key Page 1 of 2
Grade 1 STEM Challenge Rubric
Developmentally Tailored for Age 6–7 • Fast Pacing • Safety
Grade 1 Standards
Primary STEM Performance Rubric
Skill 3: STEM Star 2: Building Skill 1: Needs Help Ramp Building & Rule Builds sloping track and releases marble with zero push all 3 times. Builds working slope; occasionally needs reminder not to push marble. Holds ramp flat or throws marble at cup rather than letting it roll. Energy Concept
Ramp Racer Slides Grade 2 STEM Lab
35-Minute Fast Track
Surface Energy & Motion
Ramp Racer Rally
Why does smooth plastic let cars zoom, while rough sandpaper slows them down?
Motion Energy
Wheels spinning fast
Friction Force
Surface rubbing brake
Distance Test
Count floor tiles
Race Schedule
Our 35-Minute Fast Track
35 Min Total
1
5 Min
The Spark
Car drop test & surface rubbing warm-up.
Warm-Up
2
7 Min
Friction Fact
How rough bumps steal motion energy.
Core Concept
3
15 Min
Build & Race
Test Smooth vs Rough tracks and count tiles!
Hands-On STEM
4
8 Min
Data Rally
Compare class distances & clean up.
Share & Reset
Grade 2 STEM Rule: Keep ramp heights the same to make it a fair test! Fair Test!
Science Mystery
What Slows Down a Racer?
Smooth Track
Low Friction
Plastic, cardboard, or tile floors have microscopic smooth paths. Wheels glide easily with almost zero rubbing!
Result: High Speed + Far Coasting
Rough Track
High Friction
Sandpaper, carpet, or felt have tiny bumps. These bumps catch against tires and transform motion energy into heat!
Result: Fast Stop + Short Distance
Friction is a rubbing force that grabs moving energy!
STEM Challenge
The Dual-Surface Drag Strip
15-Minute Build
1
Build Equal Hills
Prop both ramps to exactly 2 books tall. Fair testing means same height!
Fair Height = 2 Books
2
Apply Sandpaper
Tape rough sandpaper onto Lane B. Leave Lane A as smooth cardboard.
Smooth vs Rough
3
Count Floor Tiles
Release car (no pushing!). Count how many square floor tiles it coasts.
Log on Lab Sheet!
Kit: 2 Ramp Strips • 1 Toy Car • 1 Sandpaper Strip • Tape Zero Pushing!
Race Rally Debrief
Where Did the Energy Go?
Final 8 Min
Ramp Racer Lab Sheet Ramp Racer Lab Sheet
Grade 2 STEM Challenge • Surface Friction & Motion Energy
Grade 2 Lab
Lead Driver:
Pit Crew Partner:
Class / Room:
1 Grade 2 Science Prediction (Hypothesis)
We will roll the same toy car down two equal ramps. Ramp A is smooth cardboard. Ramp B is rough sandpaper.
I predict: The car on the [circle one: SMOOTH / ROUGH] track will roll the farthest because:
2 Dual-Surface Drag Strip Blueprint
Draw both ramps with equal starting height
Label "LANE A: SMOOTH" and "LANE B: ROUGH SANDPAPER" . Show your book stack support!
Engineering Blueprint Box
Ramp Racer Rally • Grade 2 STEM Lab Page 1 of 2
Racer Data & Friction Investigation
Measure Distance in Floor Tiles • Energy Debrief
Active Race Trials
3 Floor Tile Distance Data Table (No Pushing!)
Count how many whole floor tiles the front wheels coast across before stopping.
Surface Type Trial 1 Tiles Trial 2 Tiles Trial 3 Tiles Winner / Notes Lane A: Smooth Cardboard
|
|
|
| Lane B: Rough Sandpaper |
|
|
|
|
4 Friction Energy Detective Questions
1. Which surface had more friction, and how do you know from your race data?
2. Where did the car's motion energy go when it stopped on the sandpaper?
5 STEM Exit Question
Select the best choice:
If an engineer wants a roller coaster car to stop safely at the end of a ride, what kind of track surface should they install?
A. Wet, icy plastic
B. Rough, textured rubber
C. Polished glass
Ramp Racer Rally • Grade 2 STEM Lab Page 2 of 2
Ramp Racer Master Key Ramp Racer Master Key
Grade 2 STEM Lab • Teacher Solutions & Benchmark Data
Teacher Reference
1 Part 1: Hypothesis Key
Correct Circle: SMOOTH
Exemplar Reason: "Because the smooth cardboard has very little friction, so the wheels can roll freely without bumpy resistance slowing them down."
5 Part 5: Exit Check Key
Correct: B. Rough, textured rubber
High-friction surfaces provide maximum stopping force by converting motion energy into heat quickly and safely.
2 Part 2: Blueprint Inspection Criteria
Visual Check
Equal Heights
Both lanes supported by identical book stacks (fair test standard).
Dual Surface Labels
Lane A clearly marked "Smooth", Lane B marked "Rough Sandpaper".
Floor Coast Area
Shows open floor runway marked with square tile grids.
3 Part 3: Expected Distance Benchmark Data
Track Surface Trial 1 Tiles Trial 2 Tiles Trial 3 Tiles Expected Observation Lane A: Smooth Cardboard 4 – 6 tiles 4 – 6 tiles 5 – 7 tiles Coasts far across floor with smooth wheel spin. Lane B: Rough Sandpaper 1 – 2 tiles 1 – 2 tiles 1 – 2 tiles Rattles and halts almost immediately after ramp exit.
4 Part 4: Exemplar Written Responses
Q1: Which surface had more friction?
"The sandpaper lane had much more friction because our car only traveled 1 floor tile before stopping, while the smooth lane let the car coast 5 tiles."
Q2: Where did the motion energy go?
"The motion energy transformed into thermal energy (friction heat) and rumbling sound vibrations between the tires and sandpaper grit."
Ramp Racer Rally • Grade 2 Master Key Page 1 of 2
Grade 2 STEM Scoring Rubric
Fair Testing • Distance Measurement • Friction Analysis
Assessment Guide
4-Level Evaluation Criteria
Criteria Level 4 (Exceeds) Level 3 (Meets) Level 2 (Developing) Level 1 (Beginning) Fair Test Protocol Maintains exact 2-book height for both lanes; releases with zero push across all trials.
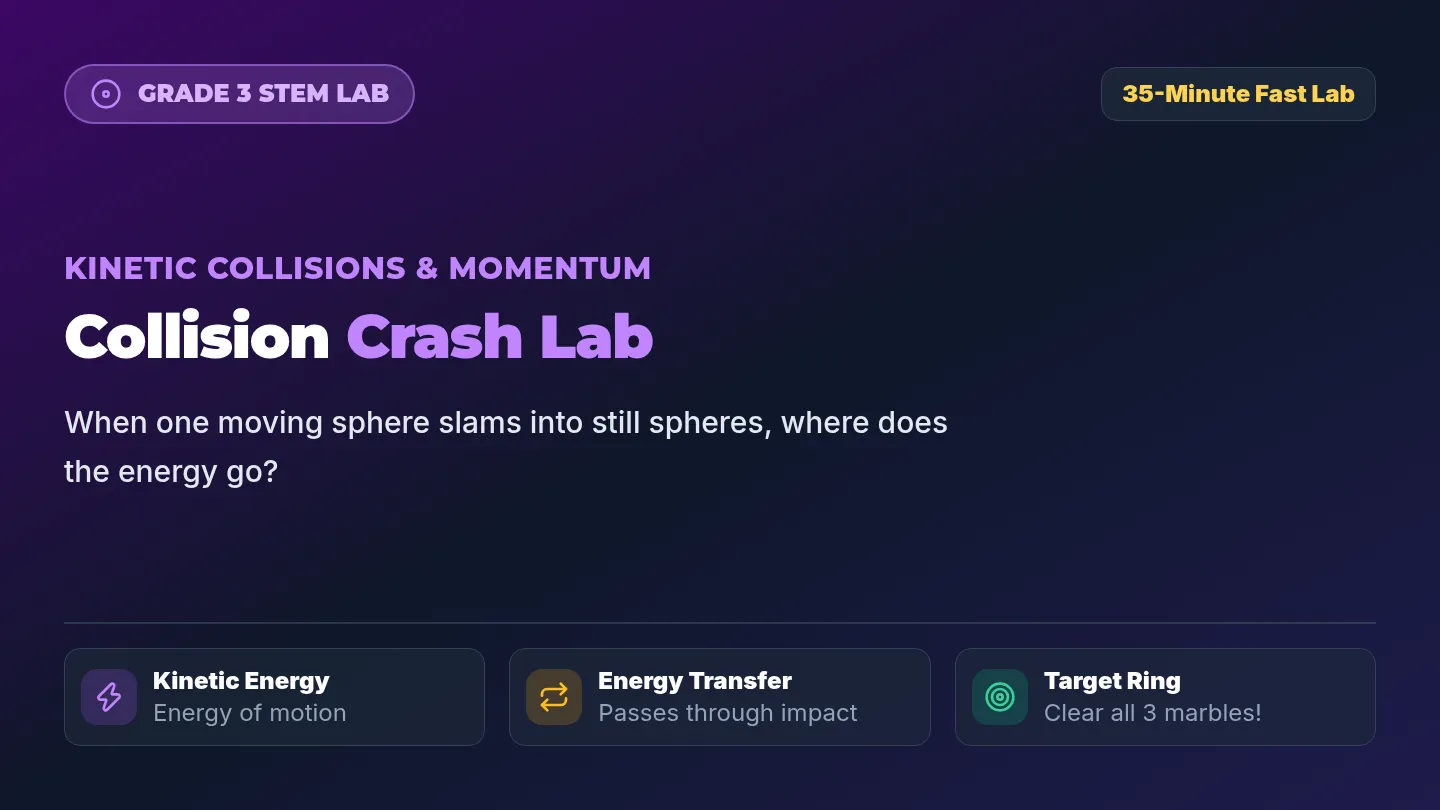
Collision Blaster Slides Grade 3 STEM Lab
35-Minute Fast Lab
Kinetic Collisions & Momentum
Collision Crash Lab
When one moving sphere slams into still spheres, where does the energy go?
Kinetic Energy
Energy of motion
Energy Transfer
Passes through impact
Target Ring
Clear all 3 marbles!
Mission Timeline
35-Minute Collision Sprint
35 Min
1
5 Min
The Spark
Two-marble head-on collision demo.
Watch Impact
2
7 Min
The Science
Kinetic energy transfers like dominoes!
Core Concept
3
15 Min
Build & Blast
Aim ramp & blast marbles out of target ring.
Hands-On STEM
4
8 Min
Data Check
Measure displacement in centimeters.
Share & Reset
Grade 3 Rule: Energy transfers at the exact moment of collision! Transfer Power
Science Core
What Happens During Impact?
Moving Striker
Carries Kinetic Energy
The launcher marble zooms down the track full of kinetic motion energy.
State: High Speed • Moving
Target Spheres
Receives Kinetic Energy
At collision, energy shoots directly into the target marbles, causing them to explode outward!
State: Rest → Violent Launch!
The striker stops or slows down because it gave away its energy!
Engineering Task
The Target Ring Blaster
15-Minute Build
1
Set Target Ring
Tape a 20-centimeter circle on the floor. Place 3 target marbles in center.
20 cm Target Ring
2
Build Aim Ramp
Construct a track 50 cm away from ring. Test Low, Medium, and Steep angles!
Precision Aiming
3
Measure Blast
Measure how many cm the farthest target marble flew outside the ring!
Measure in cm
Toolkit: 4 Marbles • Cardstock Ramp • Tape Ring • Metric Ruler Zero Finger Flicking!
Mission Debrief
Tracing the Collision Energy
Final 8 Min
The Collision Chain
Collision Blaster Lab Sheet Collision Blaster Lab Sheet
Grade 3 STEM Challenge • Kinetic Energy Transfer & Collisions
Grade 3 Lab
Lead Physicist:
Lab Partner:
Date / Section:
1 Scientific Hypothesis: Speed vs. Collision Force
When the launcher marble rolls down from a steep hill (high speed) vs a low hill (low speed), what will happen to the 3 target marbles in the ring?
If we increase the starting height of the striker marble, then the target marbles will scatter:
2 Collision Arena Blueprint
Draw your launch ramp, striker path, and 20 cm target ring
Label: "STRIKER" (rolling ball), "IMPACT POINT" , and "SCATTER ZONE" .
Arena Schematic Box
Collision Crash Lab • Grade 3 STEM Handout Page 1 of 2
Impact Trials & Energy Transfer Data
Precision Metric Measurement • Energy Flow Analysis
Metric Trials
3 3-Height Strike Data Table (Measure in Centimeters)
Release the striker marble from 3 heights. Measure how many cm the farthest target marble traveled from the center.
Ramp Height Marbles Ejected Farthest Marble (cm) Striker Behavior After Hit Trial 1: Low (10 cm)
|
|
| Trial 2: Med (25 cm) |
|
|
|
| Trial 3: Steep (45 cm) |
|
|
|
4 Kinetic Energy Transfer Analysis
1. What happened to the speed of the striker marble the instant it struck the target marbles? Why?
2. Besides motion energy, what other energy form was produced during the collision?
5 STEM Exit Ticket Question
NGSS 3-PS2-1
If you roll a heavier steel ball at the stationary marbles with the same speed, what will happen to the target marbles?
A. They scatter much farther due to more kinetic energy
B. They will not move at all
C. They move backward up the ramp
Collision Crash Lab • Grade 3 STEM Handout Page 2 of 2
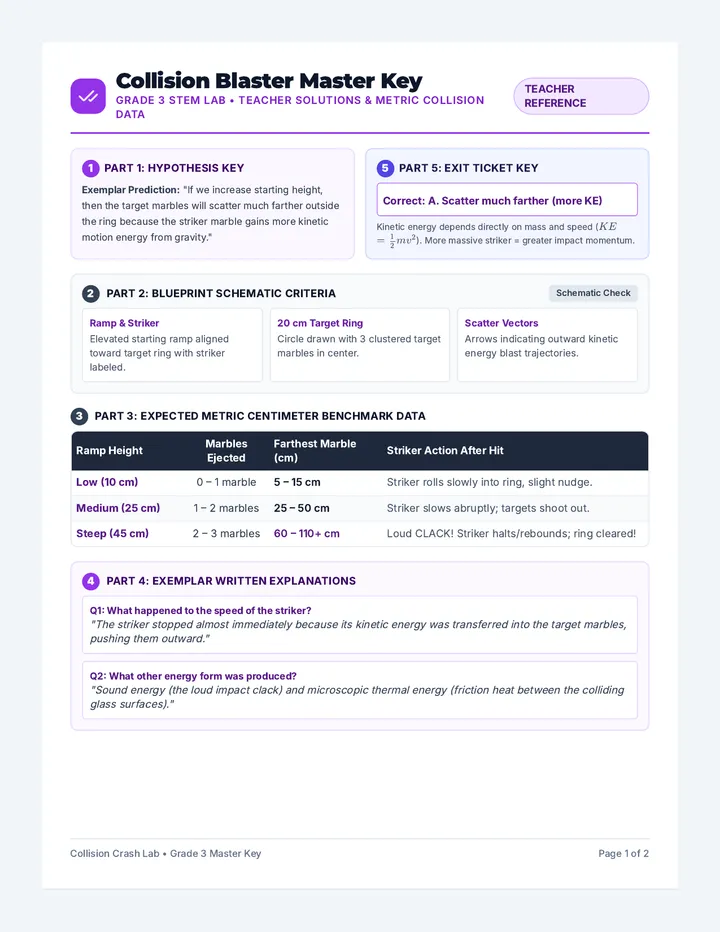
Collision Blaster Master Key Collision Blaster Master Key
Grade 3 STEM Lab • Teacher Solutions & Metric Collision Data
Teacher Reference
1 Part 1: Hypothesis Key
Exemplar Prediction: "If we increase starting height, then the target marbles will scatter much farther outside the ring because the striker marble gains more kinetic motion energy from gravity."
5 Part 5: Exit Ticket Key
Correct: A. Scatter much farther (more KE)
Kinetic energy depends directly on mass and speed (\(KE = \frac{1}{2}mv^2\)). More massive striker = greater impact momentum.
2 Part 2: Blueprint Schematic Criteria
Schematic Check
Ramp & Striker
Elevated starting ramp aligned toward target ring with striker labeled.
20 cm Target Ring
Circle drawn with 3 clustered target marbles in center.
Scatter Vectors
Arrows indicating outward kinetic energy blast trajectories.
3 Part 3: Expected Metric Centimeter Benchmark Data
Ramp Height Marbles Ejected Farthest Marble (cm) Striker Action After Hit Low (10 cm) 0 – 1 marble 5 – 15 cm Striker rolls slowly into ring, slight nudge. Medium (25 cm) 1 – 2 marbles 25 – 50 cm Striker slows abruptly; targets shoot out. Steep (45 cm) 2 – 3 marbles 60 – 110+ cm Loud CLACK! Striker halts/rebounds; ring cleared!
4 Part 4: Exemplar Written Explanations
Q1: What happened to the speed of the striker?
"The striker stopped almost immediately because its kinetic energy was transferred into the target marbles, pushing them outward."
Q2: What other energy form was produced?
"Sound energy (the loud impact clack) and microscopic thermal energy (friction heat between the colliding glass surfaces)."
Collision Crash Lab • Grade 3 Master Key Page 1 of 2
Grade 3 STEM Collision Rubric
Kinetic Transfer • Metric Measurement • Force Analysis
Assessment Guide
4-Level Evaluation Criteria
Criteria Level 4 (Exceeds) Level 3 (Meets) Level 2 (Developing) Level 1 (Beginning)
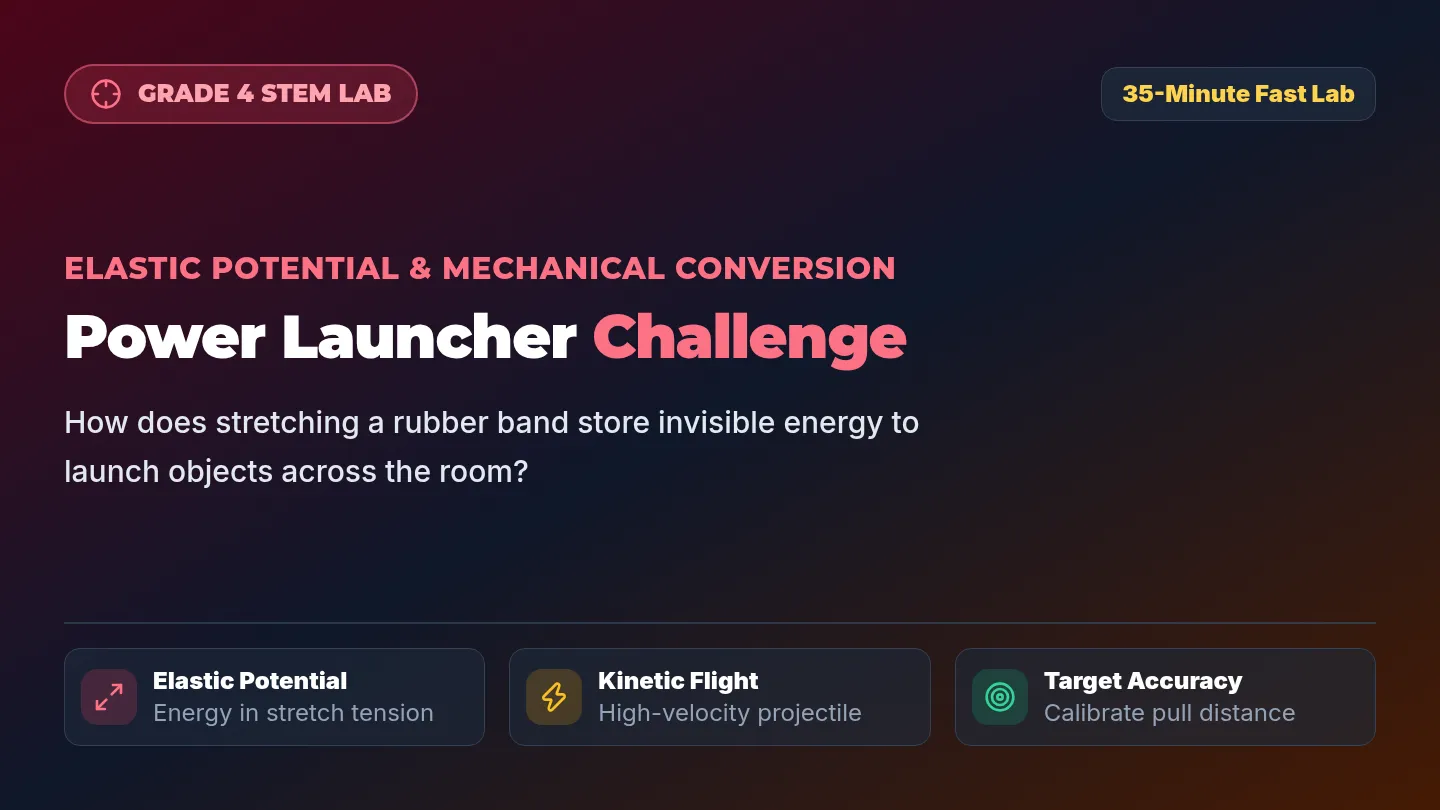
Power Launcher Slides Grade 4 STEM Lab
35-Minute Fast Lab
Elastic Potential & Mechanical Conversion
Power Launcher Challenge
How does stretching a rubber band store invisible energy to launch objects across the room?
Elastic Potential
Energy in stretch tension
Kinetic Flight
High-velocity projectile
Target Accuracy
Calibrate pull distance
Flight Plan
Grade 4 Engineering Sprint
35 Min
1
5 Min
The Spark
Rubber band stretch & snap energy demo.
Tension Test
2
7 Min
The Physics
Elastic potential conversion mechanics.
Energy Math
3
15 Min
Build & Fire
Calibrate 2 cm vs 4 cm pullback distance.
Hands-On STEM
4
8 Min
Target Rally
Graph flight distances in meters.
Analyze & Reset
Grade 4 Engineering Principle: More stretch = More stored energy = Greater speed! Conversion
Energy Transformation
The Elastic Conversion Cycle
Pulled Back
Elastic Potential Energy
When you stretch the band, your muscles do mechanical work that is stored inside the molecular bonds of the rubber.
State: Stored • Ready to Snap
Snap Release
Kinetic Launch Energy
The band snaps back in milliseconds, transferring all stored energy into launching the projectile through the air!
State: High Speed • Flight
Energy is conserved: Elastic Energy converts into Kinetic Flight + Snap Sound!
STEM Challenge
Calibrated Launcher Sprint
15-Minute Build
1
Build Frame
Bundle 6 craft sticks with rubber bands to create a solid lever fulcrum.
Fulcrum Base
2
Attach Arm
Secure plastic spoon launch arm and attach elastic tension bands.
Elastic Lever
3
Calibrate & Fire
Test 2 cm vs 4 cm pullback tension and record flight distances.
Measure Distance
Kit: 7 Craft Sticks • 4 Rubber Bands • 1 Spoon • 1 Soft Projectile Eye Protection On!
Engineering Debrief
Power Launcher Lab Sheet Power Launcher Lab Sheet
Grade 4 STEM Challenge • Elastic Potential Energy & Conversion
Grade 4 Lab
Lead Engineer:
Testing Partner:
Period / Room:
1 Engineering Hypothesis: Elastic Pullback vs. Flight Distance
When a rubber band is pulled back further (2 cm vs 4 cm vs 6 cm), how does that change the stored elastic energy and resulting flight distance?
If we increase the pullback distance of the launch lever, then the flight distance will:
2 Catapult Launcher Engineering Schematic
Draw your fulcrum stick bundle, launch arm, and rubber bands
Label: "FULCRUM" , "ELASTIC TENSION BAND" , and "PROJECTILE BASKET" .
Catapult Blueprint Box
Power Launcher Challenge • Grade 4 STEM Lab Page 1 of 2
Calibration Trials & Energy Conversion
Measure Range in Meters • Energy Conversion Proof
Metric Testing
3 Pullback Calibration Data Table (Record in Meters / Centimeters)
Pull arm back to exact ruler mark, release safely, and measure straight-line flight distance to first landing.
Pullback Distance Trial 1 Distance Trial 2 Distance Trial 3 Distance Average Flight Low: 2 cm Pullback
|
|
|
| Medium: 4 cm Pullback |
|
|
|
|
| High: 6 cm Pullback |
|
|
|
|
4 Energy Conversion Sequence Analysis
1. Trace the complete path of energy: When your finger pulled back the spoon, what kind of energy was stored, and what did it convert into upon release?
2. When the projectile landed on the floor and stopped moving, where did its kinetic energy go?
5 STEM Exit Ticket Question
NGSS 4-PS3-4
An engineer replaces a thin rubber band with a much thicker, tighter elastic band on the catapult. What will happen to the projectile launch?
A. It flies farther because more elastic tension energy is stored
B. It drops immediately because elastic energy disappears
C. It launches backward into the student's hand
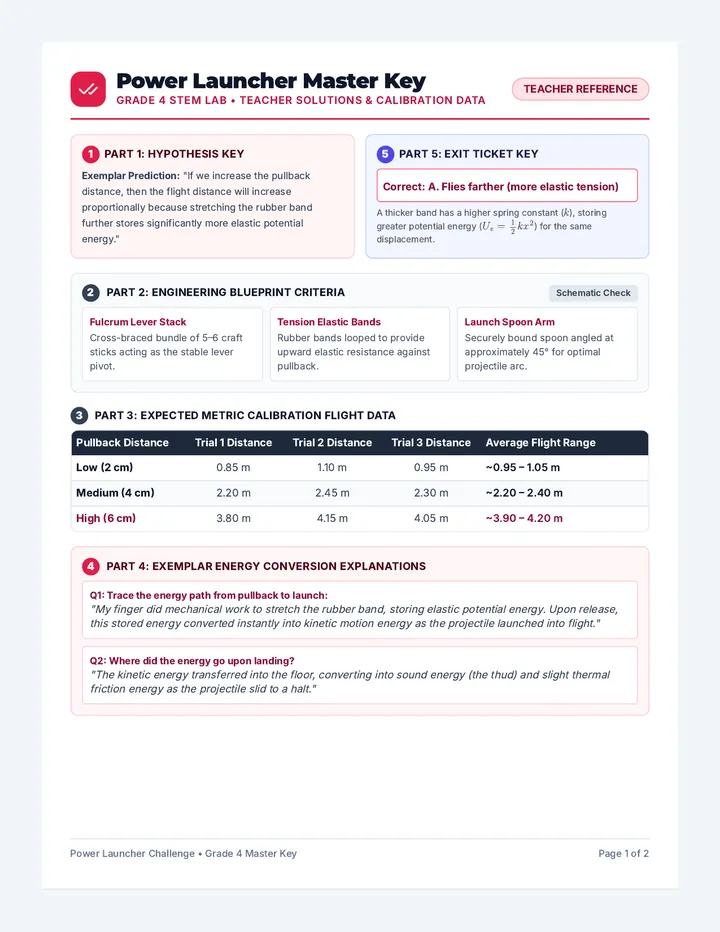
Power Launcher Master Key Power Launcher Master Key
Grade 4 STEM Lab • Teacher Solutions & Calibration Data
Teacher Reference
1 Part 1: Hypothesis Key
Exemplar Prediction: "If we increase the pullback distance, then the flight distance will increase proportionally because stretching the rubber band further stores significantly more elastic potential energy."
5 Part 5: Exit Ticket Key
Correct: A. Flies farther (more elastic tension)
A thicker band has a higher spring constant (\(k\)), storing greater potential energy (\(U_e = \frac{1}{2}kx^2\)) for the same displacement.
2 Part 2: Engineering Blueprint Criteria
Schematic Check
Fulcrum Lever Stack
Cross-braced bundle of 5–6 craft sticks acting as the stable lever pivot.
Tension Elastic Bands
Rubber bands looped to provide upward elastic resistance against pullback.
Launch Spoon Arm
Securely bound spoon angled at approximately 45° for optimal projectile arc.
3 Part 3: Expected Metric Calibration Flight Data
Pullback Distance Trial 1 Distance Trial 2 Distance Trial 3 Distance Average Flight Range Low (2 cm) 0.85 m 1.10 m 0.95 m ~0.95 – 1.05 m Medium (4 cm) 2.20 m 2.45 m 2.30 m ~2.20 – 2.40 m High (6 cm) 3.80 m 4.15 m 4.05 m ~3.90 – 4.20 m
4 Part 4: Exemplar Energy Conversion Explanations
Q1: Trace the energy path from pullback to launch:
"My finger did mechanical work to stretch the rubber band, storing elastic potential energy. Upon release, this stored energy converted instantly into kinetic motion energy as the projectile launched into flight."
Q2: Where did the energy go upon landing?
"The kinetic energy transferred into the floor, converting into sound energy (the thud) and slight thermal friction energy as the projectile slid to a halt."
Power Launcher Challenge • Grade 4 Master Key Page 1 of 2
Grade 4 STEM Catapult Rubric
Elastic Energy • Calibration • Mechanical Conversion
NGSS 4-PS3-4
4-Level Evaluation Criteria
Criteria Level 4 (Exceeds)