Energy Flow Lesson Plan Teacher Lesson Plan • 45 Minutes
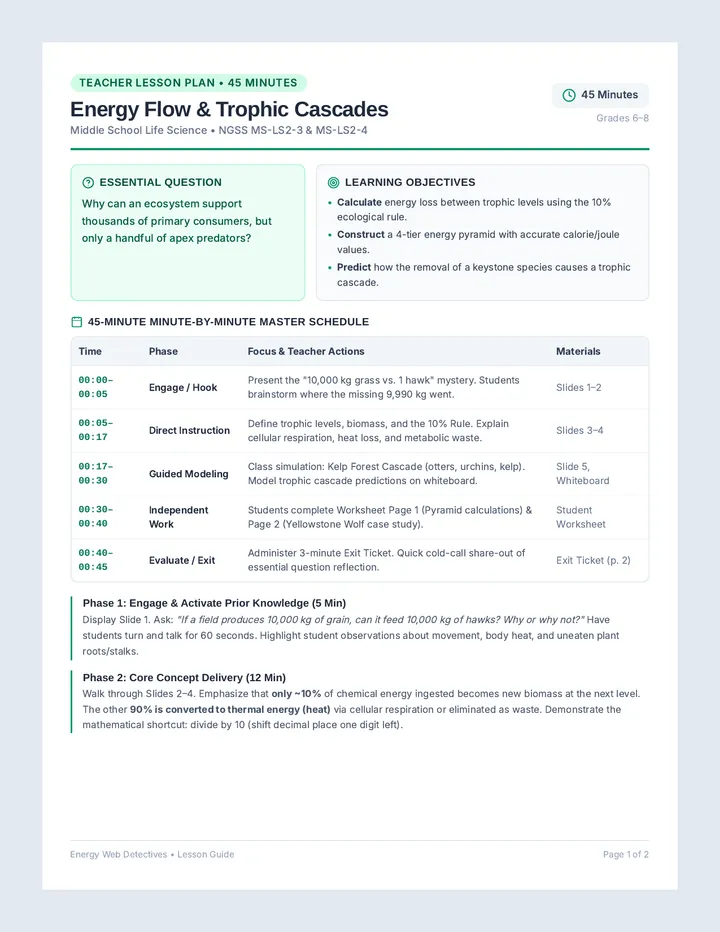
Energy Flow & Trophic Cascades
Middle School Life Science • NGSS MS-LS2-3 & MS-LS2-4
45 Minutes
Grades 6–8
Essential Question
Why can an ecosystem support thousands of primary consumers, but only a handful of apex predators?
Learning Objectives
• Calculate energy loss between trophic levels using the 10% ecological rule.
• Construct a 4-tier energy pyramid with accurate calorie/joule values.
• Predict how the removal of a keystone species causes a trophic cascade.
45-Minute Minute-by-Minute Master Schedule
Time
Phase
Focus & Teacher Actions
Materials
00:00–00:05
Engage / Hook
Present the "10,000 kg grass vs. 1 hawk" mystery. Students brainstorm where the missing 9,990 kg went.
Slides 1–2
00:05–00:17
Direct Instruction
Define trophic levels, biomass, and the 10% Rule. Explain cellular respiration, heat loss, and metabolic waste.
Slides 3–4
00:17–00:30
Guided Modeling
Class simulation: Kelp Forest Cascade (otters, urchins, kelp). Model trophic cascade predictions on whiteboard.
Slide 5, Whiteboard
00:30–00:40
Independent Work
Students complete Worksheet Page 1 (Pyramid calculations) & Page 2 (Yellowstone Wolf case study).
Student Worksheet
00:40–00:45
Evaluate / Exit
Administer 3-minute Exit Ticket. Quick cold-call share-out of essential question reflection.
Exit Ticket (p. 2)
Phase 1: Engage & Activate Prior Knowledge (5 Min)
Display Slide 1. Ask: "If a field produces 10,000 kg of grain, can it feed 10,000 kg of hawks? Why or why not?" Have students turn and talk for 60 seconds. Highlight student observations about movement, body heat, and uneaten plant roots/stalks.
Phase 2: Core Concept Delivery (12 Min)
Walk through Slides 2–4. Emphasize that only ~10% of chemical energy ingested becomes new biomass at the next level. The other 90% is converted to thermal energy (heat) via cellular respiration or eliminated as waste. Demonstrate the mathematical shortcut: divide by 10 (shift decimal place one digit left).
Energy Web Detectives • Lesson Guide Page 1 of 2
Instructional Delivery & Teacher Facilitation
Part 2 of Lesson Plan
Phase 3: Guided Practice — Kelp Forest Cascade (13 Min)
Display Slide 5. Introduce the marine trio: Giant Kelp (Producer) → Purple Sea Urchins (Primary Consumer) → Sea Otters (Secondary/Apex) . Pose scenario: "In the 1800s, sea otters were hunted for fur. Track what happens next." Guide students to trace the chain reaction: Otter decline → Urchin population explodes → Kelp forests overgrazed to 'urchin barrens' → Habitat collapse for 800+ other species. Introduce the term Keystone Species .
Phase 4: Independent Practice & Case Study (10 Min)
Distribute the 2-page student worksheet. Students calculate energy values for a four-level savanna pyramid (\(100,000 \text{ kcal} \rightarrow 10,000 \rightarrow 1,000 \rightarrow 100\)) and analyze the 1995 Yellowstone Wolf reintroduction data. Circulate to check math and ensure students explain why rivers physically changed course after wolves returned.
Phase 5: Closure & Formative Check (5 Min)
Students complete the prompt on their exit ticket: "If a pesticide kills all grasshoppers in a prairie, which will experience a faster population drop: the grass or the hawks? Defend your answer with energy transfer principles."
Anticipated Student Misconceptions
Misconception: "Energy is destroyed"
Students believe the lost 90% disappears. Correction: Energy cannot be destroyed (First Law of Thermodynamics). It is radiated into the environment as metabolic heat.
Misconception: "Apex predators get the most energy"
Students assume apex predators have the most energy because they are strongest. Correction: They receive the least energy per unit of biomass and must hunt continuously.
Targeted Differentiation
ELL / Developing
Provide visual word bank (Producer, Herbivore, Carnivore, Heat). Use base-10 block manipulatives to physically demonstrate dividing by 10.
On-Level
Complete standard trophic calculations and write full 2-3 sentence causal chains predicting secondary effects on non-target species.
Advanced / Extension
Calculate ecological efficiency if an invasive species diverts 25% of primary consumer calories. Model bioaccumulation of toxins (DDT/mercury) across trophic levels.
Energy Web Detectives • Lesson Guide Page 2 of 2
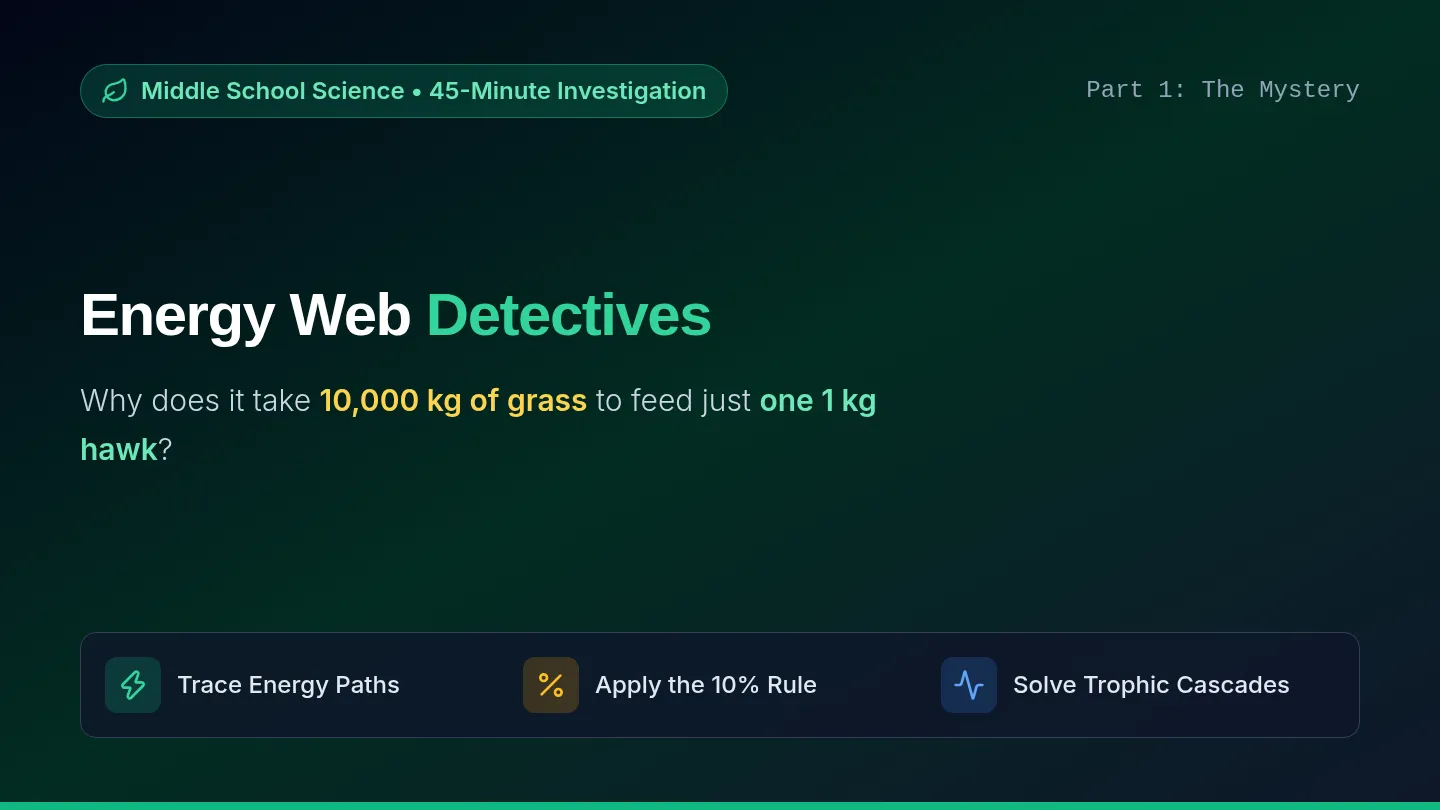
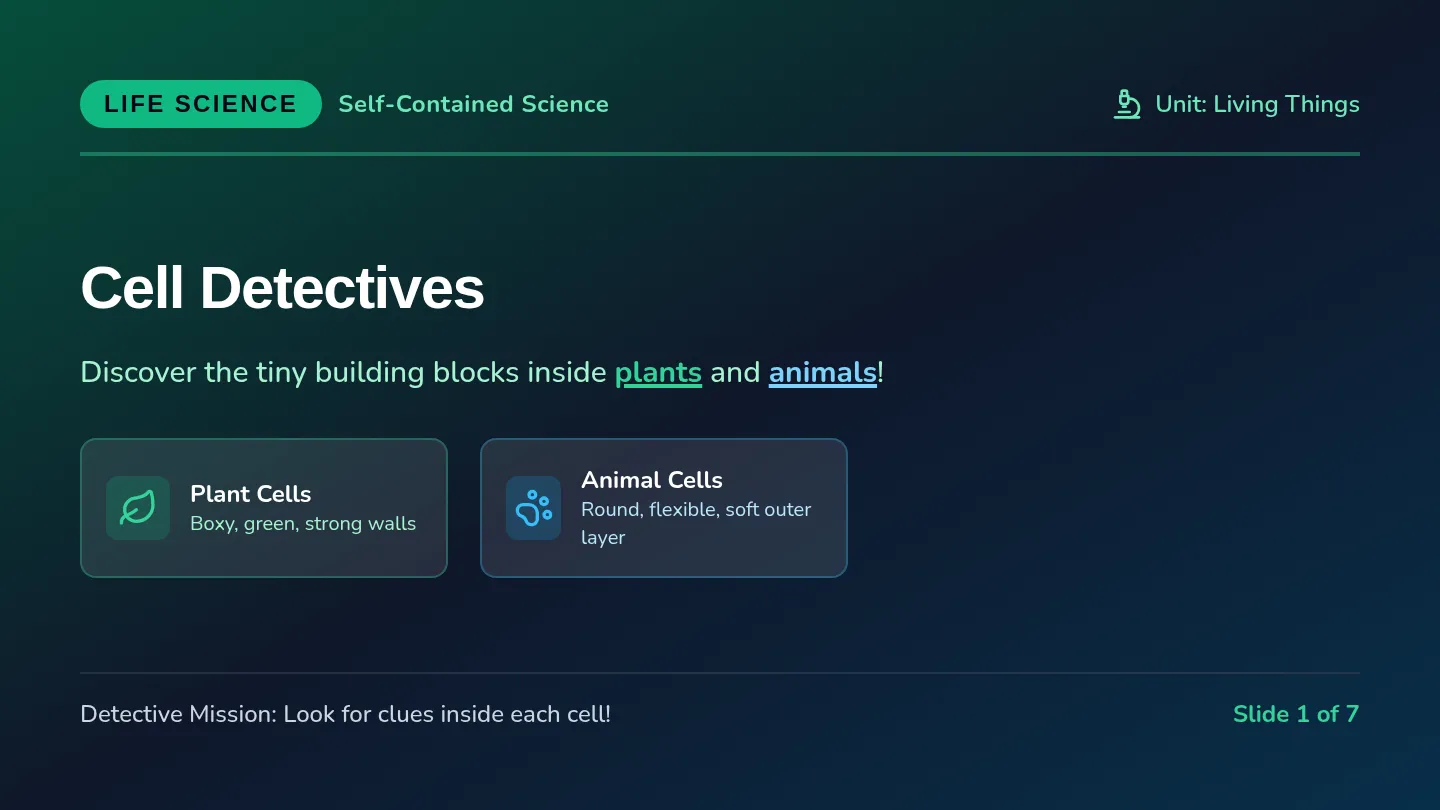
Energy Flow Slides Middle School Science • 45-Minute Investigation
Part 1: The Mystery
Energy Web Detectives
Why does it take 10,000 kg of grass to feed just one 1 kg hawk?
Trace Energy Paths
Apply the 10% Rule
Solve Trophic Cascades
The Trophic Pyramid
Concept 01
Level 4
Apex Predator
Hawks, wolves, orcas. Top of the food chain.
10 Calories
Level 3
Secondary
Frogs, snakes. Carnivores eating herbivores.
100 Calories
Level 2
Primary
Crickets, mice, deer. Herbivores eating plants.
1,000 Calories
Level 1
Producers
Grasses, trees, algae. Capture solar energy.
10,000 Calories
Notice the pattern: With each step upward, energy drops dramatically!
The 10% Ecological Rule
Concept 02
10%
Stored as Biomass
Only about one-tenth of calories eaten are stored in tissues and available to the next predator.
90% Energy Lost Where does it go?
Body Heat: Radiated out into the surrounding air
Metabolism: Running, hunting, breathing, heartbeat
Waste: Uneaten bones, roots, and undigested scat
Quick Mental Math: To calculate 10%, simply move the decimal point one place to the left .
Food Chain vs. Food Web
Concept 03
Linear Model
Food Chain
Shows one single feeding pathway. Simple, but fragile in real ecosystems.
Grass → Grasshopper → Frog → Hawk
Interconnected Model
Food Web
A network of overlapping food chains. Shows realistic predator options and ecosystem stability.
Multiple paths build resilience against disruptions!
Key Rule: Arrows always point in the direction of energy flow (into the mouth that eats it)!
Guided Case Study: Kelp Forest Cascade
Class Challenge
Species 1
Giant Kelp
Underwater towering forest. Provides oxygen and habitat for 800+ species.
Producer
Species 2
Sea Urchins
Voracious herbivores with hard spines. Graze kelp roots (holdfasts) directly.
Primary Consumer
Keystone Species
Sea Otters
Eat urchins constantly to maintain high body heat in freezing Pacific waters.
Apex Controller
If fur hunters remove all sea otters, what happens to the kelp?
Predict Now
Investigation Mission (10 Minutes)
Worksheet Guide
1
Part 1: Savanna Energy Math
Start with 100,000 kcal of acacia leaves. Calculate the exact energy reaching gazelles, cheetahs, and vultures.
2
Part 2: Yellowstone Wolves
Analyze real park data from 1995. Map how bringing back wolves allowed willows to grow and caused beaver populations to surge!
10-Minute Timer • Work Individually or in Pairs
Show all calculation steps!
Exit Ticket: Final Detective Challenge
3 Minutes Remaining
Scenario Prompt:
"A sudden disease wipes out all grasshoppers in a prairie ecosystem. Which population will experience a faster crash: the prairie grasses or the red-tailed hawks?"
State your clear prediction in 1 sentence.
Use the 10% energy transfer rule to justify your answer.
Write your response at the bottom of Page 2 on your worksheet. Turn in upon dismissal!
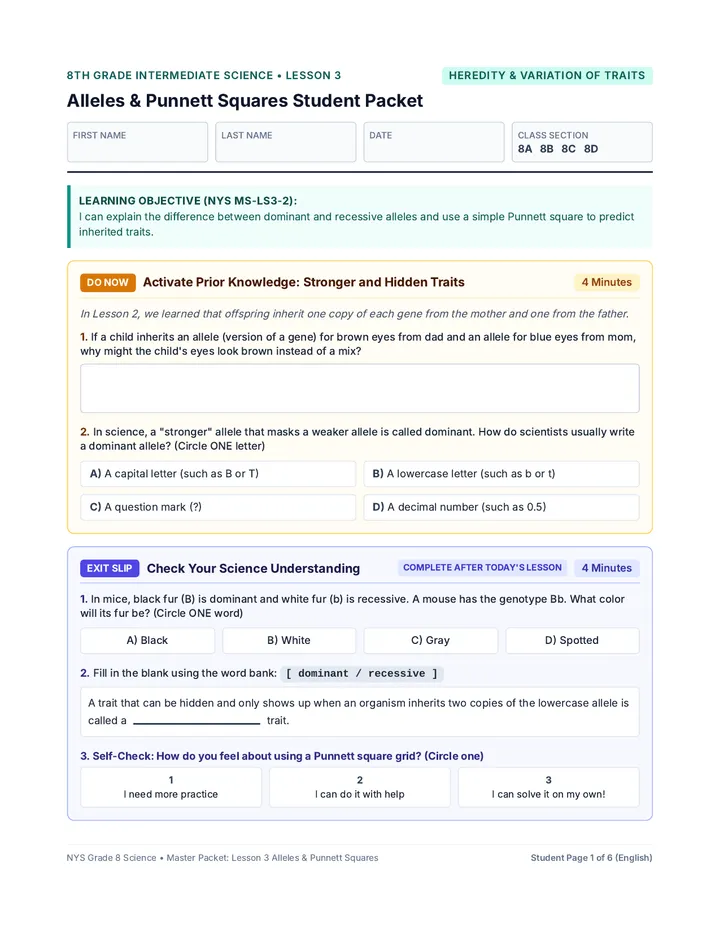
Energy Flow Worksheet Life Science Lab Activity
45-Minute Investigation
Energy Flow & Trophic Pyramids
Name:
Date:
Period:
The 10% Ecological Rule: Only ~10% of energy ingested at any trophic level is converted into new biomass for the next level. The remaining 90% is released as heat or metabolic waste.
1 Trophic Role Identification
Match each organism to its primary trophic level
A. Phytoplankton & Algae
Role:
B. Zooplankton / Krill
Role:
C. Leopard Seal
Role:
D. Orca (Killer Whale)
Role:
2 Savanna Energy Pyramid Math Challenge
Starting Energy: 100,000 kcal
An African savanna ecosystem receives sunlight allowing Acacia and Bermuda grass to synthesize 100,000 kcal of chemical energy. Calculate the energy transferred up each tier.
Tier 4: Apex Predator (Lions) Tertiary Consumers
Show calculation:
Available Energy: kcal
Tier 3: Secondary Consumer (Cheetahs) Carnivores eating herbivores
Show calculation:
Available Energy: kcal
Tier 2: Primary Consumer (Gazelles) Herbivores grazing grass
Show calculation:
Available Energy: kcal
Tier 1: Producers (Acacia Trees) Solar photoautotrophs
Base biomass intake:
100,000 kcal (Given Base)
Base Energy: 100,000 kcal
Analysis: Where did the 90,000 kcal that failed to reach the gazelles go? List two specific biological processes:
Student Worksheet • Energy Web Detectives Page 1 of 2
Part 3 & 4
Ecosystem Cascade Investigation
Case Study & Exit Ticket
Real-World Case Study: The Yellowstone Wolves (1995)
In 1926, grey wolves were eradicated from Yellowstone National Park. Without their apex predator, elk herds swelled to over 20,000 animals. Elk overgrazed riverbanks, chewing young willow and aspen trees down to nubs. Soil eroded into rivers, causing songbirds and beavers to abandon the valley. In 1995, biologists reintroduced 14 Canadian wolves. Within ten years, willow groves rebounded, beavers returned to build dams, and riverbanks stabilized.
1. Construct the 3-step food chain described in Yellowstone (Producer → Herbivore → Apex Predator):
2. Explain why the return of wolves helped beavers thrive, even though wolves do not provide food for beavers:
3. Define the ecological term Keystone Species and explain why the grey wolf fits this definition:
3-Minute Exit Ticket (Individual Assessment)
Score: /5
Prompt: A fungal disease wipes out all grasshoppers in a prairie ecosystem. Which population will experience a faster population drop: the prairie grasses or the red-tailed hawks? Defend your claim using the 10% energy transfer rule .
Student Worksheet • Energy Web Detectives Page 2 of 2
Energy Flow Answer Key Teacher Answer Key & Scoring Guide Confidential • Educator Copy
Energy Flow Worksheet Solutions
Total Points: 25 Pts
1 Part 1: Trophic Role Identification (4 Pts • 1 pt each)
A. Phytoplankton & Algae Producer (Photoautotroph)
Converts radiant solar energy into glucose via photosynthesis.
B. Zooplankton / Krill Primary Consumer (Herbivore)
Directly grazes on phytoplankton; occupies Trophic Level 2.
C. Leopard Seal Secondary / Tertiary Consumer
Carnivore feeding on penguins, fish, and smaller seals.
D. Orca (Killer Whale) Apex Predator
Highest trophic level; has no natural predators in marine ecosystem.
2 Part 2: Savanna Energy Pyramid Math Solutions (8 Pts • 2 pts per tier)
Rule: \(\text{Energy} \times 0.10\)
Tier 4: Lions (Apex) Tertiary Consumers
Calculation: \(1,000 \text{ kcal} \times 0.10 = 100 \text{ kcal}\)
100 kcal
Tier 3: Cheetahs Secondary Consumers
Calculation: \(10,000 \text{ kcal} \times 0.10 = 1,000 \text{ kcal}\)
1,000 kcal
Tier 2: Gazelles Primary Consumers
Calculation: \(100,000 \text{ kcal} \times 0.10 = 10,000 \text{ kcal}\)
10,000 kcal
Tier 1: Acacia / Grass Primary Producers
Base biomass value: 100,000 kcal (Given Base)
100,000 kcal
Analysis: Where did the 90,000 lost kcal go? (3 Pts) Exemplar Response
"The lost 90,000 kcal was released into the environment as metabolic heat during cellular respiration (powering plant growth and daily cell functions), or remained stored in uneaten/undigested plant structures (tough tree bark, deep root systems) that gazelles did not consume or could not break down."
Teacher Answer Key • Energy Web Detectives Page 1 of 2
Part 3 & 4 Solutions & Grading Rubric
Yellowstone & Exit Ticket
1. Yellowstone Food Chain (2 Pts) Correct Arrow Direction Required
Willows / Aspen Trees (Producer) → Elk (Herbivore) → Grey Wolves (Apex Predator)
Deduct 1 pt if arrows point backward (arrows must point in direction of energy transfer).
2. Beaver Population Surge Explanation (3 Pts) Trophic Cascade Logic
"When wolves returned, they hunted elk and forced them to avoid exposed river valleys. This allowed young willows and cottonwoods to regrow tall along stream banks. Beavers rely directly on willow branches for food and building dam lodges; without elk overgrazing the trees, beaver colonies had abundant resources to return and thrive."
3. Keystone Species Definition & Application (3 Pts) Definition + Evidence
"A keystone species is an organism that exerts a disproportionately large controlling effect on its ecosystem relative to its abundance. The grey wolf fits this definition because a small population (just 14-30 wolves) regulated thousands of elk, which transformed park vegetation, restored bird and beaver habitats, and even stabilized riverbank soil erosion."
Exit Ticket Exemplar & 5-Point Scoring Rubric
5 Points Total
Exemplar Student Response:
"Claim: The red-tailed hawks will experience a much faster population crash than the prairie grasses.Reasoning: Grasshoppers are primary consumers feeding on grass. When they vanish, the grass actually benefits temporarily from zero herbivore grazing pressure. However, hawks are secondary/tertiary predators that already receive only 1% to 0.1% of the original plant energy due to the 10% rule. Losing their primary prey cuts off their fragile calorie stream almost immediately, causing rapid starvation or migration."
Claim (1 Pt) Correctly selects hawks as crashing faster (or identifies immediate herbivore food cutoff).
10% Rule Evidence (2 Pts) Explicitly references low energy availability at higher trophic levels (e.g. 10% transfer).
Ecological Reasoning (2 Pts) Explains contrasting effect on grass (reduced grazing) vs. predators (acute food shortage).
Teacher Answer Key • Energy Web Detectives Page 2 of 2