A hands-on 4th-grade science sequence exploring energy transfer, thermal design, and data-driven climate analysis through weather tracking and solar oven engineering.
Quiz Part 1 (Matching): 1-C (Title), 2-E (Header), 3-B (Row), 4-A (Data Cell), 5-D (Units).
Quiz Part 2 (Calculation/Analysis): Q6: 12 mph (on Saturday). Q7: Sunday (15 mph). Q8: The wind speed trend is generally decreasing over the weekend.
Exit Ticket: Title check ensures scientific focus; wrong units lead to severe data misinterpretation (e.g., mixing inches with centimeters or Fahrenheit with Celsius).
WEATHER DATA DETECTIVES MASTER MANUAL PAGE 2 OF 2
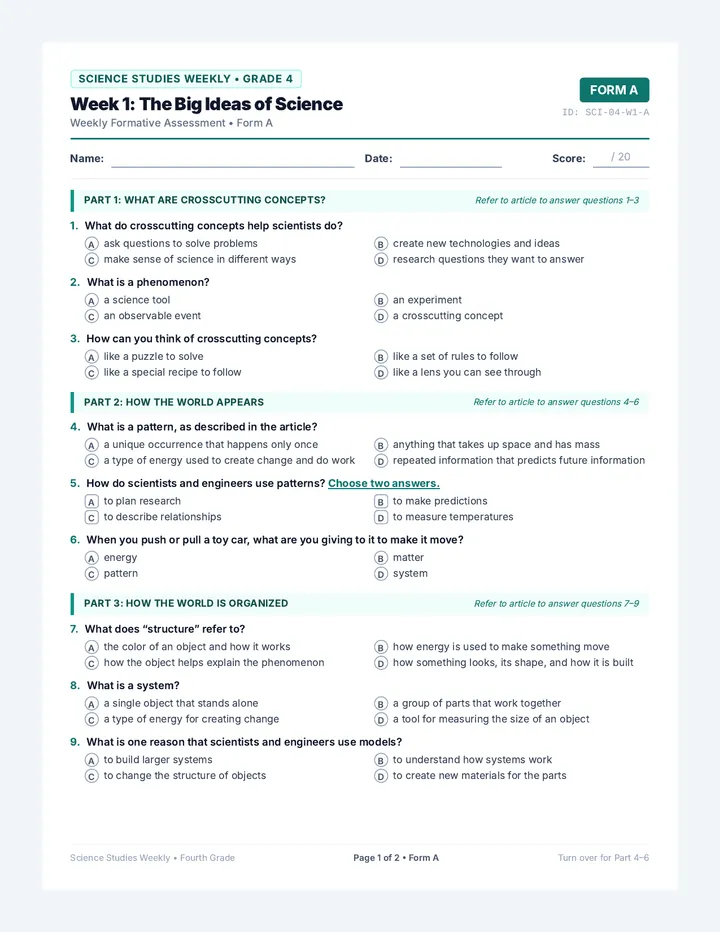
2 Which city is consistently drier across all four months? Support your answer with data.
3 Calculate the sum of rainfall for Sunnyvale in April and May combined. (Show your work!)
SPRING PRECIPITATION COMPILATION PAGE 2 OF 2
STATIONS 5-8
STATION 5
Winter Blizzard Depth
Month
Snow Accumulation
December
8 inches
January
14 inches
February
6 inches
Q1: Which month received the deepest snow accumulation?
Q2: Calculate the total winter snowfall across these 3 months.
STATION 6
Oasis Air Pressure
Day
Pressure (mb)
Monday
1014 mb
Tuesday
1011 mb
Wednesday
1008 mb
Q1: Which day recorded the lowest air pressure?
Q2: Low air pressure often signals storms. Which day was likely stormiest?
STATION 7
Beach UV Index Tracker
Time
UV Level
Risk Level
9:00 AM
3
Low
1:00 PM
9
Extreme
5:00 PM
2
Low
Q1: At what time was the UV Level and risk peak highest?
Q2: Explain the relationship between the sun's position and UV levels.
STATION 8
Climate Zones
Climate Zone
Yearly Temp
Yearly Rain
Desert City
88°F
4 inches
Coastal Bend
72°F
45 inches
Q1: Which zone is characterized by extremely hot temperatures and arid (dry) rain?
Q2: Which zone would be ideal for plants needing lots of moisture?
WEATHER STATION ROTATION PACK PAGE 2 OF 2
Pinpoints multiple variables quickly and integrates units (e.g. °F, mph) perfectly.
Locates requested values accurately on single rows.
Reads the wrong coordinate or row cell on matching tests.
Trend Interpretation
Clearly explains how values change sequentially and drafts logical predictions.
Identifies whether data is increasing, decreasing, or fluctuating.
Struggles to identify changes or describe general directions of data.
WEATHER STATION DATA EVALUATION UNIT PAGE 2 OF 2
1. Shortwave solar light passes easily through the clear plastic.
2. The light hits the black paper and turns into longwave heat.
3. The heat waves cannot pass back out through the plastic wrap!
Keep your plastic wrap wrinkle-free and taped down tight with no air gaps! Slide 4 of 7
THE BLUEPRINT SOLAR OVEN ANATOMY
How It All Fits Together
✨
Foil Reflector Lid
Bounces solar rays down into the cooking window to concentrate the sunlight.
🔍
Plastic Shield
Creates a transparent thermal trap. Prevents hot air from rising out.
⚫
Black Absorption Pad
Converts captured light into high-intensity thermal energy on contact.
📰
Newspaper Insulation
Blocks conductive heat loss through the bottom and sides of the box.
Each component solves one of our three core thermal energy problems! Slide 5 of 7
DATA ANALYSIS TESTING MISSION
How to Track Your Thermal Success
Thermal Heat Log (Group A Test)
Time (Mins)
Inside Temp (°F)
Outside Temp (°F)
0 min (Start)
72°F
72°F
5 min
84°F
72°F
10 min
98°F
73°F
15 min
115°F
73°F
Observe Temperature Growth
How much hotter did Group A's oven get compared to the starting temperature after 15 minutes? (115°F - 72°F = 43°F raise!)
Draw Conclusions
Did the outside air temperature change significantly during the test? (No, it only went up 1°F. The oven's rise was due to solar conversion!)
You will record your data every 5 minutes in your own Lab Journals! Slide 6 of 7
SAFETY PROTOCOL READY TO BUILD
Solar Lab Safety & Assembly Rules
1. Scissors & Cutting
Only adults/teachers may cut cardboard lids to create the flap window. Always cut away from yourself when trimming tape or paper.
2. Watch the Glass/Inside
Under direct sunlight, solar ovens can get extremely hot. Treat the inside cooking tray with care. Do not touch thermometers directly.
3. Align with the Sun
Adjust your reflective lid angle so the sun's reflection hits the bottom of the box directly. Avoid standing in other groups' shadows.
4. Record Diligently
Do not miss a 5-minute tracking point! Complete, accurate data logs are what make an engineer a scientist.
Next Step: Pick up your Solar Oven Lab Journal & start the build! Slide 7 of 7
Position ovens outdoors in full sunlight.
Angle reflectors to bounce light inside.
Insert thermometer behind plastic shield window.
Record temperature every 5 minutes.
Active Facilitation Scripting
Ask:"Why do we see moisture/fog forming under the plastic window?" Scientific explanation: Heat causes water in the marshmallow/cookie to evaporate. The plastic trap prevents this water vapor from escaping, causing condensation. This confirms our convection seal is working!
Ask:"If we painted the outside box black instead, would it cook better?" Scientific explanation: No, painting the outside black would heat up the box structure, but that heat would radiate out into the sky. We need the absorption to happen inside the insulated bubble!
Oven Lab Journal Solutions Guide
Part 1 (Diagram Labeling): A-Foil Reflector, B-Plastic Seal window, C-Black construction paper bottom, D-Newspaper padding.
Part 2 (Graphing/Analyzing Data): Q1: Look for highest point on line graph (expecting 110°F-130°F). Q2: Reflective lids concentrates photons; standard box relies on passive ambient absorption. Q3: Add newspaper layers or a tighter double-seal of tape across plastic seams.