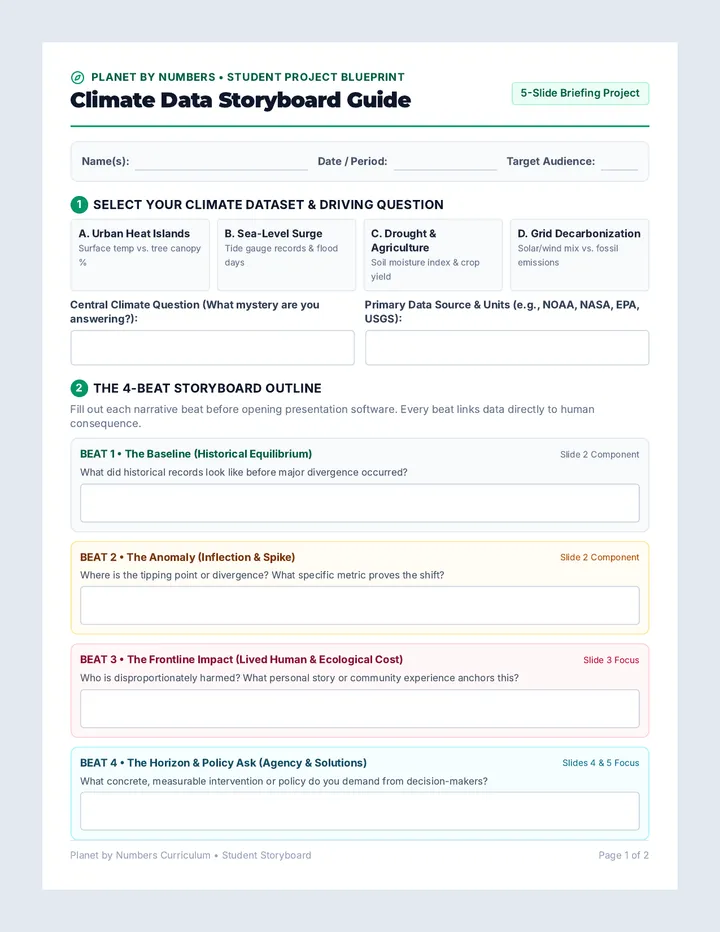
A comprehensive instructional bundle empowering students to decode climate datasets, craft compelling human-centered narratives, and deliver persuasive slide presentations.
[Show data on what works: modeled reductions, pilot success rates, or scalable technological/nature-based interventions.]
STRATEGY A
[Targeted Intervention 1]
[e.g., Municipal tree planting in top heat-vulnerable zip codes.]
Impact: -5.2°F localized surface drop
STRATEGY B
[Targeted Intervention 2]
[e.g., Permeable pavement & bioswales along commercial corridors.]
Impact: 40% reduction in runoff flood volume
STRATEGY C
[Targeted Intervention 3]
[e.g., Clean community microgrids with battery resilience.]
Impact: 99.4% uptime during extreme heat waves
Key takeaway: Solutions are not speculative; they are backed by demonstrated benchmarks. Slide 4 of 5
Slide 5 • The Call to Action
Our Civic Commitment
[Headline: What We Must Do in the Next 12–24 Months]
[A direct, actionable policy ask tailored specifically to your decision-making audience.]
1
Policy Adoption
[Specific resolution, zoning change, or climate standard to vote on.]
2
Resource Allocation
[Designated funding, grant matching, or staff time commitment.]
3
Accountability Metric
[Public dashboard, annual check-in, or measurable 2-year milestone.]
"Data tells us what is happening. Our choices determine what happens next."
Questions & Discussion
Criterion
Exemplary (4–5 pts)
Proficient (3 pts)
Developing (1–2 pts)
Score
Data Rigor & Sourcing
Authoritative source cited; baseline vs. anomaly clearly contrasted with accurate units.
Data source identified; trend is accurate but baseline context is slight or general.
Source missing or unclear; metrics confused or lack comparative context.
/5
Narrative Arc & Human Lens
Seamless flow through 4 beats; grounds abstract data in visceral human community reality.
Logical progression; connects data to human impacts but connection is generic.
Jumps between disconnected facts; lacks human focus or emotional resonance.
/5
Visual Craft & Slide Clarity
Passes 3-second rule; direct on-chart annotation, bold contrast, zero slide clutter.
Clean visual layout; chart is legible though requires audience decoding.
Overcrowded slides, tiny fonts, distorted axes, or unreadable raw data tables.
/5
Actionable Call & Delivery
Specific, time-bound, realistic policy ask; poised delivery within 4–6 min timeframe.
Presents a general solution; confident delivery with minor pacing or timing issues.
Vague "stop climate change" ask with no concrete mechanism; rushes or reads text.
/5
Planet by Numbers Curriculum • Visual Craft & Scoring Rubric Total Score: ______ / 20 Page 2 of 2