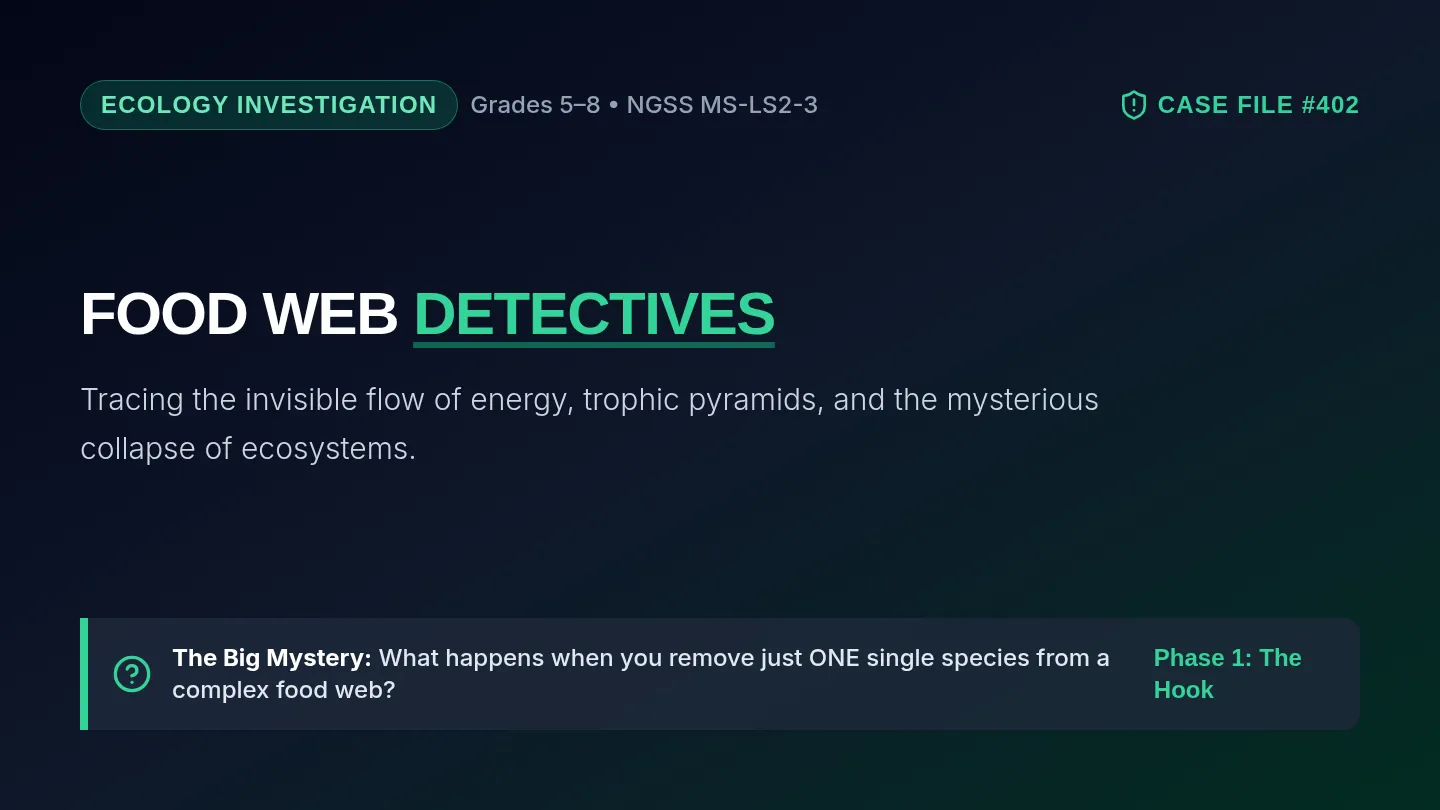
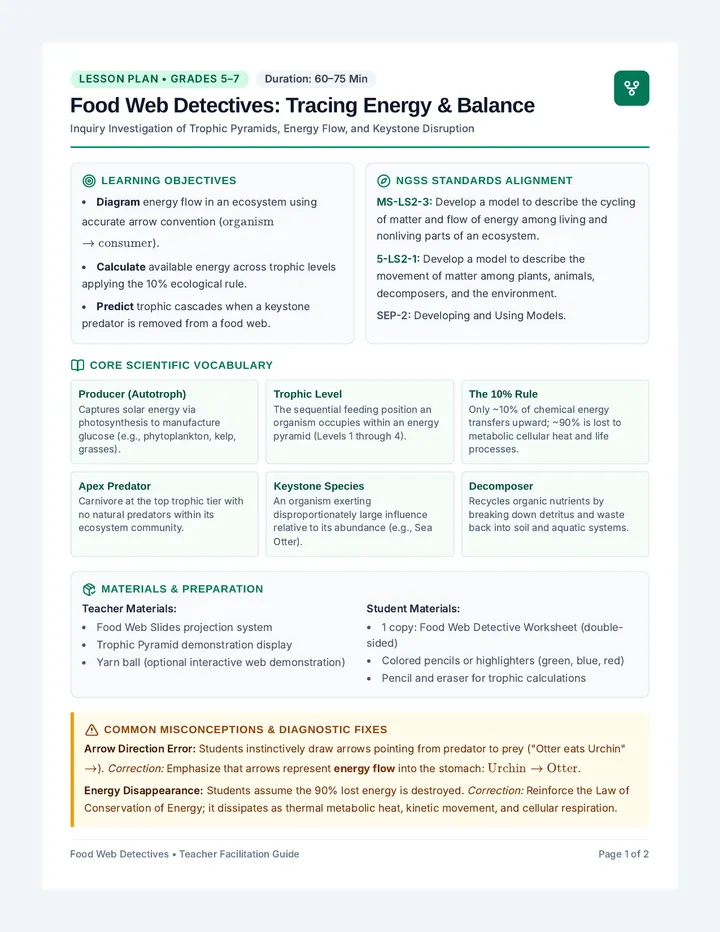
An inquiry-driven science lesson exploring trophic levels, energy transfer, and ecosystem stability for upper elementary and middle school learners. Students trace energy flow through food webs and investigate the ripple effects of keystone species disruption.
Body heat, digestion, movement, and life processes!
Ecosystem Architecture
Keystone Species & Cascades
System Dynamics
Trigger Event
Keystone Removed
The apex regulator is eliminated by hunting, disease, or human habitat loss.
First Wave
Herbivore Explosion
Primary consumer populations boom with no top-down predatory control.
Total Cascade
Habitat Demolition
Overgrazing eliminates the producers, crashing the foundation for all other animals.
"Like the keystone in a Roman stone arch, pull it out and the whole bridge crashes down."
Student Activity
Your Detective Investigation
Action Time: 25 Min
1
Trace Energy
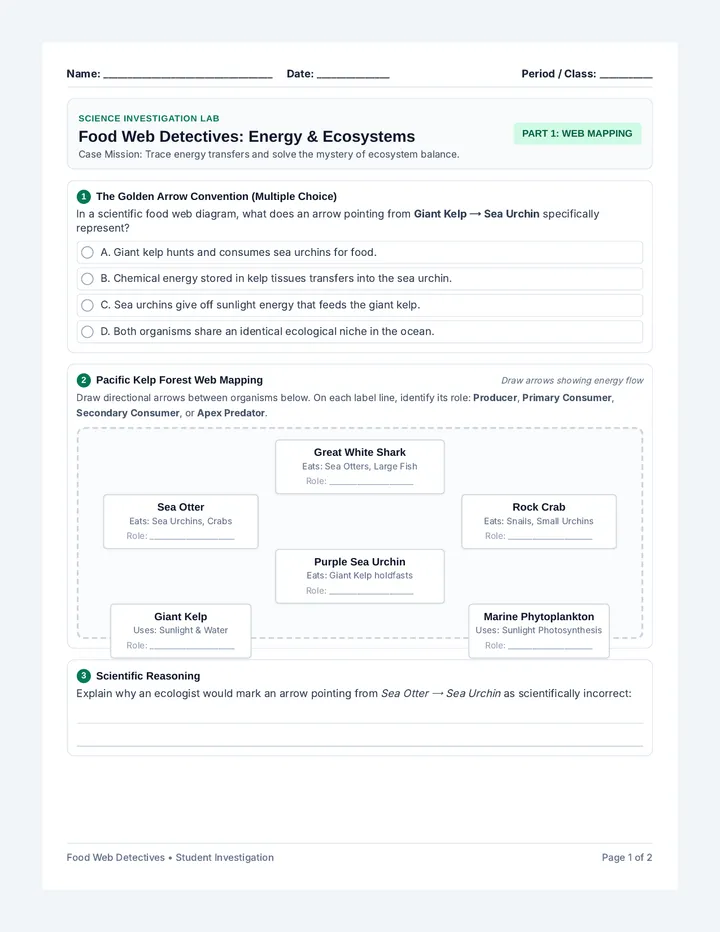
Draw energy flow arrows linking producers, consumers, and apex carnivores accurately on Part 1.
2
Calculate 10%
Compute the remaining kilocalories at each trophic step starting from \(50{,}000\text{ kcal}\) of primary producers.
3
Solve Disruption
Predict exactly what happens to each species when a key link is broken or contaminated by toxins.
Complete worksheets in detective pairs • Be ready to defend your predictions!
Ready, Set, Investigate!
Level 2: Primary Consumer (Purple Sea Urchin)
Level 1: Primary Producer (Giant Kelp)
Given Baseline
50,000 kcal
Critical Question: If only 10% moves up the pyramid, what happens to the other 90% of the energy at each trophic tier?
5 The Keystone Disruption Investigation
Scenario: In a nearby bay, an outbreak of sea otter disease reduces the otter population from 200 down to 6 individuals. Answer the diagnostic questions below:
A. Population Prediction: What will happen to the Purple Sea Urchin population in this bay over the next 6 months? Explain the biological reason why.
B. Habitat Impact: How will the change in sea urchin numbers affect the Giant Kelp forest and the fish species that rely on kelp for nursery shelter?
C. Claim Evaluation: A local observer claims: "Fewer otters means the bay will have more fish because otters won't eat them." Is this claim scientifically accurate or flawed? Justify your answer.
Food Web Detectives • Student Investigation Page 2 of 2
Level 4: Great White Shark (Apex)
\(500\text{ kcal} \times 0.10\) or \(500 \div 10\)
50 kcal
Level 3: Sea Otter (Secondary)
\(5{,}000\text{ kcal} \times 0.10\) or \(5{,}000 \div 10\)
500 kcal
Level 2: Purple Sea Urchin (Primary)
\(50{,}000\text{ kcal} \times 0.10\) or \(50{,}000 \div 10\)
5,000 kcal
Level 1: Giant Kelp (Producer)
Baseline sunlight captured
50,000 kcal
90% Energy Loss Explanation (1 pt): The remaining 90% is released as thermal metabolic heat through cellular respiration, expended during daily movement and life processes, or excreted in undigested waste.
5 Question 5: Keystone Disruption Case Study (6 Points)
5A. Urchin Population Surge (2 pts):
The urchin population will multiply rapidly (exponential growth). Because sea otters are their primary predator, losing otters removes top-down predatory population control.
5B. Kelp Forest & Nursery Collapse (2 pts):
The overabundant urchins will overgraze kelp holdfasts, clear-cutting the forest and creating "urchin barrens." Fish lose vital breeding grounds, hiding cover, and food, causing fish populations to crash.
The claim is scientifically flawed. While otters occasionally consume small fish or crabs, they protect the entire ecosystem's foundation. Without otters, urchins destroy the kelp nursery habitats, resulting in a severe drop in total fish numbers rather than an increase.
Investigation Analytic Scoring Rubric
Level 4: Mastery (23–25)
All arrows accurate; 10% math fully correct; articulates keystone cascade with habitat evidence.
Level 3: Proficient (19–22)
Arrows point toward consumers; minor math slips; understands otter-urchin-kelp relationship.