Science Reasoning Toolkit Reference
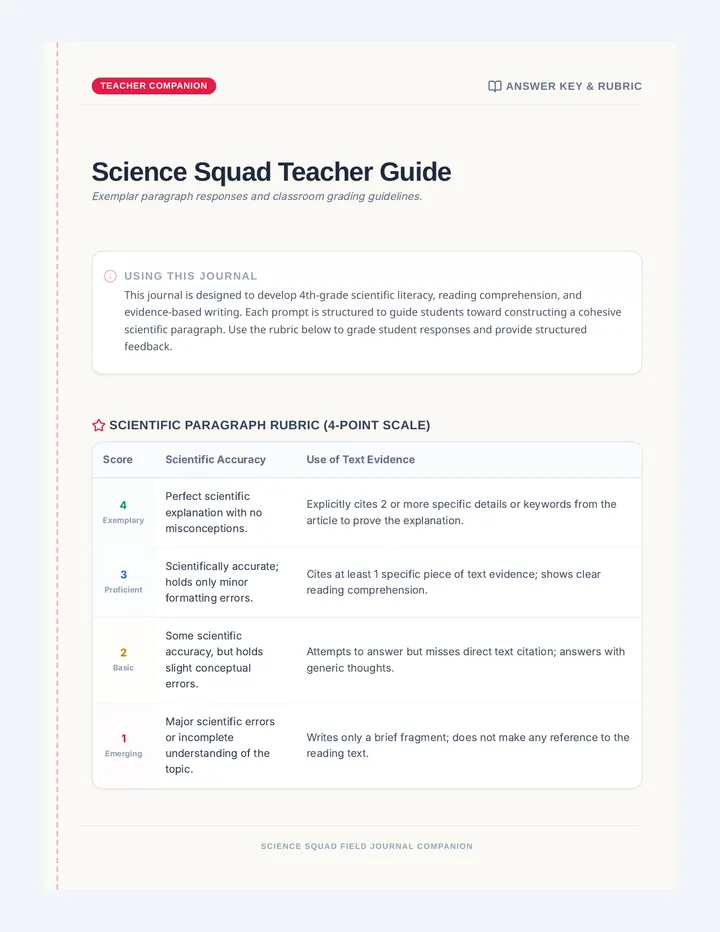
Science Reasoning Toolkit
Reading Data Tables, Graphs, and Models
1. Data Table Decoder
-
1
Read the Title: Identifies the specific variables being tested in the study.
-
2
Check Headers: Look for Independent (X) in the first column and Dependent (Y) in the others.
-
3
Scan for Units: Note the measurement units (grams, meters, °C) to understand the scale.
| Time (s) X-Variable | Distance (m) Y-Variable |
|---|
| 0 | 0 |
| 5 | 12.5 |
Variable Vault
Independent Variable (IV)
The factor YOU change or control on purpose. Think of this as the "Cause."
Dependent Variable (DV)
The factor that you measure. It reacts to the changes you made. The "Effect."
DRY Dependent
Result | Y-Axis
MIX Manipulated
Independent | X-Axis
2. Graph Anatomy
Dependent Variable (Y)
Independent Variable (X)
Descriptive Title (DV vs. IV)
Bar Graphs
Used for comparing different categories or groups.
Line Graphs
Used for showing continuous change over time.
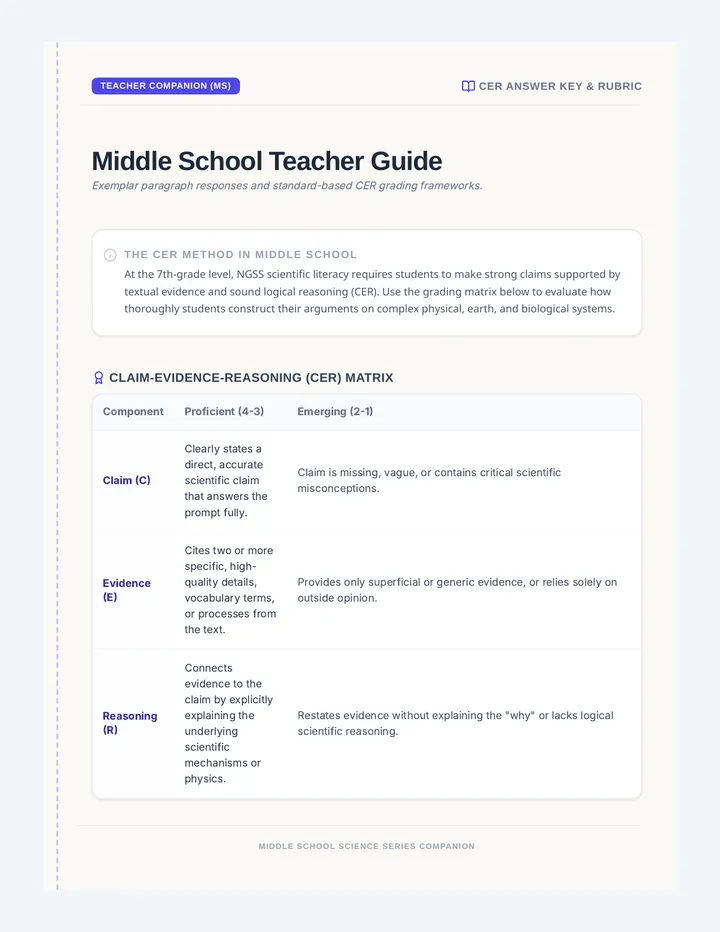
3. The CER Blueprint
C
Claim
A one-sentence direct answer to the question.
"As the independent variable increases, the dependent variable..."
E
Evidence
Specific data points from your table or graph.
"The table shows that at 5 seconds, the distance was 12.5 meters."
R
Reasoning
Explain HOW the evidence supports your claim.
"This shows a direct relationship because more time allows for..."
Pro Tip: Always check your units! 5 meters is very different from 5 kilometers!