Gravity Graphs Matching Worksheet
AP / Conceptual Physics • Universal Gravitation
Gravity Graphs Matching Worksheet
Name:
Date: Period:
Law of Universal Gravitation: \( F_g = G \frac{m_1 m_2}{r^2} \)
Determine how gravitational force behaves when varying one parameter while holding all others constant.
1 Part 1: Graph Reference Panels
Vertical axis represents Gravitational Force (\(F_g\))
Graph A Constant Slope
F X 0 Linear through (0,0)
Graph B Steep Decay
F X 0 Inverse-Square Curve
Graph C Inverse Curve
F X 0 Standard Inverse Curve
2 Part 2: Match Variables & Justify Mathematical Reasoning
Match each relationship to Graph A, B, or C
Relationship 1:
Force vs. Mass of One Object (\(m_1\))
Holding \(m_2\) and distance \(r\) constant
Match:
Proportionality: F ∝ _____ If mass doubles (\(2m\)), Force becomes: ____×
Mathematical reasoning & equation justification:
Relationship 2:
Force vs. Distance Between Centers (\(r\))
Holding both masses \(m_1, m_2\) constant
Match:
Proportionality: F ∝ _____ If distance doubles (\(2r\)), Force becomes: ____×
Mathematical reasoning & equation justification:
Relationship 3:
Force vs. Distance Squared (\(r^2\))
Where \(X = r^2\); holding masses constant
Match:
Proportionality: F ∝ _____ If \((r^2)\) doubles, Force becomes: ____×
Mathematical reasoning & equation justification:
3 Part 3: Comparative Analysis & Linearization
Synthesize conceptual insights
A. Comparing Curves: \(F\) vs. \(r\) vs. \(F\) vs. \(r^2\)
Explain why the Force vs. Distance curve drops significantly more steeply near small values of \(r\) than the Force vs. Distance Squared (\(r^2\)) curve.
B. Linearizing Gravitational Distance Data
To produce a straight line through the origin from experimental distance data, what quantity should be plotted on the horizontal axis? What does its slope represent?
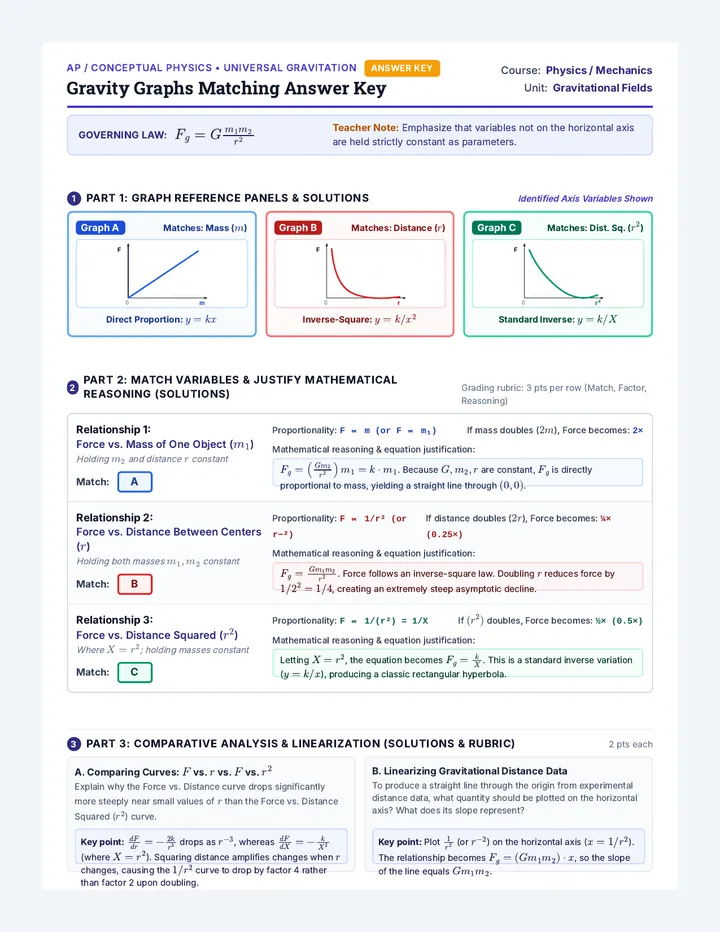
Gravity Graphs Matching Answer Key
AP / Conceptual Physics • Universal Gravitation Answer Key
Gravity Graphs Matching Answer Key
Course: Physics / Mechanics
Unit: Gravitational Fields
Governing Law: \( F_g = G \frac{m_1 m_2}{r^2} \)
Teacher Note: Emphasize that variables not on the horizontal axis are held strictly constant as parameters.
1 Part 1: Graph Reference Panels & Solutions
Identified Axis Variables Shown
Graph A Matches: Mass (\(m\))
F m 0 Direct Proportion: \(y = kx\)
Graph B Matches: Distance (\(r\))
F r 0 Inverse-Square: \(y = k/x^2\)
Graph C Matches: Dist. Sq. (\(r^2\))
F r² 0 Standard Inverse: \(y = k/X\)
2 Part 2: Match Variables & Justify Mathematical Reasoning (Solutions)
Grading rubric: 3 pts per row (Match, Factor, Reasoning)
Relationship 1:
Force vs. Mass of One Object (\(m_1\))
Holding \(m_2\) and distance \(r\) constant
Match: A
Proportionality: F ∝ m (or F ∝ m₁) If mass doubles (\(2m\)), Force becomes: 2×
Mathematical reasoning & equation justification:
\(F_g = \left(\frac{Gm_2}{r^2}\right) m_1 = k \cdot m_1\). Because \(G, m_2, r\) are constant, \(F_g\) is directly proportional to mass, yielding a straight line through \((0,0)\).
Relationship 2:
Force vs. Distance Between Centers (\(r\))
Holding both masses \(m_1, m_2\) constant
Match: B
Proportionality: F ∝ 1/r² (or r−²) If distance doubles (\(2r\)), Force becomes: ¼× (0.25×)
Mathematical reasoning & equation justification:
\(F_g = \frac{Gm_1m_2}{r^2}\). Force follows an inverse-square law. Doubling \(r\) reduces force by \(1/2^2 = 1/4\), creating an extremely steep asymptotic decline.
Relationship 3:
Force vs. Distance Squared (\(r^2\))
Where \(X = r^2\); holding masses constant
Match: C
Proportionality: F ∝ 1/(r²) = 1/X If \((r^2)\) doubles, Force becomes: ½× (0.5×)
Mathematical reasoning & equation justification:
Letting \(X = r^2\), the equation becomes \(F_g = \frac{k}{X}\). This is a standard inverse variation (\(y = k/x\)), producing a classic rectangular hyperbola.
3 Part 3: Comparative Analysis & Linearization (Solutions & Rubric)
2 pts each
A. Comparing Curves: \(F\) vs. \(r\) vs. \(F\) vs. \(r^2\)
Explain why the Force vs. Distance curve drops significantly more steeply near small values of \(r\) than the Force vs. Distance Squared (\(r^2\)) curve.
Key point: \(\frac{dF}{dr} = -\frac{2k}{r^3}\) drops as \(r^{-3}\), whereas \(\frac{dF}{dX} = -\frac{k}{X^2}\) (where \(X=r^2\)). Squaring distance amplifies changes when \(r\) changes, causing the \(1/r^2\) curve to drop by factor 4 rather than factor 2 upon doubling.
B. Linearizing Gravitational Distance Data
To produce a straight line through the origin from experimental distance data, what quantity should be plotted on the horizontal axis? What does its slope represent?
Key point: Plot \(\frac{1}{r^2}\) (or \(r^{-2}\)) on the horizontal axis (\(x = 1/r^2\)). The relationship becomes \(F_g = (G m_1 m_2) \cdot x\), so the slope of the line equals \(G m_1 m_2\).