Filtration & Glassware
Sensor Rig & Prototyping
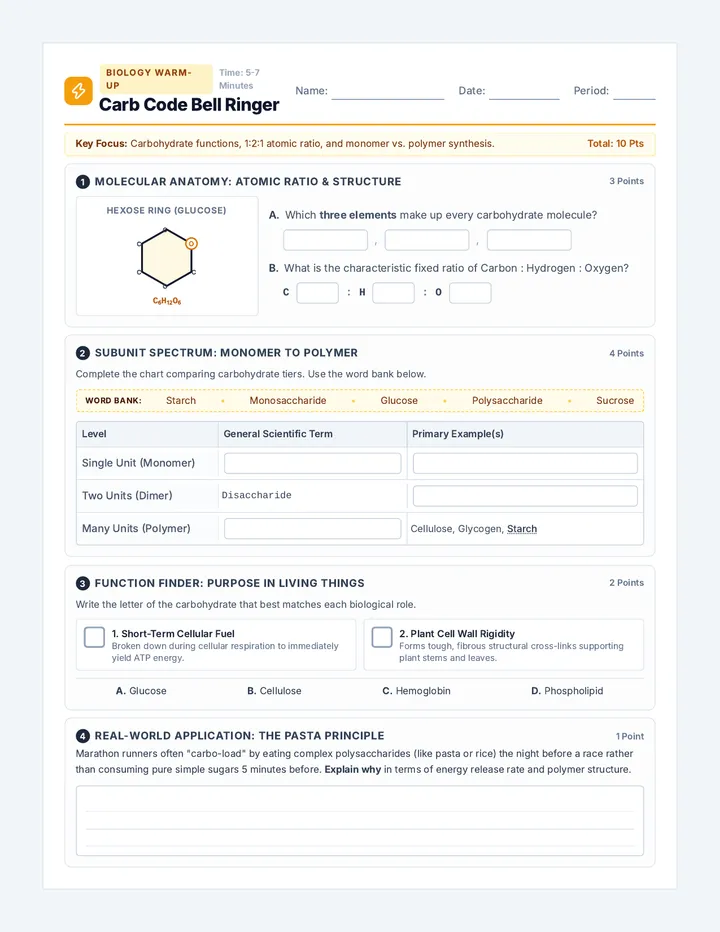
Week 1 Days 1–5
Phase 1: Runoff Chemistry & Bio-Coagulation Jar Tests Milestone 1
Formulate standardized synthetic urban stormwater. Conduct jar test trials comparing Moringa seed cationic protein vs. Chitosan vs. Alum control. Measure floc formation time and settling velocity.
Week 2 Days 6–10
Phase 2: Adsorption Media Synthesis & Multi-Bed Column Setup Milestone 2
Synthesize biochar from agricultural husks or spent coffee grounds. Assemble variable multi-bed columns (gravel, sand, biochar, coagulant fleece). Measure clean water percolation flux (\(\text{mL/min}\)).
Week 3 Days 11–15
Phase 3: Quantitative Breakthrough & Water Quality Analysis Milestone 3
Pump \(2000\text{ mL}\) simulated contaminated runoff through columns. Measure influent vs. effluent turbidity (NTU), dissolved ion removal via colorimetry, and \(\text{pH}\) shifts. Graph breakthrough curves.
Week 4 Days 16–20
Phase 4 & 5: Permeable Tile Design & Municipal Watershed Pitch Final Expo
Package filtration media into an artistic, modular street-curb insert or interlocking permeable bio-paving tile. Present full filtration data and community life-cycle cost analysis to civic water board guests.
Under The Hood: Flocculation & Surface Adsorption Chemistry
Turbidity colloids carry negative zeta surface potentials (\(\approx -25\text{ mV}\)) that repel one another. Cationic dimeric proteins in Moringa seeds neutralize negative surface charges, allowing van der Waals forces to aggregate micro-particles into dense flocs. Meanwhile, activated biochar exposes \(400\text{--}800\text{ m}^2/\text{g}\) of microporous carbon surface, trapping dissolved heavy metal cations and organic dyes via \(\pi\text{-}\pi\) electron stacking and electrostatic chelation.
AquaFilter Chemistry STEAM Project Guide Page 2 • Roadmap & Lab Reagents
Assessment Checkpoint
1. Coagulation & Adsorption Log 25 Pts
Complete data logs for 4 distinct media ratios, flocculation jar test kinetics, settling velocity calculations, and molecular adsorption schematics.
2. Physical Modular Filter Cartridge 30 Pts
One fully fabricated, gravity-fed multi-stage filtration cartridge or permeable bio-paving tile prototype featuring aesthetic biomimetic exterior housing.
3. Water Quality Analytics Sheet 25 Pts
Calibrated graphs showing NTU turbidity reduction over time, spectrophotometric contaminant clearance (\(\%\)), and hydraulic flow rate curves.
4. Watershed Civic Pitch Deck 20 Pts
A 3-minute civic pitch detailing community placement in high-runoff urban corridors, raw material circularity, and long-term regeneration economics.
Record layer depths and media formulations prior to testing
| Bed # | Primary Adsorbent | Layer Depth (\(\text{cm}\)) | Coagulant Dose (\(\text{mg/L}\)) | Sediment Trap Media | Target Contaminant Hypothesis |
|---|---|---|---|---|---|
| C-01 (Ctrl) | Silica Sand / Gravel | \(5.0\text{ cm}\) | \(0\text{ mg/L}\) (No bio-aid) | Coarse quartz | Traps large particulates only; zero ion removal |
| C-02 | |||||
| C-03 | |||||
| C-04 (Opt) |
A. Turbidity Clearance (NTU)
Calibrate nephelometer with \(0.02\text{ NTU}\) blank. Measure influent turbidity (\(\approx 200\text{ NTU}\)). Collect effluent at \(500\text{ mL}\) intervals. Calculate: \(\% \text{ NTU Reduction} = \frac{\text{NTU}_{\text{in}} - \text{NTU}_{\text{out}}}{\text{NTU}_{\text{in}}} \times 100\).
B. Colorimetric Adsorption
Use spectrophotometer or colorimeter at \(\lambda = 665\text{ nm}\) to measure synthetic dye/contaminant absorbance before and after bed transit. Determine mass adsorbed per gram of biochar (\(q_e\)).
C. Hydraulic Flux & Clogging
Maintain a constant \(5.0\text{ cm}\) liquid head above filter media. Record time required to discharge \(250\text{ mL}\). Calculate hydraulic conductivity (\(K\)) and monitor flow decay to detect premature clogging.
AquaFilter Chemistry STEAM Project Guide Page 3 • Deliverables & Matrix
Design & Assessment
Annotate media grain sizes, flow direction, and retention screens
[ Cross-Section Filter Architecture & Flow Blueprint ]
Target Community Site:
Total Bed Volume (\(\text{cm}^3\)):
Optimal Retention Time:
Regeneration Cycle:
1. Surface Chelation & Charge Neutralization: Contrast how physical sand filtration differs chemically from the electrostatic mechanisms of Moringa bio-coagulation and biochar adsorption.
2. Environmental Watershed Equity: How can decentralized, low-cost bio-filtration infrastructure reduce environmental justice disparities in communities burdened by high stormwater runoff?
| Criterion | Exemplary (4–5 Pts / 90–100%) | Proficient (3 Pts / 75–85%) | Score |
|---|---|---|---|
| Aqueous Chemical Inquiry | Accurately models zeta potential & pore adsorption; formulates 4+ controlled multi-bed filtration trials. | Executes required trials; minor gaps in chemical coagulation theory or ratio precision. | / 25 |
| Sensor Rig & Analytics | Collects calibrated NTU, absorbance, and flow rate data; plots accurate breakthrough curves with trendlines. | Water quality metrics collected; minor omissions in calibration blanks or flow rate units. | / 25 |
| Cartridge Engineering & Craft | Constructs modular, leak-proof housing; effectively balances high contaminant clearance with robust flow flux. | Filter functions but exhibits minor channel preferential flow or media leakage into effluent. | / 25 |
| Civic Pitch & Circular LCA | Delivers persuasive 3-min pitch to water district jurors; details circular waste sourcing and maintenance lifecycle. | Pitch addresses stormwater challenges; lacks complete cost modeling or spent media disposal plan. | / 25 |
AquaFilter Chemistry STEAM Project Guide Page 4 • Blueprint & Evaluation
Thermal Lab Apparatus
Testing & Prototyping Rig
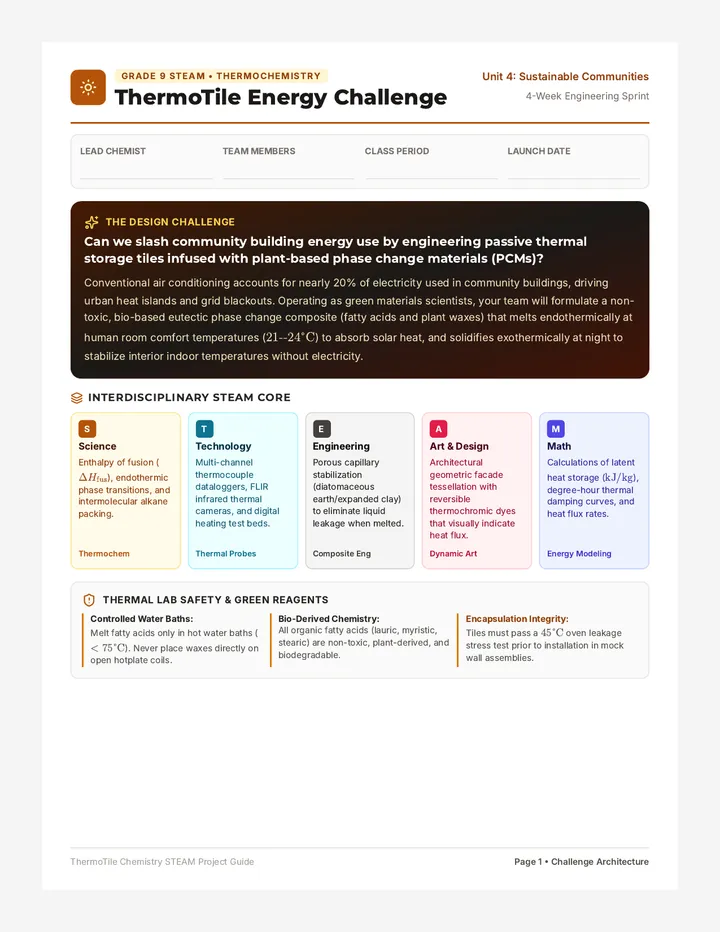
Week 1 Days 1–5
Phase 1: Thermochemical Phase Curves & Eutectic Mixtures Milestone 1
Map heating and cooling curves for pure fatty acids. Formulate binary eutectic mixtures (e.g., 60:40 Lauric:Myristic acid) to depress melting points to target human comfort range (\(22\text{--}24^\circ\text{C}\)).
Week 2 Days 6–10
Phase 2: Composite Capillary Stabilization & Leak Prevention Milestone 2
Impregnate molten eutectic PCM into porous diatomaceous earth or expanded perlite. Determine the maximum mass fraction (\(\%\)) of PCM absorbed without liquid seepage during phase change.
Week 3 Days 11–15
Phase 3: Environmental Chamber Testing & Thermal Damping Milestone 3
Subject mock building enclosures lined with ThermoTiles to simulated solar radiation cycles (100W lamp). Record internal temperature lag (\(\Delta t\)) and peak temperature reduction (\(\Delta T\)) vs. control gypsum tiles.
Week 4 Days 16–20
Phase 4 & 5: Facade Tessellation & Community Retrofit Pitch Final Expo
Apply dynamic thermochromic surface finishes that turn translucent or change color at \(24^\circ\text{C}\). Present building life-cycle energy savings data and kilowatt-hour reduction models to school board facility directors.
Under The Hood: Eutectic Depression & Latent Heat Enthalpy
Pure lauric acid melts at \(44^\circ\text{C}\), but mixing it with myristic acid disrupts crystal lattice symmetry. At the eutectic point (\(66\%\) lauric : \(34\%\) myristic), the mixture transitions sharply at \(\approx 23.5^\circ\text{C}\). During melting, energy breaks intermolecular hydrogen bonds without raising temperature (\(q = m \cdot \Delta H_{\text{fus}}\)), storing \(\approx 180\text{ J/g}\) of heat that would otherwise spike indoor room temperatures.
ThermoTile Chemistry STEAM Project Guide Page 2 • Roadmap & Lab Reagents
Assessment Checkpoint
1. Thermochemical Formulation Log 25 Pts
Complete eutectic phase diagrams for 4 fatty acid ratios, latent heat calculations (\(\Delta H_{\text{fus}}\)), crystallization temperatures, and supercooling observations.
2. Physical ThermoTile Prototype 30 Pts
One leak-proof, cured \(12\text{ cm} \times 12\text{ cm}\) composite wall tile incorporating shape-stabilized PCM and an aesthetic thermochromic heat-indicator facade.
3. Thermal Damping Analytics Sheet 25 Pts
Time-temperature curves comparing interior cell temperatures with and without ThermoTiles under 60 minutes of direct simulated solar radiation.
4. Community Retrofit Pitch Deck 20 Pts
A 3-minute architectural pitch projecting annual kilowatt-hour reductions, greenhouse gas offsets, and payback periods for a local community building.
Record mass percentages and carrier matrices prior to melting
| Trial | PCM Blend (\(\%\) Mass) | Target \(T_m\) (\(^\circ\text{C}\)) | Carrier Matrix Media | PCM:Carrier Ratio | Observed Leakage & Solidification |
|---|---|---|---|---|---|
| P-01 (Ctrl) | Pure Soy Wax (\(100\%\)) | \(52.0^\circ\text{C}\) | Plaster binder only | \(30 : 70\) | Zero melting at room temp; no thermal buffering |
| P-02 | |||||
| P-03 | |||||
| P-04 (Opt) |
A. Phase Curve Mapping
Immerse thermocouple probe in \(20\text{g}\) liquid PCM blend in water bath. Cool slowly at \(1^\circ\text{C/min}\). Record temperature every \(15\text{ s}\). The flat plateau represents the latent phase change temperature (\(T_m\)).
B. Oven Leakage & Mass Loss
Place cured composite tile on pre-weighed filter paper in a \(40^\circ\text{C}\) oven for \(2\text{ hours}\). Measure paper mass change (\(\Delta m\)). Any seepage exceeding \(1.0\%\) fails structural stability standards.
C. Solar Heat Lag (\(\Delta T\))
Mount tile in mock wall cell opposite a 100W halogen source at \(25\text{ cm}\). Log internal air temperature for \(45\text{ min}\) heating and \(45\text{ min}\) cooling. Calculate peak temperature damping: \(\Delta T_{\text{damp}} = T_{\text{ctrl}} - T_{\text{pcm}}\).
ThermoTile Chemistry STEAM Project Guide Page 3 • Deliverables & Matrix
Design & Assessment
Annotate composite core, barrier layer, and thermochromic facade
[ Cross-Section Architecture & Geometric Facade Layout ]
Target Wall Orientation:
PCM Core Mass (\(\text{g}\)):
Transition \(T_m\) Range:
Peak \(\Delta T\) Damping:
1. Enthalpy of Fusion vs. Specific Heat: Explain why a material undergoing a phase change can absorb significantly more thermal energy than one simply rising in temperature (\(q = m\Delta H_{\text{fus}}\) vs. \(q = mc\Delta T\)).
2. Passive Urban Heat Island Equity: How does incorporating passive thermal storage into low-income community housing address energy poverty during extreme summer heat waves?
| Criterion | Exemplary (4–5 Pts / 90–100%) | Proficient (3 Pts / 75–85%) | Score |
|---|---|---|---|
| Thermochemical Inquiry | Calculates precise eutectic melting transitions; accurately quantifies \(\Delta H_{\text{fus}}\) and latent plateaus across 4+ controlled blends. | Executes required trials; minor imprecision in eutectic ratio calculations or plateau logging. | / 25 |
| Thermal Testing & Analytics | Captures calibrated thermocouple and IR imagery; constructs labeled heating/cooling curves with clear \(\Delta T\) lag metrics. | Thermal curves plotted; minor omissions in control comparison or degree-hour units. | / 25 |
| Tile Engineering & Design | Zero leakage at \(40^\circ\text{C}\); exhibits robust structural integrity and visually stunning dynamic thermochromic facade geometry. | Tile holds together; exhibits minor surface seepage or uneven thermochromic dye response. | / 25 |
| Community Energy Pitch | Delivers persuasive 3-min pitch to facilities board backed by realistic kWh reductions, carbon offsets, and payback periods. | Pitch covers energy reduction; lacks complete architectural cost comparison or installation plan. | / 25 |
ThermoTile Chemistry STEAM Project Guide Page 4 • Blueprint & Evaluation