Mathematics for Biology Handout
Mathematics for Biology
Day 1 Reading and describing biological data
Grade 9 Biology
Name: ___________________________
Class: ____________
Date: ____________
Learning target
I can classify data, describe a data set, and use measurements that appear in Biology investigations.
Quick reference
Categorical data: groups or labels.
Numerical data: measurements or counts.
Discrete data: counted values, usually whole numbers.
Continuous data: measured values that can fall between two numbers.
Mean: add all values and divide by the number of values.
Median: middle value after the values are ordered.
Mode: value that appears most often.
Minimum: smallest value.
Maximum: largest value.
Range: maximum minus minimum.
Diameter: distance across a circle through the center.
Radius: distance from the center to the edge. Radius equals diameter divided by 2.
Area of a circle: A = πr².
Volume of a rectangular prism: V = length × width × height.
Volume of a cylinder: V = πr²h.
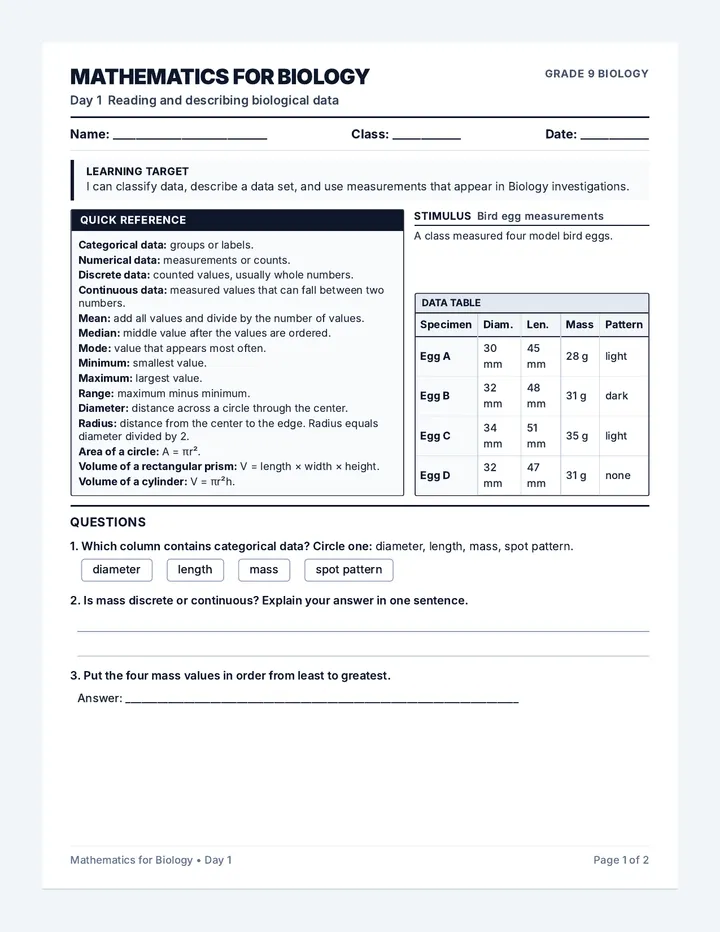
Stimulus Bird egg measurements
A class measured four model bird eggs.
Data table
| Specimen | Diam. | Len. | Mass | Pattern |
|---|
| Egg A | 30 mm | 45 mm | 28 g | light |
| Egg B | 32 mm | 48 mm | 31 g | dark |
| Egg C | 34 mm | 51 mm | 35 g | light |
| Egg D | 32 mm | 47 mm | 31 g | none |
Questions
1. Which column contains categorical data? Circle one: diameter, length, mass, spot pattern.
diameter length mass spot pattern
2. Is mass discrete or continuous? Explain your answer in one sentence.
3. Put the four mass values in order from least to greatest.
Answer: __________________________________________________________________________
Mathematics for Biology • Day 1 Page 1 of 2
Mathematics for Biology
Day 1 • Questions (continued)
Student Handout
4. Calculate the mean mass. Show your work.
5. Find the median, mode, minimum, maximum, and range of the mass values.
Median: __________________
Mode: __________________
Minimum: __________________
Maximum: __________________
Range: __________________
6. Egg B has a diameter of 32 mm. Calculate its radius.
Radius: __________________________________________________________________________
7. Use Egg B's radius to calculate the area of a circle with the same diameter. Use 3.14 for π. Show your work and include square millimeters.
8. The class wants to test whether egg diameter affects rolling distance. Label each variable: independent, dependent, or controlled.
Egg diameter: __________________________________________________
Rolling distance: __________________________________________________
Ramp height: __________________________________________________
9. Write one objective sentence using a number from the table.
Exit check
One idea I need to practise again is: ___________________________________________________________________
Mathematics for Biology • Day 1 Page 2 of 2
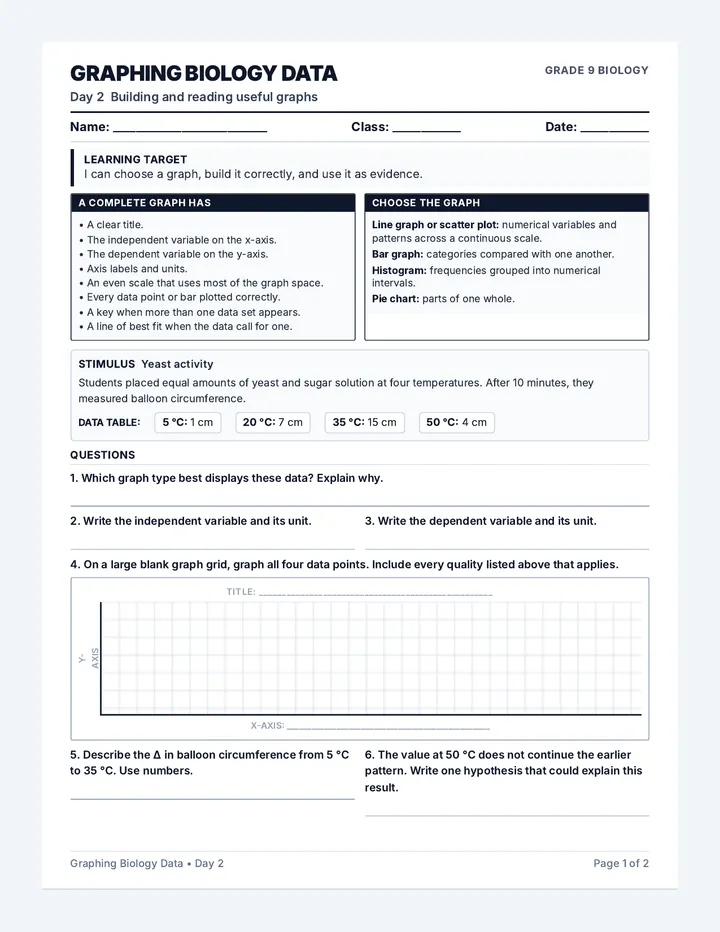
Graphing Biology Handout
Graphing Biology Data
Day 2 Building and reading useful graphs
Grade 9 Biology
Name: ___________________________
Class: ____________
Date: ____________
Learning target
I can choose a graph, build it correctly, and use it as evidence.
A complete graph has
• A clear title.
• The independent variable on the x-axis.
• The dependent variable on the y-axis.
• Axis labels and units.
• An even scale that uses most of the graph space.
• Every data point or bar plotted correctly.
• A key when more than one data set appears.
• A line of best fit when the data call for one.
Choose the graph
Line graph or scatter plot: numerical variables and patterns across a continuous scale.
Bar graph: categories compared with one another.
Histogram: frequencies grouped into numerical intervals.
Pie chart: parts of one whole.
Stimulus Yeast activity
Students placed equal amounts of yeast and sugar solution at four temperatures. After 10 minutes, they measured balloon circumference.
Data table:
5 °C: 1 cm 20 °C: 7 cm 35 °C: 15 cm 50 °C: 4 cm
Questions
1. Which graph type best displays these data? Explain why.
2. Write the independent variable and its unit.
3. Write the dependent variable and its unit.
4. On a large blank graph grid, graph all four data points. Include every quality listed above that applies.
Title: ___________________________________________________
y-axis
x-axis: _________________________________________________
5. Describe the Δ in balloon circumference from 5 °C to 35 °C. Use numbers.
6. The value at 50 °C does not continue the earlier pattern. Write one hypothesis that could explain this result.
Graphing Biology Data • Day 2 Page 1 of 2
Graphing Biology Data
Day 2 • Application & Audit
Student Handout
Second stimulus Pollinator visits
Students counted pollinator visits to three flower colors during the same 15-minute period.
Data table:
Yellow: 18 visits Purple: 27 visits 11 visits