Lizard Clash Slides ACT Science • Day 1 Passage I • Data Representation
Target Time: 5.5 Minutes
Lizard Habitat Clash: Deciphering Tables & Graphs
Master multi-variable biological data. Learn how to correlate species competition across three distinct habitats with zero wasted reading time.
Data Types
3 Data Tables + 1 Scatter Plot with dual species markers
Key Skill
Connecting Table 1 conditions (X, Y, Z) to Figures 1 & 2
ACT Trap
Assuming N.A. means zero instead of unmeasured/absent
Passage I • Questions 1–5 Pacing: ~65 seconds per question
Passage I Data Blueprint
3 Tables • 1 Figure
Habitat Conditions (Table 1)
Independent Variable
Habitat X: Green anoles only (isolated)Habitat Y: Green AND Brown anoles (co-existing)Habitat Z: Brown anoles only (isolated)
Key Discovery: Green anoles perch significantly higher (1.6 m vs 0.9 m) when brown anoles are present in Habitat Y!
Behavioral Shifts (Tables 2 & 3)
Dependent Variables
Green Anoles: Display Behaviors 1–3 only. Behavior 3 drops from 24 (X) down to 13 (Y).
Brown Anoles: Display Behavior 4 only. Drops from 17 (Z) down to 5 (Y).
Behavior 5 (Time): Brown anoles display longer (49.6s in Y, 33.1s in Z) than Green anoles (~23s).
Strategic Rule: Never infer biology facts outside text unless asked about prior knowledge (e.g. Q5: reptiles are ectotherms). Step 1: Check Labels • Step 2: Track Axis
Passage I Question Attack Protocol
5 Questions • 5 Strategies
Q1: Behavior 2 Ratio (Hab X vs Hab Y)
Table 2 Direct Lookup
Hab X = 3, Hab Y = 6 → Ratio is 3:6 which simplifies to 1:2 (Choice A) .
Q2: Same in Habitats Y and Z for Brown Anoles?
Cross-Table Compare
Perching height is 0.6 m in both Y and Z (Fig 1). Behaviors 4 & 5 differ. Answer: 1 only (Choice F) .
Q3: How many times measured for Behavior 5 in Z?
Data Limitation Trap
Table 3 gives the average display time (33.1s), but NOT the sample count! Cannot be determined (Choice D) .
Q5: Scientific Knowledge (Endotherm vs Ectotherm)
Prior Knowledge
Anoles are reptiles that absorb heat from the surrounding environment (ectotherms), so they are NOT endotherms (Choice D) .
Now complete your Day 1 Daily Card Keep moving: aim for under 5 minutes 30 seconds!
Lizard Clash Daily Card Day 1 • Passage I
ACT SCIENCE DAILY CARD
Target Time: 5:30 Actual Time: Score: ___ / 5
Student Name:
Date:
Topic: Data Representation (Anoles)
Data Brief & Variables Edwards & Lailvaux (2012)
Table 1: Habitats
X: Green only | Y: Green + Brown | Z: Brown only
Figure 1: Perch Height (m)
Green: X ≈ 0.9m, Y ≈ 1.6m
Tables 2 & 3: Displays
Beh 2: X=3, Y=6 | Beh 4: Y=5, Z=17
1. Based on Table 2, which ratio best represents the number of times Behavior 2 was displayed in Habitat X compared to Habitat Y?
A 1:2 B 1:8 C 4:5 D 5:6
2. Which of the following observations for brown anoles was(were) the same in both Habitats Y and Z?
1. Average perching height | 2. Behavior 4 displays | 3. Behavior 5 average display time
F 1 only G 3 only H 1 and 2 only J 2 and 3 only
3. Based on Table 3, how many display times were measured for Behavior 5 in Habitat Z?
A 2 B 4 C 12 D Cannot be determined
4. Based on Figure 1, for green anoles, the difference in average perching height between Habitat X and Habitat Y was closest to:
F 0.0 m G 0.3 m H 0.7 m J 1.0 m
5. A student claimed that anoles are endotherms. Which explains why this claim is incorrect? Anoles are:
A amphibians and primarily generate heat from internal metabolic processes. B amphibians and primarily absorb heat from the surrounding environment. C reptiles and primarily generate heat from internal metabolic processes. D reptiles and primarily absorb heat from surrounding environment.
Daily Strategy Reflection & Reasoning
Why Q3 is a classic ACT trap:
One takeaway on reading dual-axis / multi-table questions:
Iceberg Debate Slides ACT Science • Day 2 Passage II • Conflicting Viewpoints
Target Time: 6.5 Minutes
Iceberg Calving: Decoding 4 Student Viewpoints
Conflicting Viewpoints has no tables! It is pure reading comprehension of scientific hypotheses. Master the compare-and-contrast matrix across Students 1, 2, 3, and 4.
Structure
4 Students explaining what triggers icebergs to calve (break off)
Focus Point
Where melting occurs: surface (air) vs. basal cavity (ocean water)
Time Horizon
Days vs. several summer/winter cycles vs. 50 m loss
Passage II • Questions 6–11 (6 Questions) Pacing: ~65 seconds per question
The 4-Student Comparison Grid
Synthesize Before Answering
Student 1 (Air / Multi-Year)
Surface Only
Warm summer air melts surface ice; meltwater pools and fractures downward over many summers .
Student 2 (Summer + Winter)
Surface + Snow
Summer melt creates fractures; winter snow accumulates in fractures and forces calving within a few days .
Student 3 (Ocean Only)
Basal Cavity
Melts only from below via ocean currents in basal cavity (10m per 0.1°C). Calves when reduced by ≥50 m.
Student 4 (Dual Action)
Compaction + Ocean
Winter snow + summer compaction pushes ice down into basal cavity; becomes top-heavy over several cycles .
Key Diagram Note: Basal cavity is the empty/water region underneath the floating ice shelf (Diagram H/J in Q6). Rule: Ice floats because ice density < water density!
Passage II Attack Strategy
Fast-Find Method
Q7: Counterfactual Temperature Test (-10°C)
Logic & Science Fact
Student 1 requires air warming to melt ice. At -10°C, ice cannot melt at 1 atm. Thus, No, ice cannot melt (Choice C) .
Q8: Float vs. Sink (Density Physics)
Foundational Knowledge
Passage states ice shelves are "floating... sheets of ice". Calved icebergs float because they are less dense than ocean water (Choice J) .
Q9: More than one year implied?
Keyword Match
Student 1: "over many summers" (>1 yr). Student 4: "several winter-summer cycles" (>1 yr). Both! (Choice C) .
Q11: Who agrees with Student 1 that surface melting occurs?
Iceberg Debate Daily Card Day 2 • Passage II
ACT SCIENCE DAILY CARD
Target Time: 6:00 Actual Time: Score: ___ / 6
Student Name:
Date:
Topic: Conflicting Viewpoints (Iceberg Calving)
Four Student Models Summary
Student 1: Air warms → surface melts → fractures deepen over many summers .
Student 2: Summer fractures + winter snow accumulation → calvings within a few days .
Student 3: Melts only from below in basal cavity by currents (≥50 m loss → calving).
Student 4: Basal melt + winter snow & summer compaction → top-heavy over several cycles .
6. Which diagram best shows the location of the basal cavity as described by Student 3?
F Above ice shelf G Inside the land H Under shelf (above ocean) J Between land & shelf
7. Suppose air temp is never warmer than -10°C at 1.0 atm. Does this support Student 1's description?
A Yes; ice cannot melt at those temps. B Yes; ice can melt at those temps. C No; ice cannot melt at those temps. D No; ice can melt at those temps.
8. Based on the description of icebergs calved along Antarctica, do the icebergs sink or float?
F Sink; they are more dense than ocean water. G Sink; they are less dense than ocean water. H Float; they are more dense than ocean water. J Float; they are less dense than ocean water.
9. Which of Students 1 and 4 implied calving takes >1 year?
A Student 1 only B Student 4 only C Both 1 and 4 D Neither 1 nor 4
10. In seasons involved, how does Student 2 differ from Student 3?
F 2: sum+win; 3: sum G 2: sum+win; 3: win H 2: sum; 3: sum+win J 2: win; 3: sum
11. Which of Students 2, 3, and 4 agree(s) with Student 1 that some form of melting occurs on the ice shelf surface?
A Student 2 only B Students 2 & 3 only C Students 2 & 4 only D Students 3 & 4 only
Conflicting Viewpoints Protocol Reflection
How did you track key agreements/disagreements?
Outside knowledge used in Q7 & Q8:
Clownfish Growth Slides ACT Science • Day 3 Passage III • Research Summaries
Target Time: 5.5 Minutes
Clownfish Growth: Experimental Design & Variables
Master two-experiment setups. Learn to spot independent vs. dependent variables, constants, and the subtle arithmetic hidden in procedural text.
Experiment 1
Varying Diets (Q–T) while keeping stocking density constant (1 fish/L)
Experiment 2
Varying Density (0.5 to 3 fish/L) while keeping Diet constant (Diet T)
Embedded Math
Fish per tank = volume (10 L) × density (1 fish/L) = 10 fish
Passage III • Questions 12–17 Pacing: ~55 seconds per question
Clownfish Data & Core Relationships
Specific Growth Rate (SGR)
Exp 1: Diet vs. Growth Rate
Diet S: 0.50 %/day (Highest) 41.1% protein
Diet R: 0.40 %/day 48.0% protein
Diet T: 0.35 %/day 38.1% protein
Diet Q: 0.30 %/day (Lowest) 52.5% protein
Notice: More protein ≠ more growth! Diet Q has highest protein (52.5%) but lowest SGR (0.30).
Exp 2: Density vs. Growth Rate
0.5 fish/L: 0.50 %/day Highest rate
1.0 fish/L: 0.35 %/day Control match
2.0 fish/L: 0.25 %/day Crowded
3.0 fish/L: 0.20 %/day Lowest rate
Inverse Trend: As stocking density increases, average SGR decreased only (Q12).
Experiment Variable Rule: Independent = what scientist alters. Dependent = what is measured. Q17 Dependent = SGR
Passage III Traps & Solution Steps
Fast Calculation Protocols
Q14: Cross-Experiment Hypothetical (Diet R in Exp 2)
Comparison
In Exp 1, Diet R had SGR of 0.40, while Diet T had 0.35. Diet R is 0.05 greater than Diet T → Higher; 0.05 percent/day greater (Choice H) .
Q15: Daily Food Mass Arithmetic
Text Detail
Text states: "fed... 3 times daily." If 1 g is added at each feeding → 1 g × 3 feedings = 3 g per day (Choice B) .
Q16: Number of Fish per Tank
Unit Conversion
Each tank has 10 L of seawater; density is 1 fish/L. 10 L × 1 fish/L = 10 fish (Choice H) . (Don't confuse with 12 tanks or 15 L max capacity!)
Clownfish Growth Daily Card Day 3 • Passage III
ACT SCIENCE DAILY CARD
Target Time: 5:45 Actual Time: Score: ___ / 6
Student Name:
Date:
Topic: Research Summaries (Clownfish Growth)
Key Experimental Setup 12 tanks (15 L capacity, 10 L water), 27°C, pH 8.2
Exp 1 (Diets, 1 fish/L):
Q: 0.30 | R: 0.40 | S: 0.50 | T: 0.35
Fed same mass 3x daily for 4 mo.
Exp 2 (Density, Diet T):
0.5 f/L: 0.50 | 1.0 f/L: 0.35
2.0 f/L: 0.25 | 3.0 f/L: 0.20
Diet Protein %:
Q: 52.5% | R: 48.0%
S: 41.1% | T: 38.1%
12. Consistent with Exp 2, as the number of A. percula per tank increased, average SGR:
F increased only G decreased only H remained same J varied no trend
13. Which statement about percent protein and average SGR is consistent with Exp 1? The diet that resulted in the:
A highest SGR had highest % protein B highest SGR had lowest % protein C lowest SGR had highest % protein D lowest SGR had lowest % protein
14. If Exp 2 were repeated with all fish fed Diet R instead of Diet T, average SGRs would more likely have been:
F Lower; 0.05 %/day less than Diet T G Lower; 0.10 %/day less than Diet T H Higher; 0.05 %/day greater than Diet T J Higher; 0.10 %/day greater than Diet T
15. If 1 g food added at each feeding, how many grams placed in a tank each day?
A 1 g B 3 g C 12 g D 36 g
16. How many A. percula placed in each tank in Experiment 1?
F 1 G 4 H 10 J 12
17. Which of the following was a dependent variable in Experiment 1?
A Volume of seawater B Specific growth rate C Diet fed to fish J Stocking density
Experimental Variables Reflection
How did you spot the answer to Q16 (10 fish)?
Key difference between Exp 1 & Exp 2 controls:
Tomato Heat Slides ACT Science • Day 4 Passage IV • Research Summaries
Target Time: 5.5 Minutes
Tomato Nutrient Heat: Opposing Chemical Trends
Observe how heating affects two distinct nutrients in opposite ways. Master experimental controls, chronological procedure tracking, and basic boiling point physics.
Incubation Times
Samples 1–4 heated at 88°C for 0, 2, 15, and 30 minutes
Opposing Trends
Vitamin C declines steadily, while Lycopene surges significantly
Control Group
Sample 1 (0 min) acts as the unheated baseline control
Passage IV • Questions 18–23 Pacing: ~55 seconds per question
Nutrient Contrast: Figure 1 vs. Figure 2
Opposite Trajectories
Exp 1: Vitamin C (μmol/g)
Thermal degradation of water-soluble vitamin:
Sample 1 (0 min): ~0.76 Highest
Sample 2 (2 min): ~0.68 Slight drop
Sample 3 (15 min): ~0.65 Continuing drop
Sample 4 (30 min): ~0.55 Lowest
Notice: All 4 samples are well below 1.0 μmol/g (Q22: 4 samples).
Exp 2: Lycopene (mg/g)
Heat releases bound antioxidant pigment:
Sample 1 (0 min): ~2.0 Baseline
Sample 2 (2 min): ~3.2 +60% surge
Sample 3 (15 min): ~5.5 Plateau
Sample 4 (30 min): ~5.5 Plateau
Interpolation: To reach 5.0–6.0 mg/g, incubation must be between 15 and 30 min (Q19: 20 min).
Science Fact Trap (Q21): Water boils at 100°C at 1 atm. 88°C is LESS than 100°C → Not boiling! Keep calm when outside knowledge appears
Passage IV Question Execution
Chronology & Generalization
Q18: Which Sample was the Control?
Experimental Design
A control lacks the experimental treatment (heating). Sample 1 received 0 min incubation → Sample 1 (Choice F) .
Q20: Does Heating Decrease Nutrients?
Claim Evaluation
Vitamin C decreases with heating, but Lycopene increases! The statement is consistent with Vitamin C only (Choice F) .
Q23: Chronological Order of Sample 2 Steps
Sequence Tracking
1st: Heated in water bath (Step 2 in prompt). 2nd: Frozen at -40°C (Step 1 in prompt). 3rd: Thawed and filtered (Step 3 in prompt). Order:
Tomato Heat Daily Card Day 4 • Passage IV
ACT SCIENCE DAILY CARD
Target Time: 5:30 Actual Time: Score: ___ / 6
Student Name:
Date:
Topic: Research Summaries (Tomato Processing)
Experimental Protocol Summary Dewanto et al. (2002)
Table 1: 88°C Times
Sample 1: 0 min (unheated)
Sample 2: 2 min | 3: 15 min | 4: 30 min
Fig 1: Vitamin C (μmol/g)
S1: ~0.76 | S2: ~0.68
S3: ~0.65 | S4: ~0.55 (Decreasing)
Fig 2: Lycopene (mg/g)
S1: ~2.0 | S2: ~3.2
S3: ~5.5 | S4: ~5.5 (Increasing)
18. Which sample in Exp 1 was most likely intended as a control for vitamin C in unheated tomatoes?
F Sample 1 G Sample 2 H Sample 3 J Sample 4
19. Based on Exp 2, which incubation time would most likely have produced lycopene between 5 and 6 mg/g?
A 0 min B 0.2 min C 2 min D 20 min
20. A student claimed heating tomatoes decreases nutrients present. This claim is consistent with results for:
F Vitamin C only G Lycopene only H Both C and lycopene J Neither nutrient
21. Assuming water bath contained pure water at 1 atm, was the water in the bath most likely boiling?
A Yes; incubation temp was < boiling pt at 1 atm. B Yes; incubation temp was > boiling pt at 1 atm. C No; incubation temp was < boiling pt at 1 atm. D No; incubation temp was > boiling pt at 1 atm.
22. In Exp 1, how many samples had vitamin C < 1.0 μmol/g?
F 0 G 1 H 3 J 4
23. Procedure order: 1-Frozen, 2-Incubated, 3-Filtered.
A 1, 2, 3 B 1, 3, 2 C 2, 1, 3 D 2, 3, 1
Scientific Method Reflection
Why did Sample 1 serve as the control group?
Outside science fact tested in Q21 (boiling point):
Alloy Forge Slides ACT Science • Day 5 Passage V • Data Representation
Target Time: 5.5 Minutes
Molten Alloy Forge: Linearity & Extrapolation
Tackle complex physics/materials science curves. Learn how to locate linear graph segments, extrapolate intersecting trends, and execute rapid percent-by-mass math.
Dual Curves
Initial temps: 280°C (solid line) vs. 550°C (dashed line)
Extrapolation
Predicting where converging curves meet beyond the plotted axis
Mass Percent
Table 1 percentages applied to 50 g and 200 g alloy samples
Passage V • Questions 24–28 Pacing: ~65 seconds per question
Figure 1 Dynamics & Composition Breakdown
Alloy Q Properties
Figure 1: Stirring Force (F) vs. Crystal Length (L)
280°C (Solid): Starts at 97 μm → peaks at 101.5 at F=4 → steadily drops to 95.5 at F=48.550°C (Dashed): Dips to 90 at F=3 → peaks at 92.5 at F=12 → straight line drop from 10 to 20 → dips to 90.7 at F=28 → rises to 92.5 at F=48.Overall: 550°C produces significantly smaller crystals (89–93 μm) than 280°C (95–102 μm).
Table 1 Composition & Arithmetic
Aluminum (Al): 88.7% Majority
Silicon (Si): 10.8% 50 g × 10.8% = 5.4 g (Q27)
Manganese (Mn): 0.28% Minor trace
Magnesium (Mg): 0.22% 200 g × 0.22% = 0.44 g (Q28)
Fast Math Rule: Percent of a number → 50 g is half of 100 g (so half of 10.8 = 5.4 g); 200 g is 2 × 100 g (so 2 × 0.22 = 0.44 g). No calculator needed!
Passage V Question Attack Protocols
Linearity & Minimums
Q24: Identifying the Linear Region (550°C)
Graph Shape
A linear region is a straight line. Look at 550°C between F = 10 × 107 and 20 × 107: the curve descends linearly without bending → Between 10 and 20 × 107 (Choice G) .
Q25: Curve Intersection Extrapolation
Projection
From F=40 to 48, the 280° line slopes downward while 550° slopes upward. The vertical gap narrows from ~4.5 to ~3.0. Following these straight trajectories, they will intersect around F = 60 × 107 (Choice B) .
Q26: Smallest Crystal Length (L) Combination
Direct Comparison
Compare options: at 550°C and F = 40 × 107, L is ~91.5 μm (lower than 280°C values which exceed 95 μm). Smallest is
Alloy Forge Daily Card Day 5 • Passage V
ACT SCIENCE DAILY CARD
Target Time: 5:15 Actual Time: Score: ___ / 5
Student Name:
Date:
Topic: Data Representation (Alloy Crystallization)
Data Reference (Alloy Q) Denisov et al. (2014)
Table 1: Alloy Q Composition (% by mass)
Al: 88.7% | Si: 10.8% | Mn: 0.28% | Mg: 0.22%
Figure 1: Crystal Length L (μm) vs. F (× 107)
280°C (solid): peaks at 101.5 (F=4), descends to 95.5 (F=48)
550°C (dashed): linear drop 10–20, lowest around F=40 (~91.5)
24. A linear region can be approximated with a straight line. Based on Fig 1, for 550°C, which range of F best represents a linear region?
F 0 to 10 × 107 G 10 to 20 × 107 H 20 to 30 × 107 J 30 to 40 × 107
25. If the 2 trends from F = 40 to 48 continue along the same trend, at which value of F would average crystal lengths most likely be the same?
A F = 50 × 107 B F = 60 × 107 C F = 70 × 107 D F = 80 × 107
26. Which combination of initial temp and F would produce the shortest average crystal length (smallest L) in an ingot of Alloy Q?
F 280°C and F = 10 × 107 G 280°C and F = 40 × 107 H 550°C and F = 10 × 107 J 550°C and F = 40 × 107
27. 50 g samples of 4 alloys: W(0.11g), X(0.14g), Y(2.7g), Z(5.4g Si). Which is Alloy Q?
A W B X C Y D Z
28. If an ingot of Alloy Q had a mass of 200 g, that ingot would contain what mass of Mg?
F 0.22 g G 0.44 g H 2.2 g J 4.4 g
Quantitative Science Reflection
Mental math calculation for Q27 (Si mass in 50g):
How did you project the intersection point in Q25?
Forest Leachate Slides ACT Science • Day 6 Passage VI • Research Summaries
Target Time: 5.5 Minutes
Clay Forest Leachate: Multi-Study Bar Graphs
Navigate three parallel studies testing 5 leaf species against 3 clay minerals (CM1, CM2, CM3). Master vocabulary distinctions between dissolved solutions and suspended particles.
5 Leaf Types
Maple, Oak, Pine, Magnolia, Rhododendron
3 Clay Minerals
Study 1 (CM1), Study 2 (CM2), Study 3 (CM3)
Solution vs Suspended
Clay particles are suspended and filtered out → NOT a solution!
Passage VI • Questions 29–34 Pacing: ~55 seconds per question
DOC Adsorption Across Studies 1–3
% Leachate DOC Adsorbed
Study 1 (CM1)
Pine: 44% (Peak)
Magnolia: 37%
Oak: 31%
Rhododendron: 28%
Maple: 23%
Max = Pine
Study 2 (CM2)
Magnolia: 35% (Peak)
Rhododendron: 27%
Oak: 23%
Maple: 7%
Pine: 0%
Max = Magnolia
Study 3 (CM3)
Magnolia: 55% (Peak)
Oak: 50% (Exact!)
Rhododendron: 36%
Maple: 35%
Pine: 32%
Max = Magnolia
Oak Trap Alert (Q32): In CM3, Oak is exactly 50%. The question asks for more than 50%! Answer: None! Strict boundary reading
Passage VI Trap Defenses
Vocabulary & Procedural Logic
Q30: Rapid Mean Estimation (CM3)
Estimation
Values are 35, 50, 32, 55, 36. Three values are in the 30s, two in the 50s. Average is ~41.6% → closest to 40% (Choice J) .
Q33: Is Clay + Leachate a Solution?
Scientific Definition
A solution has homogeneous dissolved particles. Clay minerals are suspended solid particles that get filtered out → No, because clay mineral particles are not dissolved (Choice D) .
Q34: Action Taken to Prevent Light Degradation
Text Detail
Visible light causes DOC breakdown. Passage: "placed in the dark for 10 weeks" → Each mixture of leaves and filtered lake water was placed in the dark (Choice F) .
Now complete your Day 6 Daily Card Watch for strict inequalities like 'more than 50%'!
Forest Leachate Daily Card Day 6 • Passage VI
ACT SCIENCE DAILY CARD
Target Time: 5:45 Actual Time: Score: ___ / 6
Student Name:
Date:
Topic: Research Summaries (DOC Adsorption)
Data Matrix: % Leachate DOC Adsorbed Tietjen et al. (2005)
Study 1 (CM1):
Maple: 23% | Oak: 31% | Pine: 44%
Magnolia: 37% | Rhodo: 28%
Study 2 (CM2):
Maple: 7% | Oak: 23% | Pine: 0%
Magnolia: 35% | Rhodo: 27%
Study 3 (CM3):
Maple: 35% | Oak: 50% | Pine: 32%
Magnolia: 55% | Rhodo: 36%
29. From which of the 5 leachates was the greatest percent of DOC adsorbed by CM1, CM2, and CM3, respectively?
A CM1: maple; CM2: maple; CM3: rhododendron B CM1: oak; CM2: pine; CM3: magnolia C CM1: pine; CM2: magnolia; CM3: rhododendron D CM1: pine; CM2: magnolia; CM3: magnolia
30. In Study 3, % DOC adsorbed by CM3 averaged across 5 leaves is closest to:
F 10% G 20% H 30% J 40%
31. Is "CM2 adsorbed greater % in maple than CM3" supported?
A Yes; 35% vs 7% B Yes; 55% vs 17% C No; 7% vs 35% D No; 17% vs 55%
32. Which of the 3 clay minerals, if any, reduced the DOC in oak leachate by more than 50%?
F CM1 only G CM2 only H CM1 and CM3 J None of 3
33. Is clay mineral + leachate properly considered a solution?
A Yes; particles dissolved B Yes; particles not dissolved C No; particles dissolved D No; particles not dissolved
34. What action prevented DOC breakdown by visible light?
F Leaves+water in dark G Filtrate+clay in dark H Leaves+water filtered J Leachate+clay filtered
Adsorption & Solutions Reflection
Why is oak in Study 3 NOT >50%? (Q32):
Scientific distinction between solution and suspension:
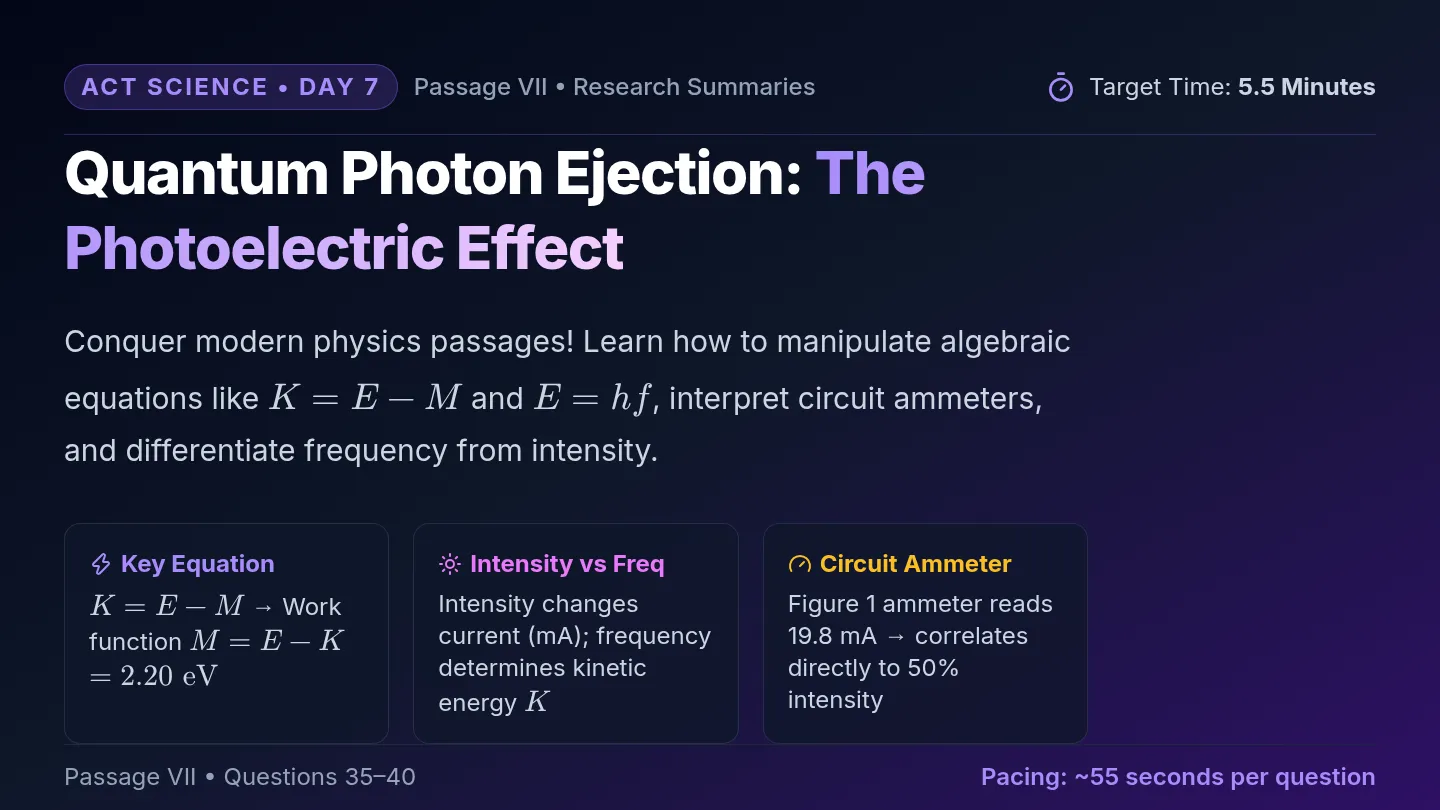
Photon Ejection Slides ACT Science • Day 7 Passage VII • Research Summaries
Target Time: 5.5 Minutes
Quantum Photon Ejection: The Photoelectric Effect
Conquer modern physics passages! Learn how to manipulate algebraic equations like \( K = E - M \) and \( E = hf \), interpret circuit ammeters, and differentiate frequency from intensity.
Key Equation
\( K = E - M \) → Work function \( M = E - K = 2.20\text{ eV} \)
Intensity vs Freq
Intensity changes current (mA); frequency determines kinetic energy \( K \)
Circuit Ammeter
Figure 1 ammeter reads 19.8 mA → correlates directly to 50% intensity
Passage VII • Questions 35–40 Pacing: ~55 seconds per question
Photoelectric Core Data & Work Function
Table 1 & Table 2
Table 1: Frequency & Electron Ejection
Red (\(4.4 \times 10^{14}\) Hz, \(E=1.81\)): No Ejection
Yellow (\(5.2 \times 10^{14}\) Hz, \(E=2.14\)): No Ejection
Green (\(5.6 \times 10^{14}\) Hz, \(E=2.31\)): \(K = 0.11\text{ eV}\)
Blue (\(6.3 \times 10^{14}\) Hz, \(E=2.60\)): \(K = 0.40\text{ eV}\)
Violet (\(7.5 \times 10^{14}\) Hz, \(E=3.10\)): \(K = 0.90\text{ eV}\)
Cutoff Frequency: Between Yellow (\(5.2 \times 10^{14}\)) and Green (\(5.6 \times 10^{14}\)) because Green ejections start! (Q39)
Table 2: Intensity vs. Current
Light intensity changes number of photons per second, NOT individual photon energy:
100% Intensity: Current: 40.0 mA | \(K=0.90\)
50% Intensity: Current: 19.8 mA | \(K=0.90\)
25% Intensity: Current: 9.8 mA | \(K=0.90\)
12.5% Intensity: Current: 4.8 mA | \(K=0.90\)
Notice: Kinetic energy \(K\) stays exactly 0.90 eV across all intensities!
Formula Rearranging (Q40): \(E = hf \implies h = \frac{E}{f} = \frac{2.31\text{ eV}}{5.6 \times 10^{14}\text{ Hz}}\) Isolate the variable cleanly
Passage VII Solution Pathways
Precision Physics
Q36: What was constant in Exp 2 but NOT in Exp 1?
Control Check
Exp 1 swapped filters of different colors. Exp 2 used no filter (same light beam) → Color of light (Choice F) was held constant in Exp 2.
Q37: Particle Charge & Direction
Diagram & Concept
Figure 1 shows arrows moving from the metal plate toward the electrode. The particles are ejected electrons (negative charge) →
Photon Ejection Daily Card Day 7 • Passage VII
ACT SCIENCE DAILY CARD
Target Time: 5:45 Actual Time: Score: ___ / 6
Student Name:
Date:
Topic: Research Summaries (Photoelectric Effect)
Physics Principles & Data Setup \( K = E - M \) | \( E = hf \)
Table 1: Filters (Exp 1)
Red: 4.4, E=1.81, K=N.A. | Yellow: 5.2, E=2.14, K=N.A.
Green: 5.6, E=2.31, K=0.11 | Blue: 6.3, K=0.40 | Violet: 7.5, K=0.90
Table 2: Intensity (Exp 2)
100%: 40.0 mA, K=0.90 | 50%: 19.8 mA, K=0.90
25%: 9.8 mA, K=0.90 | 12.5%: 4.8 mA, K=0.90
Figure 1 Schematic:
Light strikes metal plate → electrons ejected toward electrode.
Ammeter reads 19.8 mA.
35. Ammeter in Fig 1 shows 19.8 mA. Based on Exp 2, what was the relative light intensity?
A 100% B 50% C 25% D 12.5%
36. What was held constant in Exp 2 but not in Exp 1?
F Color of light G Light source H Type of metal J Plate distance
37. In Fig 1, are ejected particles moving toward/away from electrode, and are they positively/negatively charged?
A Toward; positively charged B Toward; negatively charged C Away from; positively charged D Away from; negatively charged
38. Based on equation and Exp 1, what was value of M for metal plate?
F 2.14 eV G 2.20 eV H 2.31 eV J 2.42 eV
39. The cutoff frequency for the metal plate was:
A < 4.4 × 10¹⁴ Hz B 4.4 to 5.2 × 10¹⁴ C 5.2 to 5.6 × 10¹⁴ D > 5.6 × 10¹⁴ Hz
40. \( E = hf \). Based on data for green light in Table 1, which expression determines Planck's constant \( h \)?
F \( \frac{5.6 \times 10^{14}\text{ Hz}}{0.11\text{ eV}} \) G \( \frac{0.11\text{ eV}}{5.6 \times 10^{14}\text{ Hz}} \) H \( \frac{5.6 \times 10^{14}\text{ Hz}}{2.31\text{ eV}} \) J \( \frac{2.31\text{ eV}}{5.6 \times 10^{14}\text{ Hz}} \)
Photoelectric Reflection & Full Test Review
How was work function M determined in Q38?
7-Day Sprint Key Takeaway & Pacing Target: