Raz-Plus Evaluation Slides
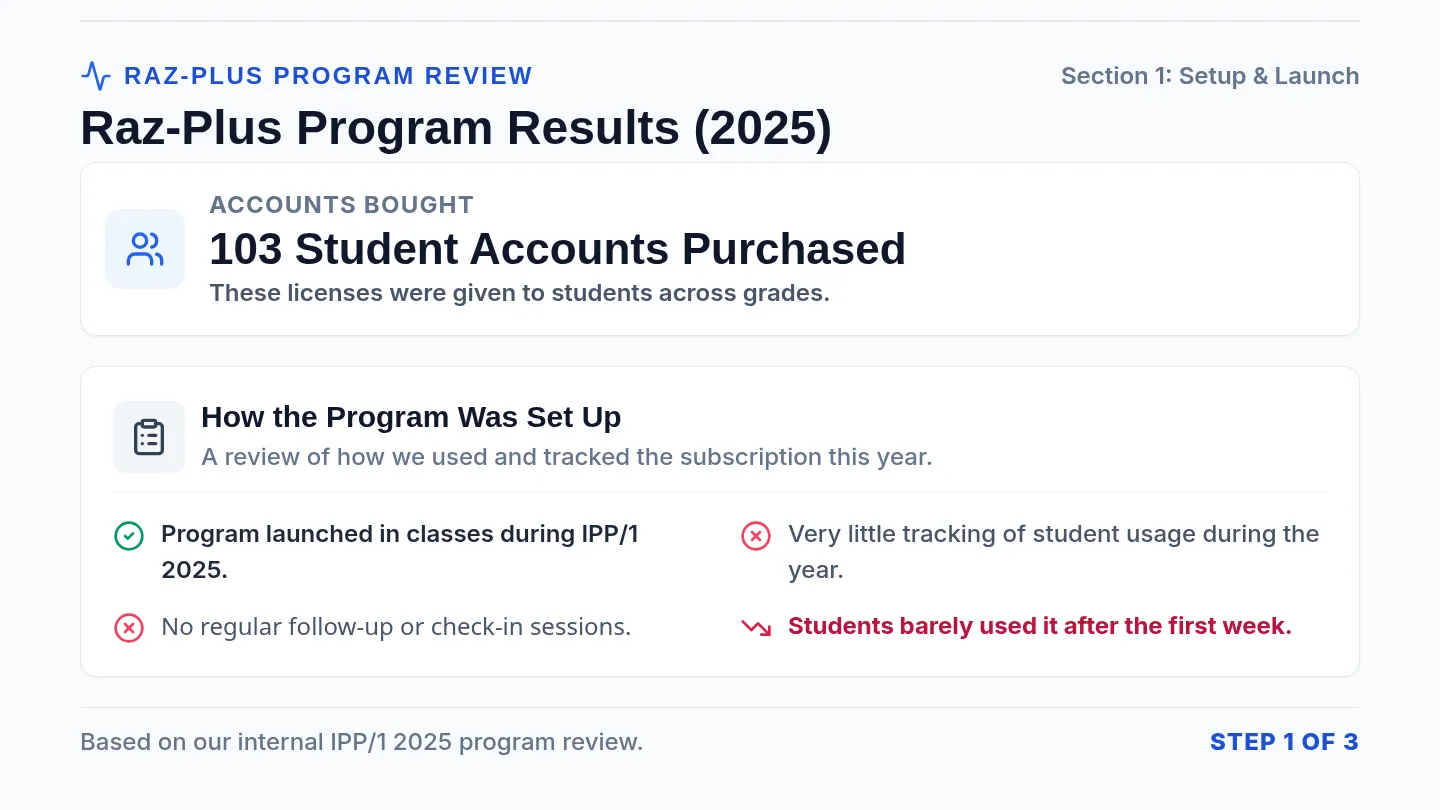
Raz-Plus Program Review Section 1: Setup & Launch
Raz-Plus Program Results (2025)
Accounts Bought
103 Student Accounts Purchased
These licenses were given to students across grades.
How the Program Was Set Up
A review of how we used and tracked the subscription this year.
Program launched in classes during IPP/1 2025.
No regular follow-up or check-in sessions.
Very little tracking of student usage during the year.
Students barely used it after the first week.
Based on our internal IPP/1 2025 program review. Step 1 of 3
Stop Subscription Plan Section 2: Feedback & Plan
Why We Should Stop This Subscription
59 students took the survey.
43 students (73%) wanted to try it at first.
What Students Liked
- • 72.8% say it is easy to use.
- • 56.0% like the books.
What Did Not Work
- • 61.0% barely used it: Less than once a week.
- • 25.4% found it boring: Books too long or dry.
- • 20.3% do not want to continue: Want to stop.
How Usage Dropped
103 Accounts
Bought
43 Students
Interested
61% Rarely
Used It
Low Value
For Money
What We Learned
Students stopped using it because we did not track them.
Students spent very little time on it (71% under 20 minutes).
What We Should Do
Stop the subscription when it ends.
Spend the money on a program with better tracking.
This plan is ready for review. Step 2 of 3
Survey Results Section 3: Detailed Survey Data
All Survey Results
1. How often do you use it in a week? 61.0% Rarely (36)
2. How long do you use it each time? 71.2% < 20 min (42)
3. Is it easy to use? 72.8% Easy/Very Easy (43)
4. Are the books interesting? 56.0% Interesting (33)
5. Do levels match reading ability? 64.5% Matches/Mostly (38)
6. Does it help your reading skills? 74.5% Yes (44)
7. Did it help you build a reading habit? 64.4% Yes/A little (38)
8. What feature do you like most? 35.6% Reading books (21)
9. What did you dislike most? 25.4% Boring (15)
10. Do you want to keep using it? 20.3% No (12 students)
Summary: Students found the program easy to use, but we did not monitor them. This led to 61% using it rarely, meaning we did not get good value for our money.
Full survey details are in Appendix A. Step 3 of 3