A comprehensive 5-lesson introductory science sequence for 6th and 7th graders that transitions students from thinking like scientific detectives to building like innovative engineers. Students explore the branches of science, master scientific inquiry, manipulate variables in experiment design, organize data with visual representations, and navigate the engineering design process using real-world scenarios.
Topic: Lab Observations and Evidence Collection Log
NAME: ___________________________
DATE: ____________________ PERIOD: _____
A STATION A: Observation Classification
1. Rotten egg odor: [ QL / QN ]
2. Time is 14.5 seconds: [ QL / QN ]
3. Temperature is 37.8°C: [ QL / QN ]
4. Shiny bronze color: [ QL / QN ]
B STATION B: Model Identification
1. Plastic DNA replica: [ PH / CO / MA ]
2. Equation \( y = mx + b \): [ PH / CO / MA ]
3. Hurricane track simulator: [ PH / CO / MA ]
4. Diorama of Grand Canyon: [ PH / CO / MA ]
C STATION C: Scientific Law vs Theory
1. Objects fall to Earth due to gravity: [ THEORY / LAW ]
2. Species adapt via natural selection: [ THEORY / LAW ]
3. Energy is conserved: [ THEORY / LAW ]
Reflect: In your own words, why can a scientific theory *never* grow up to become a scientific law?
D STATION D: Drawing Dinosaur Inferences
Review the fossil evidence from Station D. Draft a logical scientific inference explaining what occurred at the site, distinguishing your raw observations from your inferred conclusion.
UNIT 1: INTRODUCTION TO SCIENTIFIC THINKING PAGE 2 OF 2
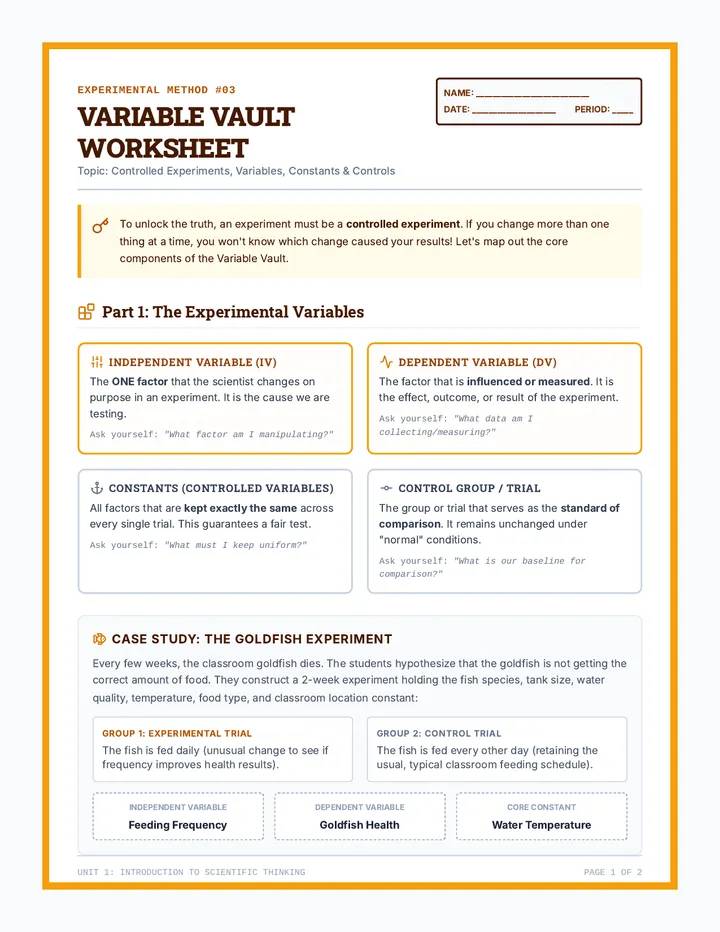
Plant 1: Given 5 mL of liquid fertilizer every single morning.
Plant 2: Given 5 mL of liquid fertilizer once a week on Monday morning.
Plant 3: Kept in standard soil and receives no fertilizer at all.
To keep things fair, Bob waters each plant with exactly 50 mL of water once a day, sets them side-by-side on his bedroom windowsill to receive equal sunlight, and keeps his bedroom temperature at 21 degrees Celsius. He measures plant height once a week.
1. Independent Variable (What Bob Changes):
2. Dependent Variable (What Bob Measures):
3. Control Group (Which Plant & Why?):
4. Constants (List Three Held Equal):
5. The Danger of Unwanted Variables:
Imagine if Bob placed Plant 1 on his window sill, but placed the Control Plant (Plant 3) inside a dark closet under his stairs. Why would this mistake ruin Bob's scientific conclusions? Explain using scientific logic.
UNIT 1: INTRODUCTION TO SCIENTIFIC THINKING PAGE 2 OF 2
25 pigeons, 15 squirrels, 5 rabbits, and 5 stray cats
Question A:
Which graph type is best to represent this counts dataset?
Question B:
Why would a line graph be inappropriate for this kind of data?
PROMPT 2: Spotting Anomalies
In a scatter plot of hours studied vs. test scores, a clear upward trend shows that students who study longer score higher. The teacher draws a line of best fit through the center of the coordinate points.
Observations: Eva studied for 3 hours and scored a 90. Becca also studied for 3 hours but scored a 70. The general trend for 3 hours of studying is a score of 80.
What is the scientific term used to describe data points like Eva or Becca?
In your own words, what does a "Line of Best Fit" help scientists do on a scatter plot?
PROMPT 3: Drawing Valid Conclusions
A student reviews Bob's Plant height table. Bob's fertilizer Plant 1 grew from 6 cm (Week 0) to 12 cm (Week 3). Plant 3 (no fertilizer control) grew from 6 cm (Week 0) to 7.5 cm (Week 3).
Based *only* on the numerical data, write a valid conclusion Bob can present:
UNIT 1: INTRODUCTION TO SCIENTIFIC THINKING PAGE 2 OF 2
Design Specs
The target goals the machine MUST accomplish. (e.g., Must descend 3,000m and carry sonar).
Constraints
The physical or financial limits on construction. (e.g., Must cost under $150k and resist rust).
UNIT 2: THE ROAD TO INNOVATION SLIDE 7 OF 8
The Prototype & Redesign Loop
ITERATION CYCLE
What is a Prototype?
A preliminary, simplified model of the design. Think of it as a rough draft.
If a prototype fails, troubleshoot and try again! Failure teaches us what needs fixing.