Average FC Student Slides
Computing Foundations • Data Science Day 1
Slide 1 / 19
Build the “Average FC Student”
What can data tell us about our class?
Learning Targets
- I can explain what data and a dataset are.
- I can distinguish between numerical and categorical data.
- I can use class data to describe patterns in a group.
Warm-Up Brainstorm Slide 2 / 19
If someone had never been to Franklin Central, what information could we collect to describe a typical FC student?
Daily habits & routines
Favorites & preferences
Life outside school
Turn & share 2–3 ideas with a neighbor before we share out!
Key Idea #1 Slide 3 / 19
What Is Data?
Data = information we collect so we can answer questions.
😴 6 hours of sleep
👨👩👧👦 2 siblings
🥨 prefers salty snacks
🐾 has a pet
Each individual piece of information is called a data point.
Key Idea #2 Slide 4 / 19
What Is a Dataset?
Dataset = a collection of related data.
Putting It Together
When every student answers the same survey, all of our responses together create a dataset.
Today’s Preview
Each student will contribute one set of responses to today’s class dataset.
Key Idea #3 Slide 5 / 19
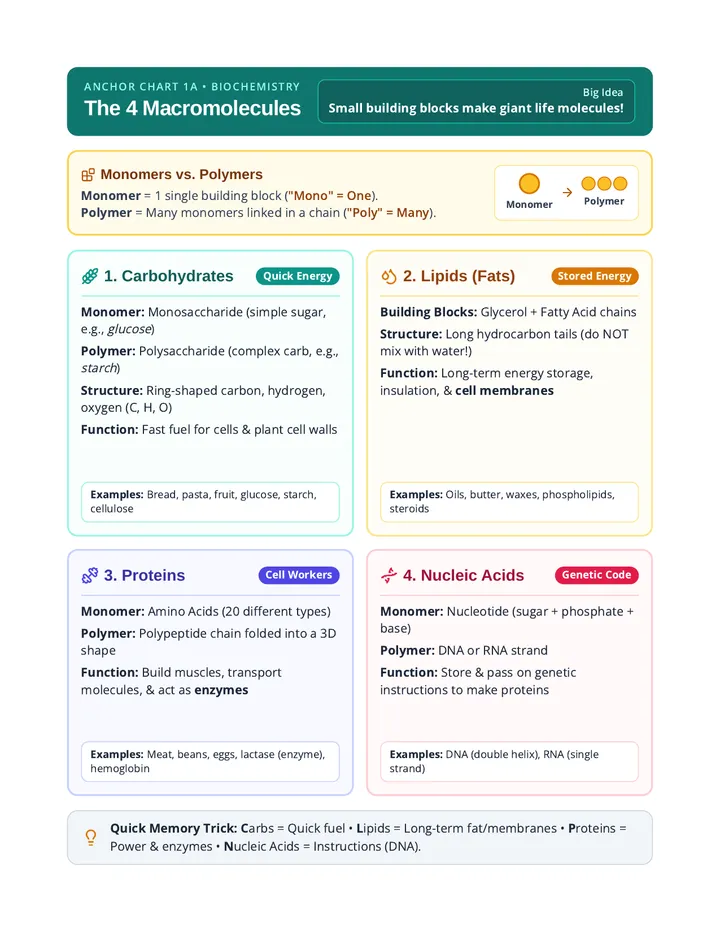
Two Kinds of Data
Numerical Data
Information expressed with numbers.
- • 7 hours of sleep
- • 15-minute commute
- • 2 siblings
Categorical Data
Information placed into groups or labels.
- • salty snacks • night owl
- • rock music • has a pet
Quick Check — Classify these: “Shoe size” • “Favorite season” • “Apps on phone” • “Eye color”
Today’s Mission Slide 6 / 19
We are going to build a fictional “Average FC Student” using data from THIS class.
01
Take a short survey
Everyone answers the same quick questions.
02
Build our dataset
All class responses combine into one real dataset.
03
Create the profile
Use our results to describe the “Average FC Student.”
Before We Start Slide 7 / 19
Survey Expectations
Answer honestly
Real answers give us real patterns.
No joke responses
Fake numbers mess up the whole class’s math.
Keep it school-appropriate
Do not include anything personally sensitive.
We’re saving this!
We will reuse this dataset after Thanksgiving.
Good analysis depends on good data.
Data Collection Slide 8 / 19
Survey Time! 📋
Open the Google Form
-
Hours of sleep last night
-
Morning person or night owl
-
Number of siblings
-
Most-listened-to music category
-
Approximate daily screen time
-
Pet (Yes / No)
-
Minutes to school
-
Preferred free-time activity
-
Sweet or salty snack preference
-
Favorite Thanksgiving food 🦃
Submit your responses once, then wait quietly for the class dataset to load.
Sort Our Survey Slide 9 / 19
What Did We Collect?
Which questions created NUMERICAL data?
Look for questions answered with numbers or counts.
Which questions created CATEGORICAL data?
Look for questions answered with groups or labels.
Let’s check all 10 survey questions together!
Dataset Structure Slide 10 / 19
Rows & Columns Preview
Each ROW = one person or response.
Each COLUMN = one variable or question.
| Response |
Sleep (hrs) |
Snack |
Music |
| Student 1 |
7 |
Salty |
Pop |
| Student 2 |
6 |
Sweet |
Hip-Hop |
| Student 3 |
8 |
Salty |
Rock |
Analyzing Numbers Slide 11 / 19
Numerical Data: What Can We Calculate?
Average
The typical center value of the group.
Minimum
The smallest value in our dataset.
Maximum
The largest value in our dataset.
Let’s Check Our Class Results:
• Average hours of sleep
• Average commute time
• Average # of siblings
Wait a Second… Slide 12 / 19
What Does “Average” Mean?
The mean (average) is found by combining all values and dividing by the number of values.
Suppose our class calculates:
Average siblings = 1.7
Does anyone actually have 1.7 siblings? 🤔
An average describes the GROUP. A summary statistic is not a literal person!
Analyzing Categories Slide 13 / 19
Categorical Data: What Can We Find?
We cannot calculate an arithmetic average of categories like music genre, sweet vs. salty, or morning person vs. night owl.
Most Common Response
Which category appeared the most times?
Category Counts
How many people chose each category?
Class Profile Slide 14 / 19
Meet the “Average FC Student” 🧑🎓
Based on our class dataset, they…
• sleep _______ hours
• are a _____________
• have _______ siblings
• listen mostly to __________
• spend _____ hrs on screens
• do / do not have a pet
• travel _____ min to school
• prefer __________ in free time
• prefer ________ snacks
• save ________ from Thanksgiving
Reality Check Slide 15 / 19
Is there probably one student in this room who matches every single part of the profile?
Probably NOT! 🤷
Why?
The profile summarizes patterns in the dataset. It is not necessarily a description of one real student.
Evaluating Claims Slide 16 / 19
What Can We Say?
Which claims seem reasonable based on our class dataset?
More Reasonable
“Most students in this class prefer salty snacks.”
“The average commute in this class is 14 minutes.”
Less Reasonable
“All teenagers prefer salty snacks.”
Hold that thought—we’ll dig into WHY tomorrow!
Class Discussion Slide 17 / 19
Look back at our finished class profile…
So… is this REALLY the “Average FC Student”?
Discuss with your table—what do you think?
Quick Vote Slide 18 / 19
How confident are you that our class data accurately represents students across Franklin Central?
1 Not confident at all
2
3
4
5 Extremely confident
Pick your number (1–5) and be ready to explain why!
Wrap-Up Slide 19 / 19
Exit Ticket 🎟️
1. Give one example of numerical data from today.
2. Give one example of categorical data.
3. What is a dataset?
4. What is one thing our class data can tell us?
5. How confident are you that our “Average FC Student” represents ALL FC students? Why?
Tomorrow: Can we trust our conclusion?