An 8th-grade science lesson introducing independent, dependent, and control variables on graphs to support cause-and-effect claims. Includes a Do Now, visual slide presentation, graphing activity, and exit ticket.
Independent Variable
Using Abbreviations: Students often abbreviate terms (IV, DV). Push them to spell out "independent variable", "dependent variable", and "control variable" to reinforce vocabulary recall.
Do Now Answer Key
Inputs: Sunlight/Energy and "nutrition from the soil through plant roots".
Outputs: Oxygen (gas released) and Sugar (glucose stored).
Variables Connection: "Keeping soil nutrition constant ensures that any growth differences we observe are caused ONLY by changes in sunlight/energy, and not because one plant received better nutrition."
Activity Worksheet Answer Key
Part 1: Graph Identification
Independent Variable: Fertilizer Added (or Amount of Fertilizer)
IV Unit of Measure: Grams (g)
Dependent Variable: Bean Plant Height
DV Unit of Measure: Centimeters (cm)
Part 2: Controls & Data
Control Variables (Any 3): Amount of water, sunlight hours, type of soil.
Data Reading: 0g fertilizer = 10 cm height; 10g fertilizer = 25 cm height.
Part 3: Cause-and-Effect Claim Exemplar
"Increasing the fertilizer amount from 0 grams (g) to 10 grams (g) caused the bean plant to grow taller. This is supported by the data, which shows plant height increased from 10 centimeters (cm) to 25 centimeters (cm), a total growth increase of 15 centimeters (cm). Keeping the water and sunlight constant ensured the fertilizer was the only cause of this growth."
Revised Exit Ticket Answer Key
1. Independent Variable:
"The independent variable is the amount of fertilizer."
2. Dependent Variable:
"The dependent variable is the height of seedlings."
3. Control Variables:
"The control variables are the amount of sunlight, the amount of water, and seedlings grown from the same seed stock."
4. Why is using seedlings from the same seed stock a necessary control variable?
"Using seedlings from the same seed stock is necessary to ensure that the seedlings are genetically identical. If they came from different seed stocks, some seedlings might grow taller naturally because of their genetics rather than the fertilizer, which would make the experiment unfair."
Unit 1: Scientific Inquiry Page 2 of 2
Question 4: Genetics Control Explanation (2 Points)
Acceptable: "Genetics control ensures that the plants have the same starting code. If we didn't use the same seed stock, one plant might grow taller naturally because of its genes, which would make it an unfair test."
Unit 1: Scientific Inquiry & Graphing Master Answer Key Page
✨ Result: You have a beautiful, ready-to-present, high-contrast digital slide show projected on-screen, without spending a single second copy-pasting into PowerPoint! Just scroll down to change slides.
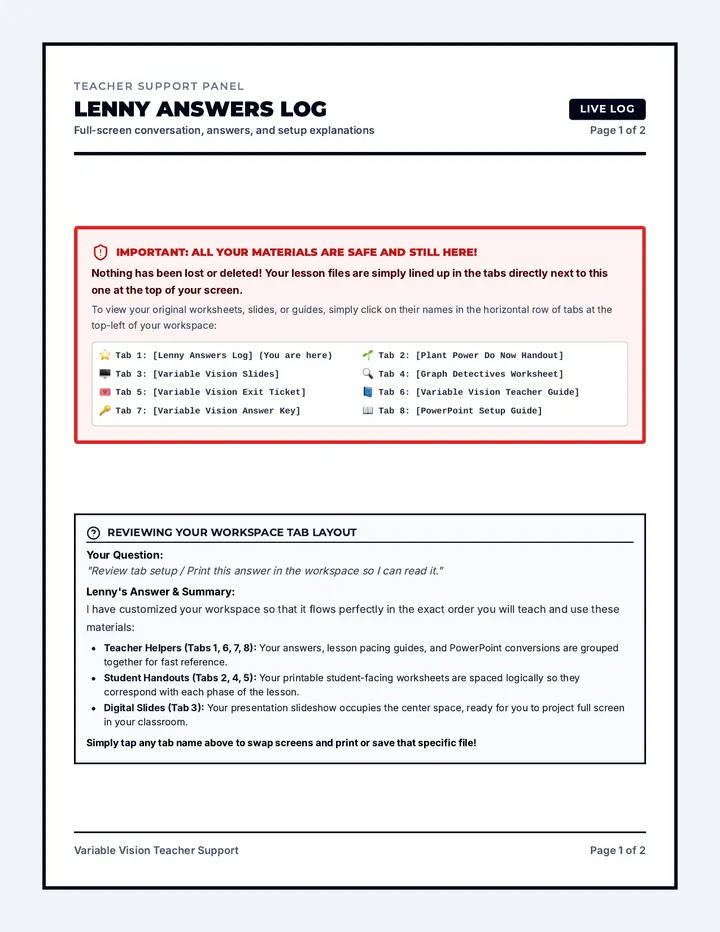
Variable Vision Teacher Support Page 1 of 2
Walkthrough Reference Sheet
Detailed Print Walkthrough
Step-by-step breakdown of how to print and save your files cleanly
Help Guide
Page 2 of 2
Do I Need to Screenshot the Slide Show too? (NO!)
No, you do not need to take screenshots of the slides! Keep your Google Doc purely as a printable 3-page packet (Do Now, Worksheet, and Exit Ticket) for students to physically write on in class.
To teach, simply project the "Variable Vision Slides" tab in this workspace directly onto your screen, set your browser to Full Screen (F11), and teach. Recreating the slides in PowerPoint or Google Slides is completely unnecessary!
How to Print and Save Handouts as PDFs:
Step 1: "Open any worksheet tab on your screen"
Look at the top panel of your workspace preview screen. Click on the tab you want to save so it appears in the center of your screen (e.g. Graph Detectives Worksheet).
Step 2: "Press Ctrl+P (Windows) or Cmd+P (Mac)"
Hold down the Control key (Ctrl) and tap the letter P on your keyboard (on Mac, hold down Command (Cmd) and tap P). This instantly opens your browser's Print box.
Step 3: "Set layout to Portrait"
In the Print panel, locate the option labeled "Layout" or "Orientation" and select Portrait (vertical orientation).
Step 4: "Check 'Background Graphics'"
Scroll down and locate the check box for "Background Graphics". You must check this box! Otherwise, your worksheets will save without drawings or graph lines.
Step 5: "And save as a PDF"
At the top of your print settings panel under "Destination", select "Save as PDF". Click the blue "Save" button, choose your desktop, and click save.
Print Troubleshooting & Tips
Why is my worksheet printing as two pages with a blank bottom? Set your print Margins to "None". Because our sheets are exact page-sized, "Default" margins squeeze the page and force a blank sheet.
Why are the drawings and graph line missing in my PDF preview? This is always because the "Background Graphics" option is unchecked. Make sure that box has a blue checkmark.
Variable Vision Teacher Support Page 2 of 2
It is NOT the arrow icon: The arrow icon is just for scrolling slides in your browser viewer.
It is the FILE Tab: In your file explorer menu, there is a tab titled **"Variable Vision Slides"**. Click that button/title to load the slides presentation into your preview viewer.
How to print: Once you see Slide 1 on your screen, simply press **Cmd + P** on your Mac's keyboard. The slide file is coded so that printing once will automatically capture all 9 slides together and save them into a single horizontal PDF presentation!
Widescreen PDF Saving Guide
While viewing the loaded slides, press Cmd + P. Apply these print settings:
Destination: Save as PDF
Layout: Landscape (Horizontal)
Margins: None or Minimum
Background Graphics: CHECK THIS BOX
Click the blue "Save" button, select your Mac desktop, name it Variable_Vision_Slides.pdf, and click save.
Opening in Adobe Acrobat
Yes, absolutely! Double-click the saved file on your Mac, and it will open instantly inside Adobe Acrobat for Mac. You can preview, email, or present full-screen!