Students learn to read and create climatograms—graphs that show average monthly temperature (line) and precipitation (bar). They match mystery climatograms to specific biomes or cities.
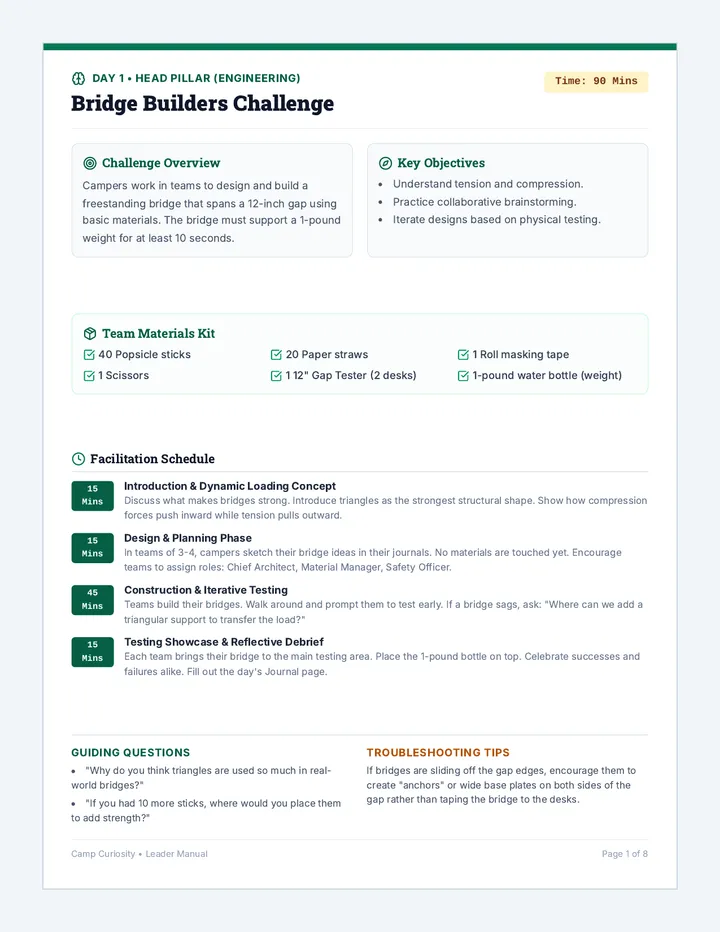
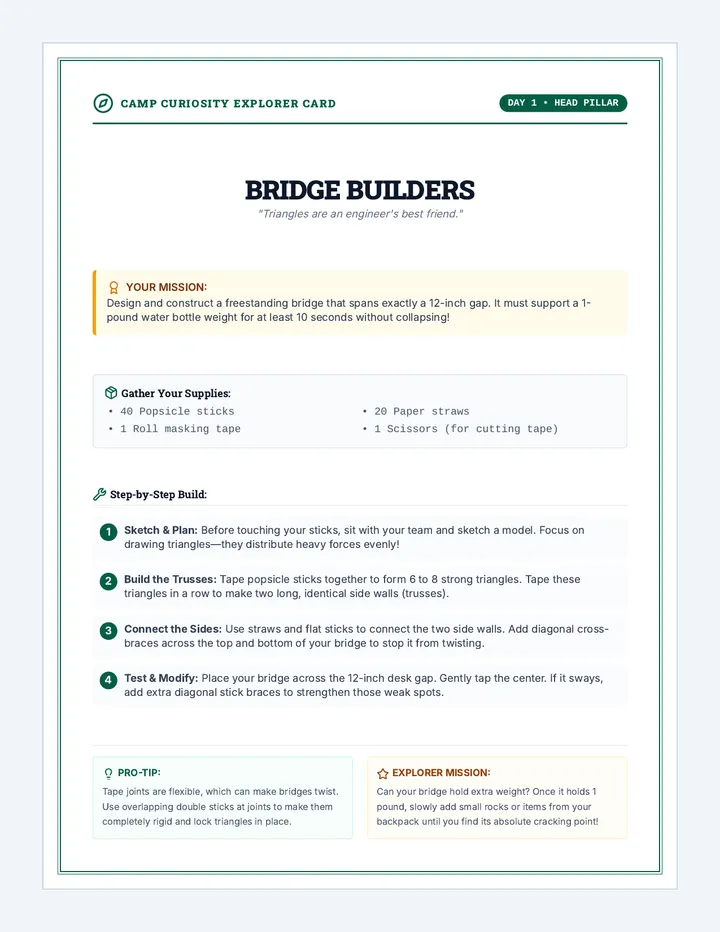
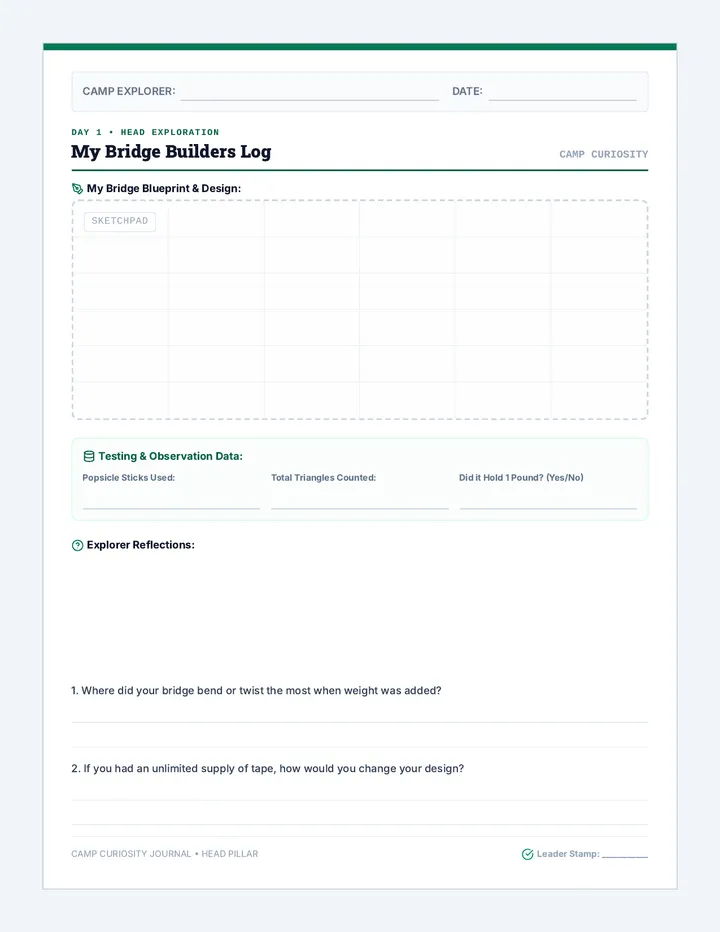
An action-packed, hands-on 8-day 4-H camp program focusing on Head, Heart, Hands, and Health. Students tackle engineering, teamwork, ecology, nutrition, and art challenges through daily active learning.
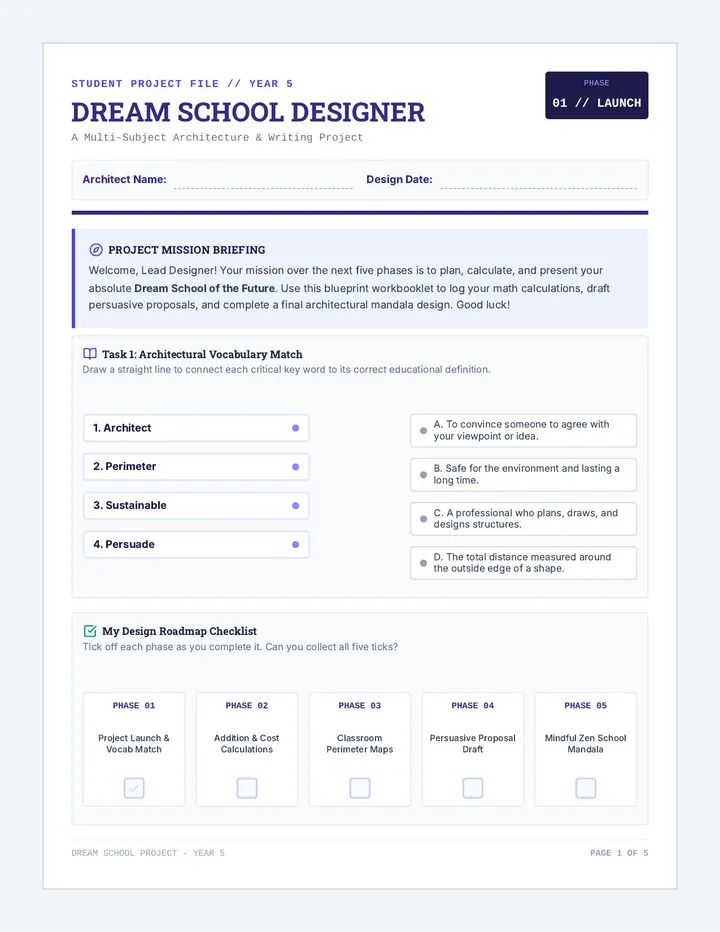
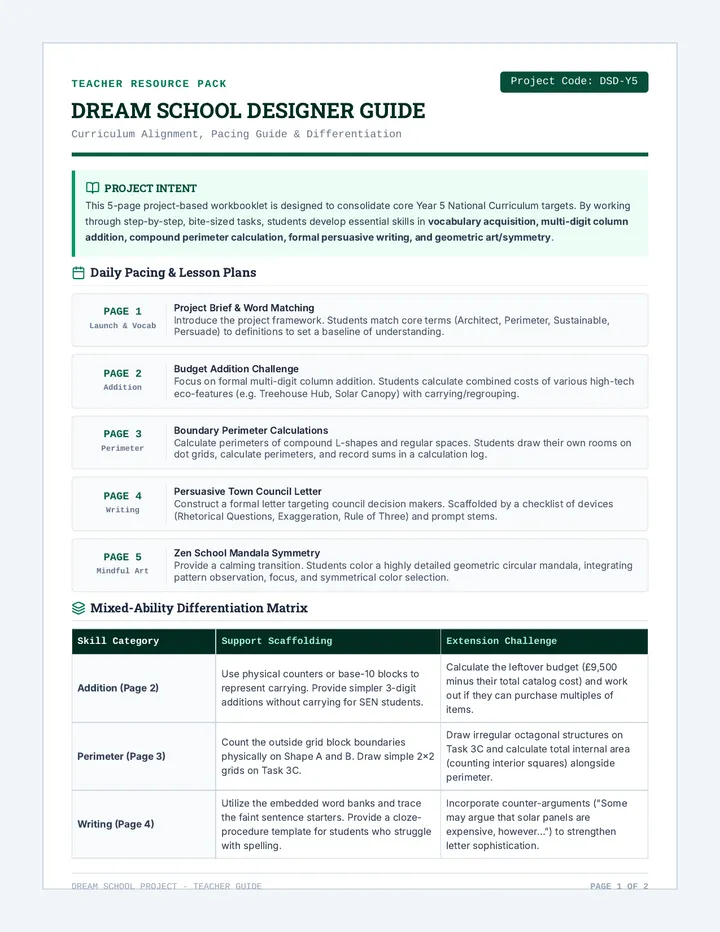
A project-based workbooklet and guide where Year 5 students design their ultimate future school. The project is broken down into structured, bite-sized daily steps integrating English, Maths, Science, Geography, and Art.
A 2-page teacher-facing lesson plan, differentiation matrix, and answer key designed to support educators in delivering the Dream School Designer project to Year 5 mixed-ability classes.
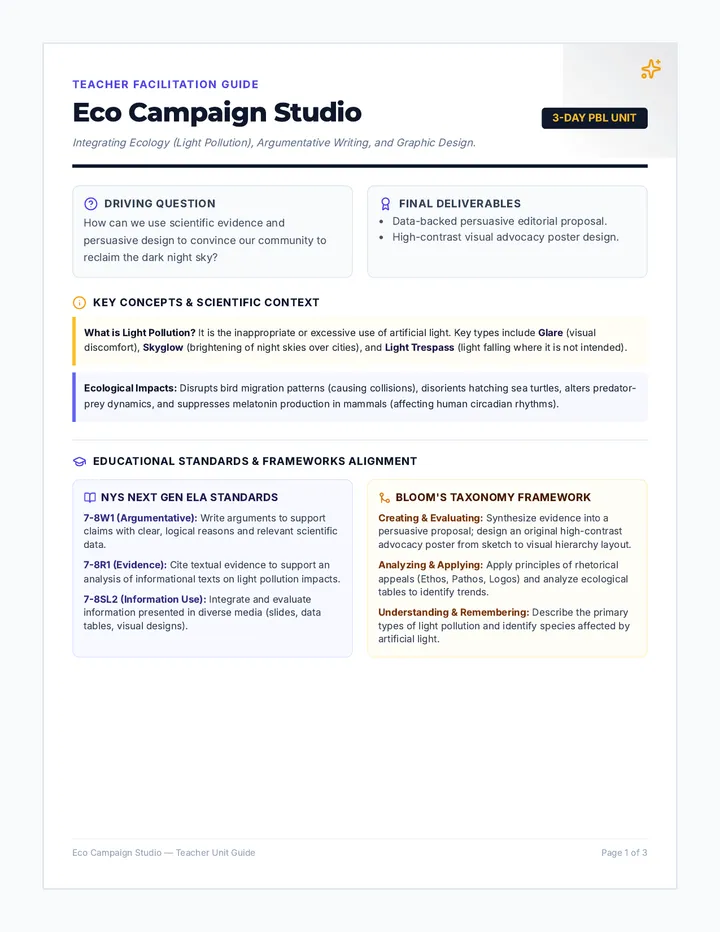
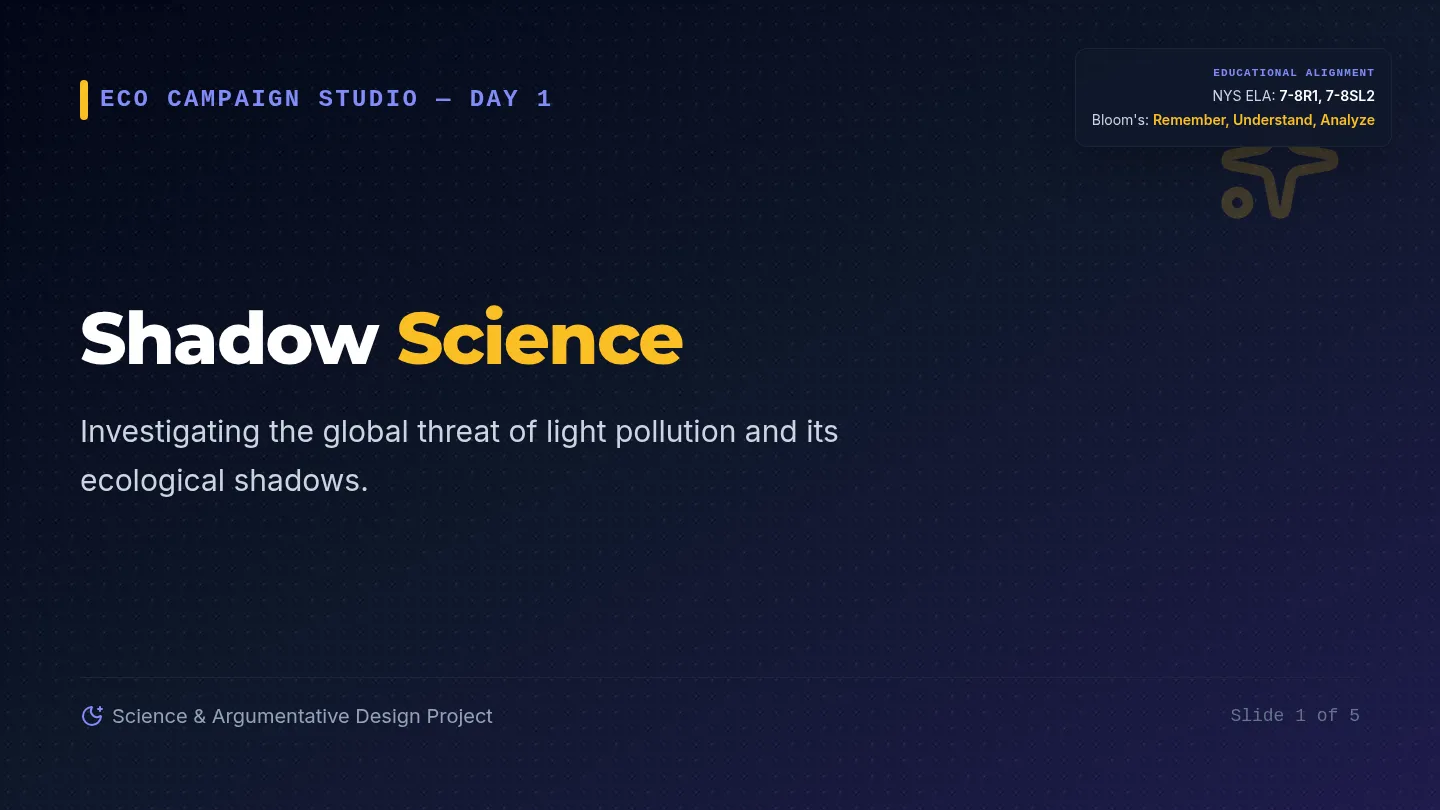
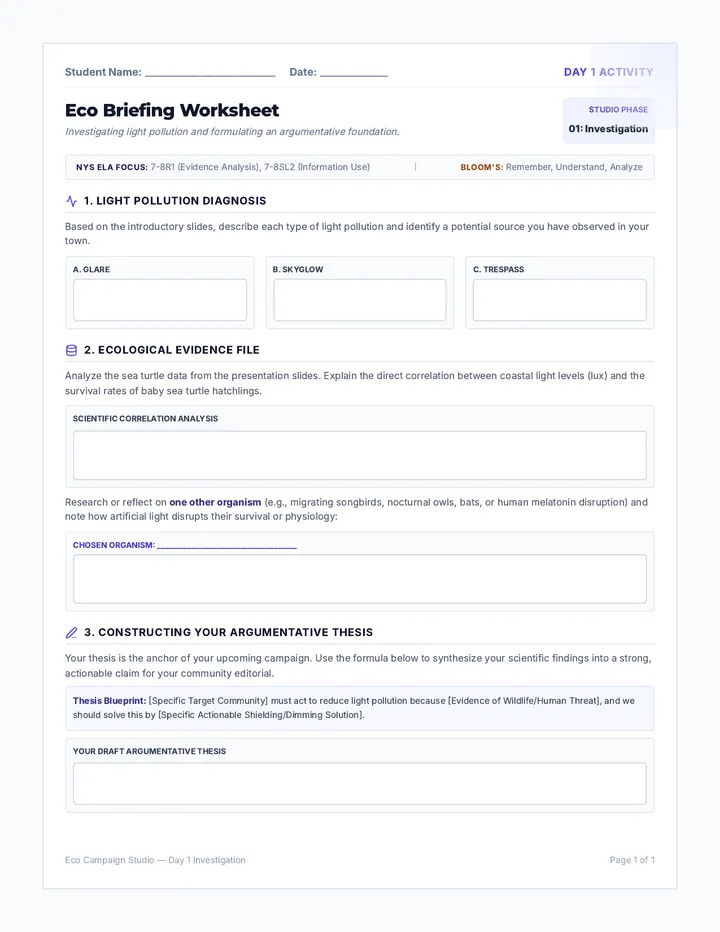
A cross-curricular, 3-day project-based unit combining science, argumentative writing, and graphic design. Students investigate the ecological impacts of light pollution, write a data-driven persuasive proposal, and design a community awareness campaign poster.
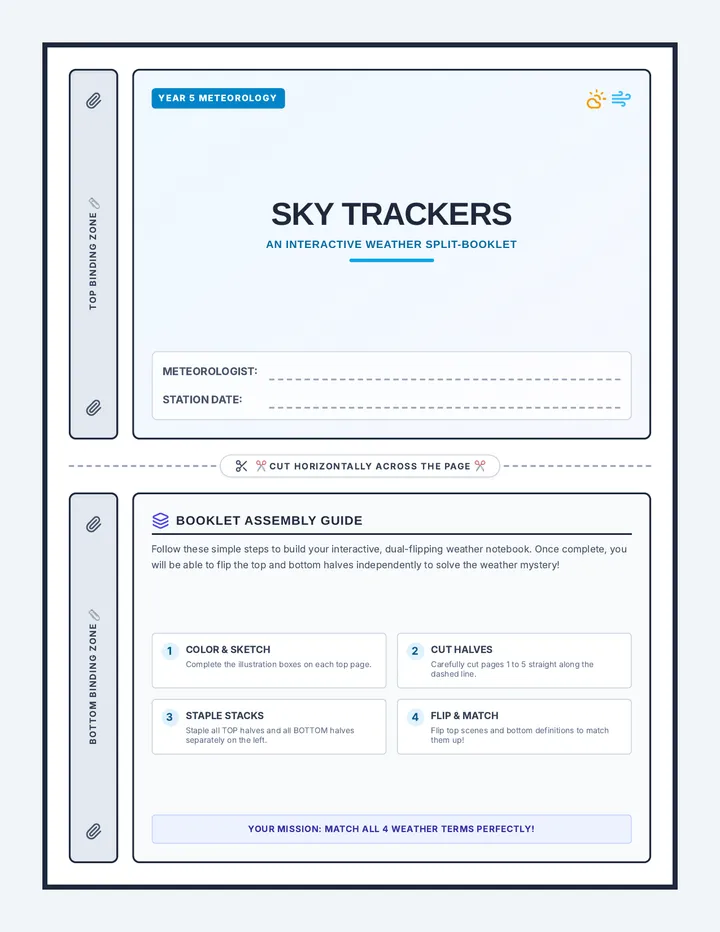
An interactive meteorological study where students construct and solve a dual-flip split booklet to match descriptive weather narratives with scientific terms and definitions.
A redesigned, 5-page student workbooklet featuring a Launch Checklist and Vocab Match, two Maths pages on perimeter and multi-digit addition, a formal Persuasive Writing letter, and a highly detailed SVG mandala for mindful coloring.
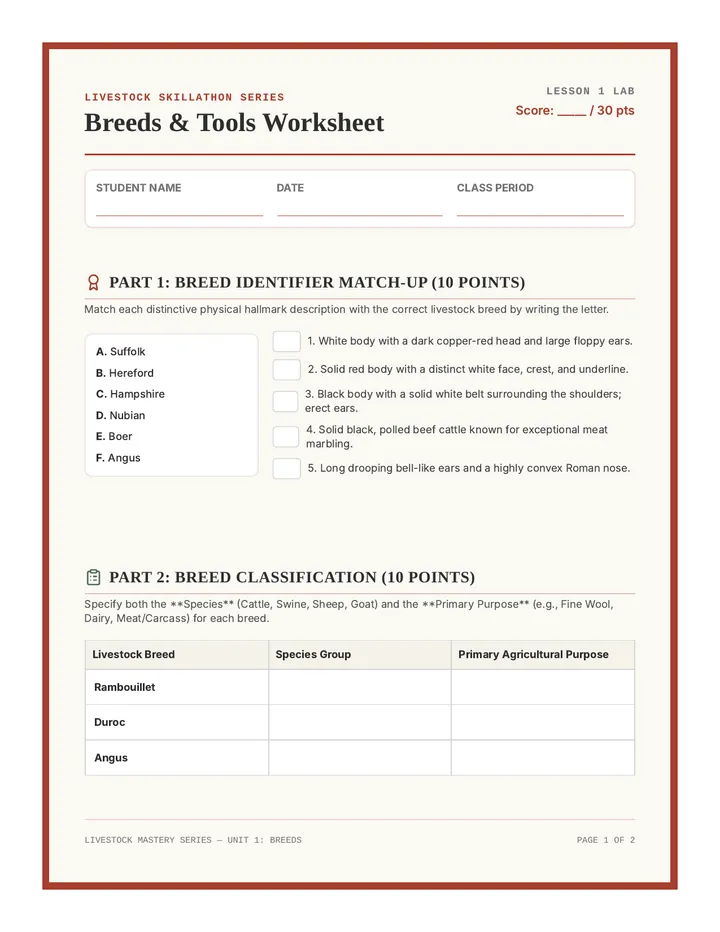
An immersive preparation program that equips agriculture students with the hands-on identification and evaluation skills needed to conquer competitive Livestock Skillathon contests.
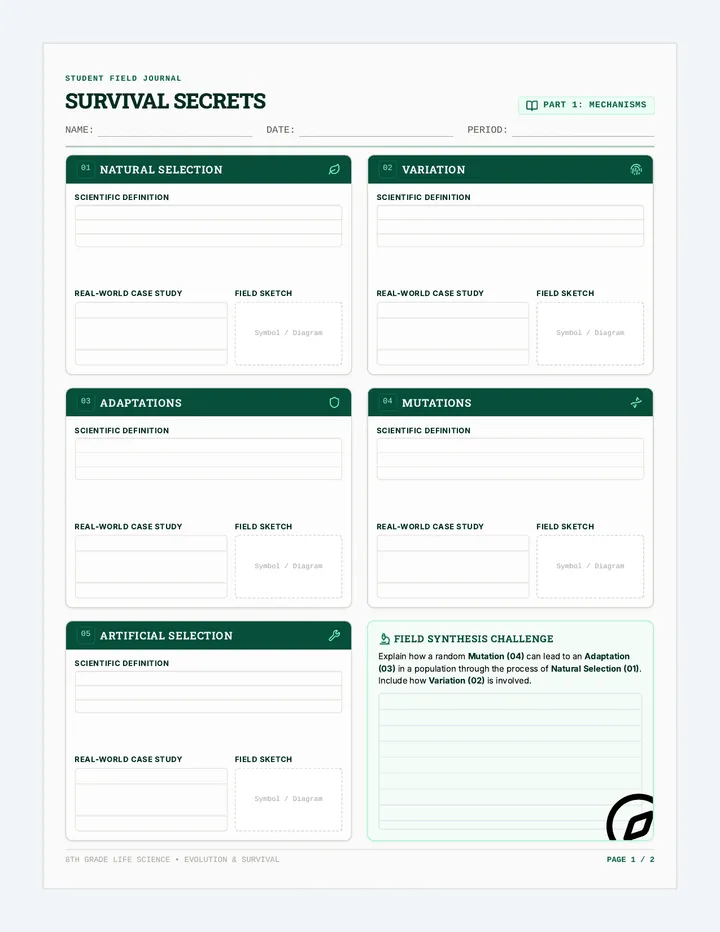
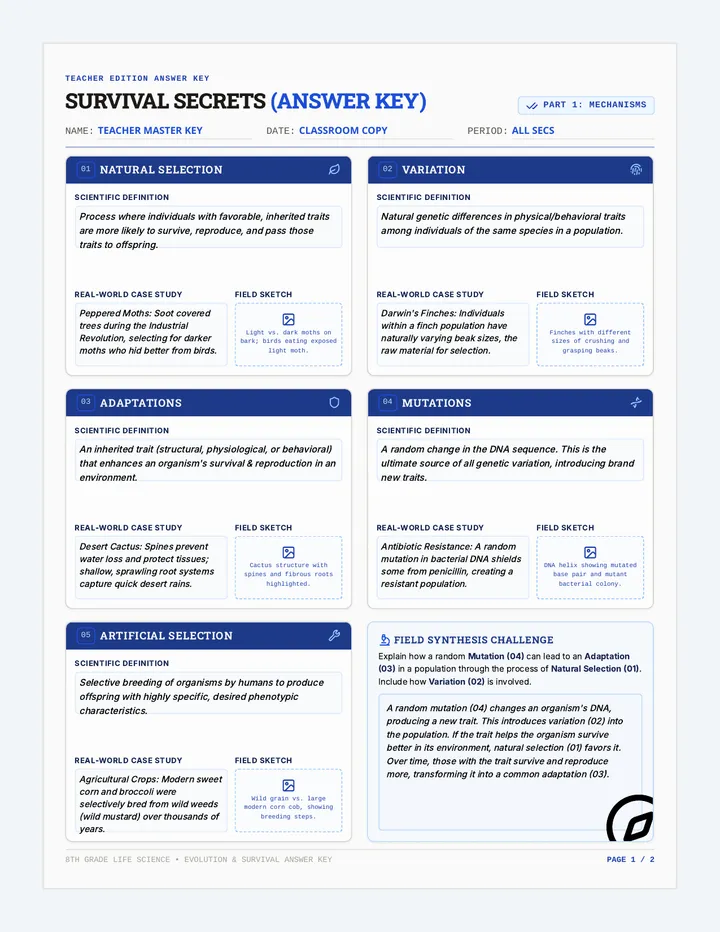
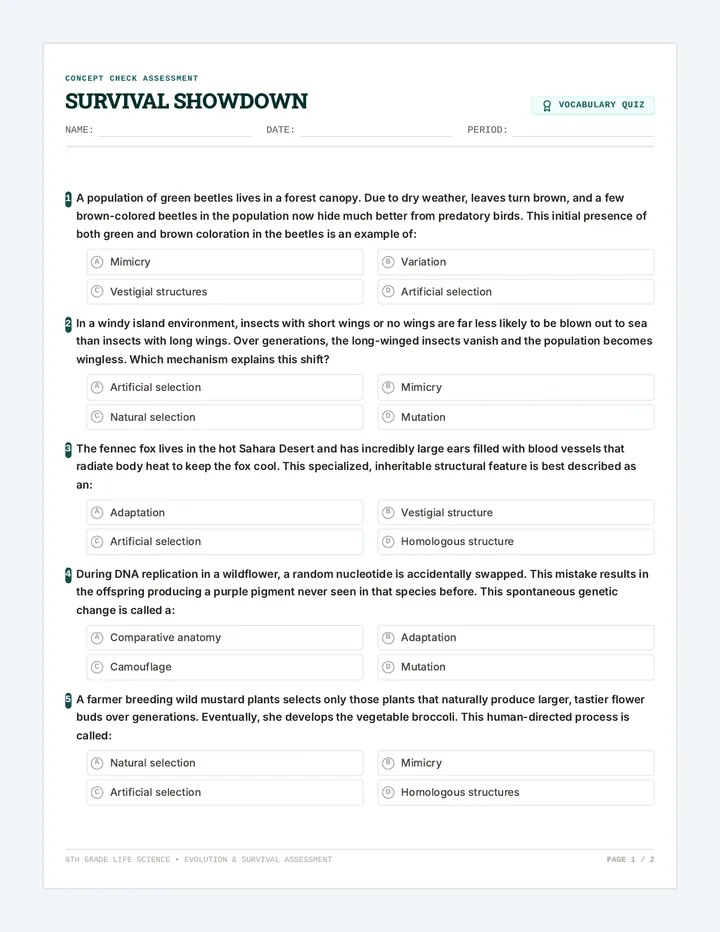
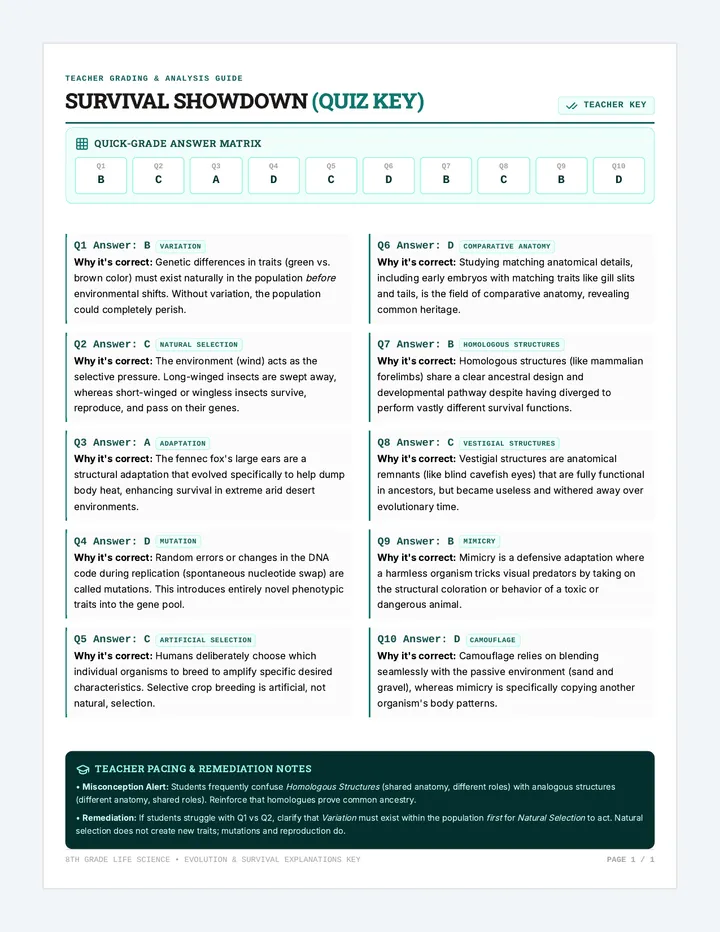
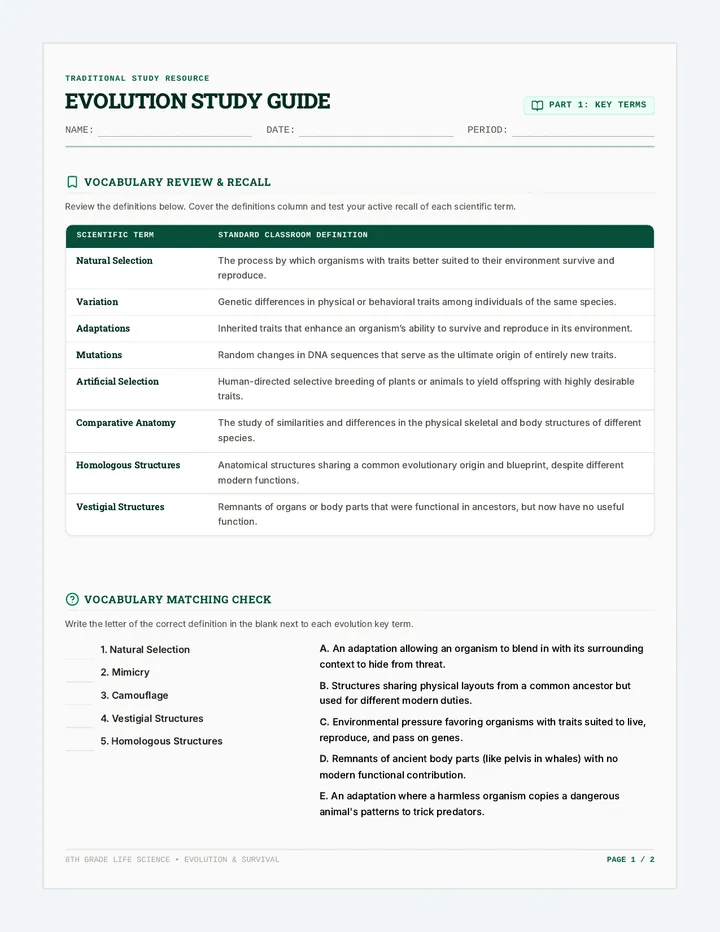
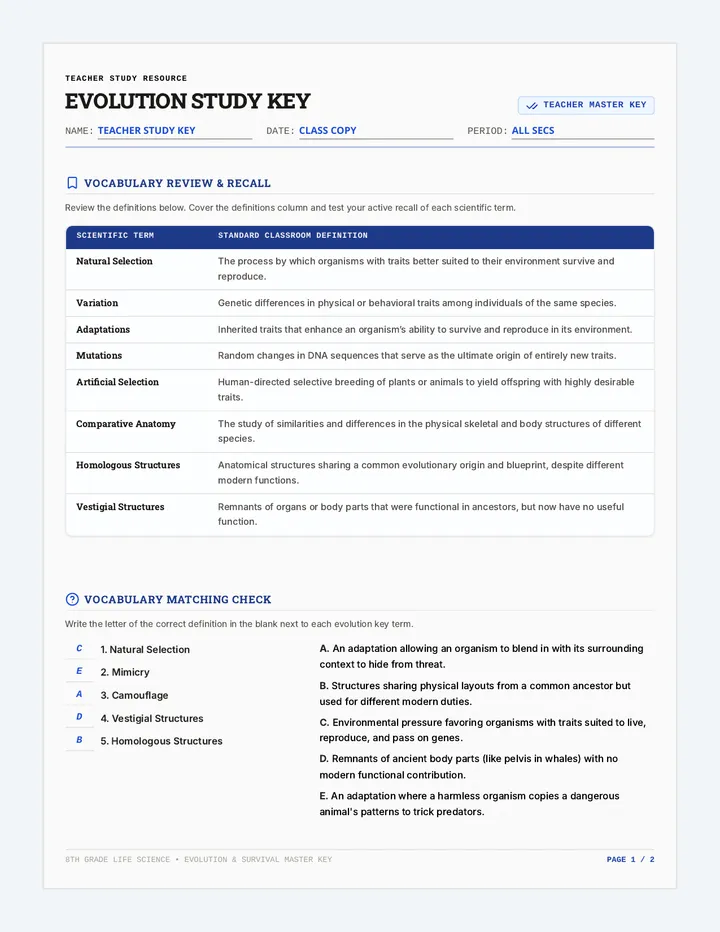
An active-recall study unit on natural selection and evolutionary evidence, featuring graphic organizers, application activities, and a practice quiz.
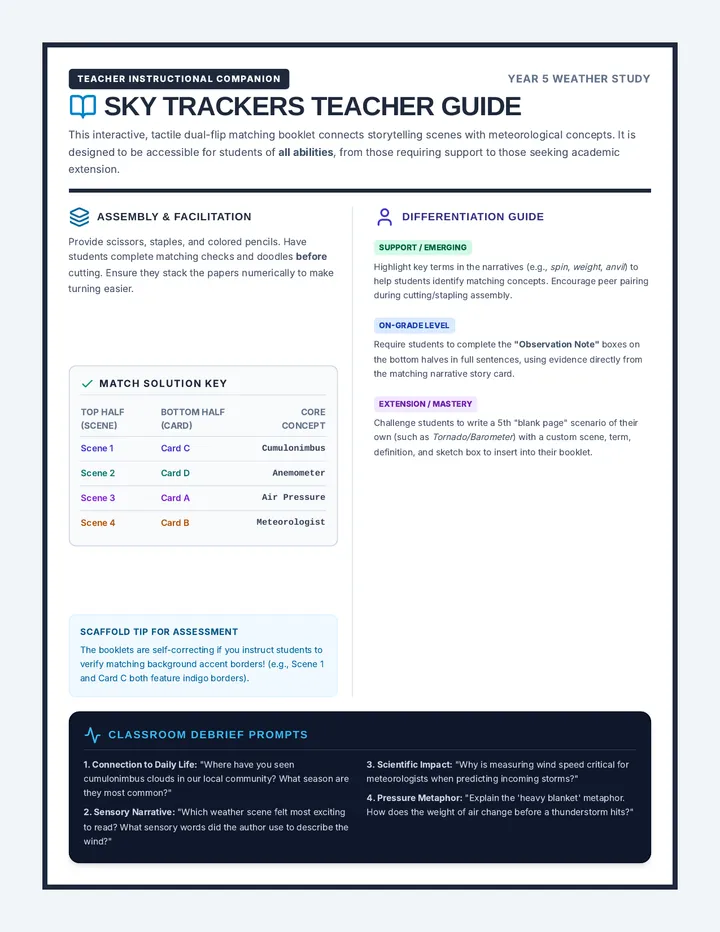
A comprehensive 1-page teacher reference guide containing assembly instructions, differentiation tips for all learning levels, an explicit match answer key, and classroom discussion prompts.
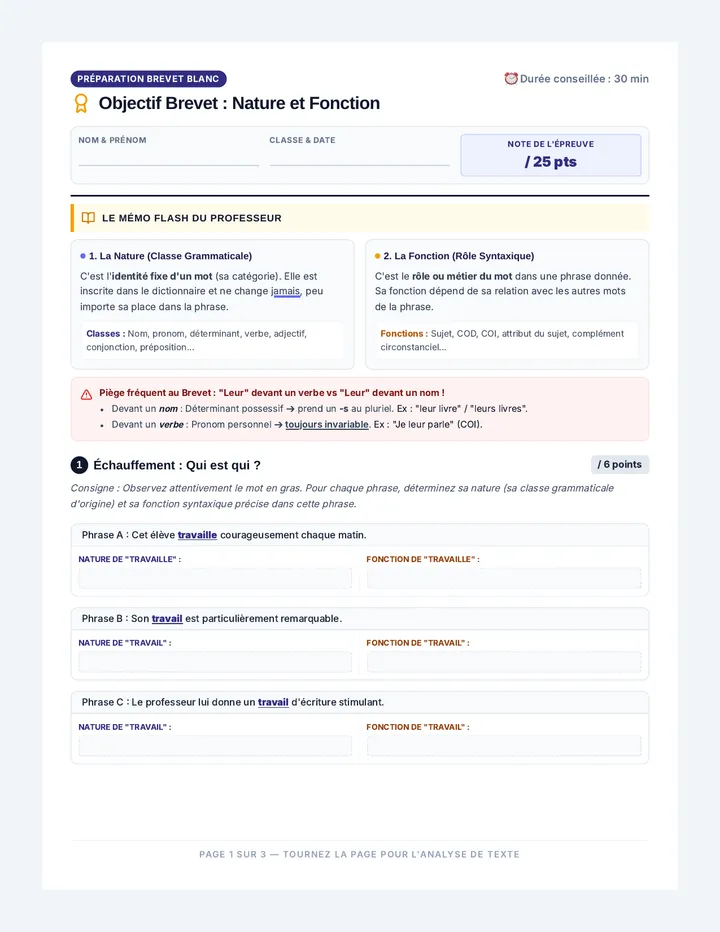
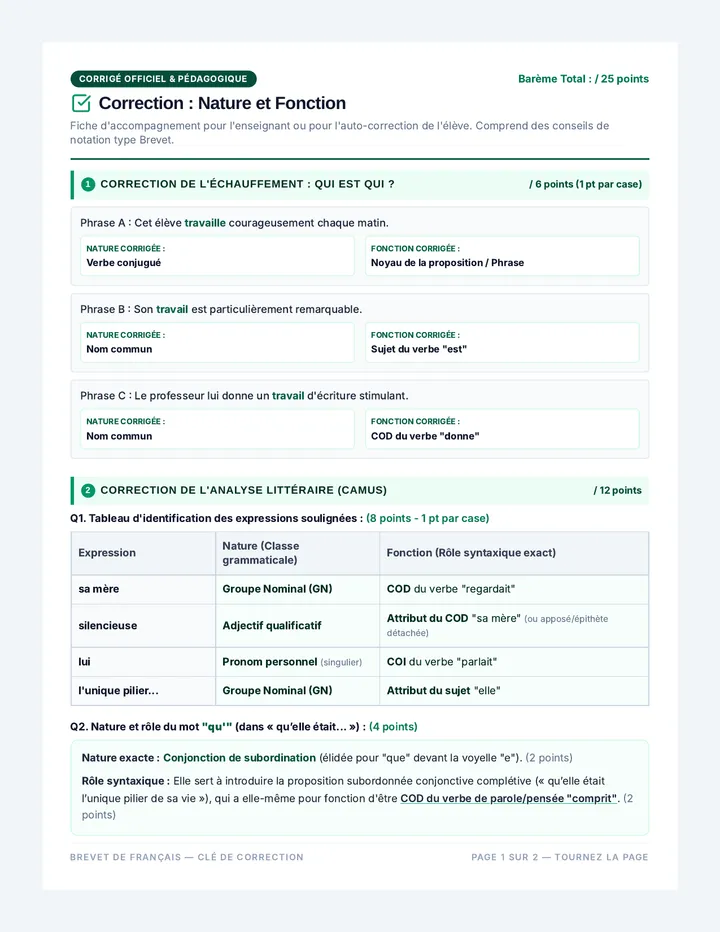
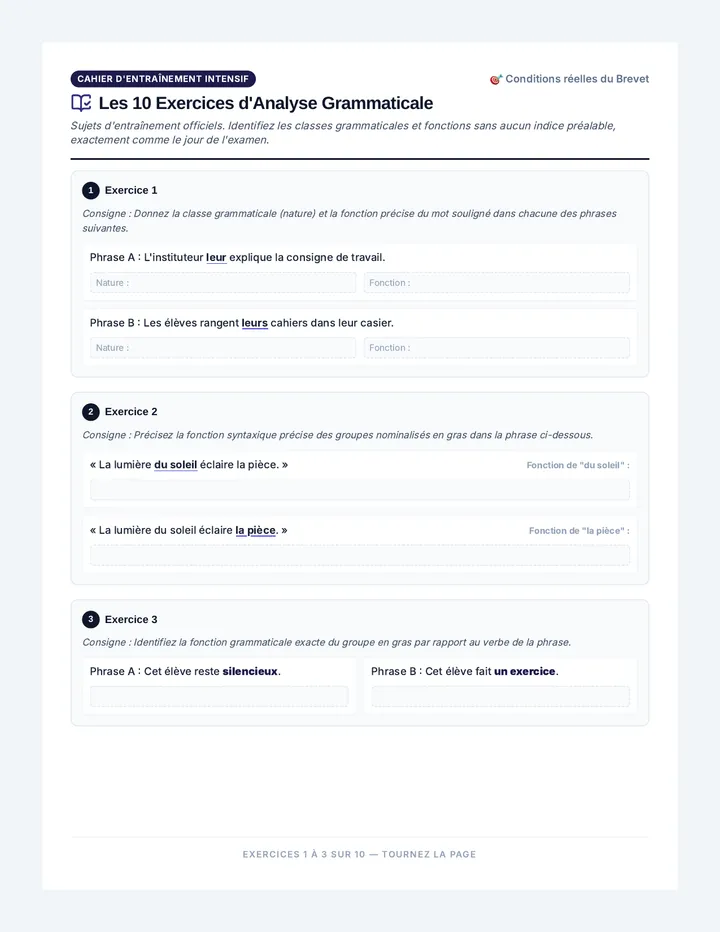
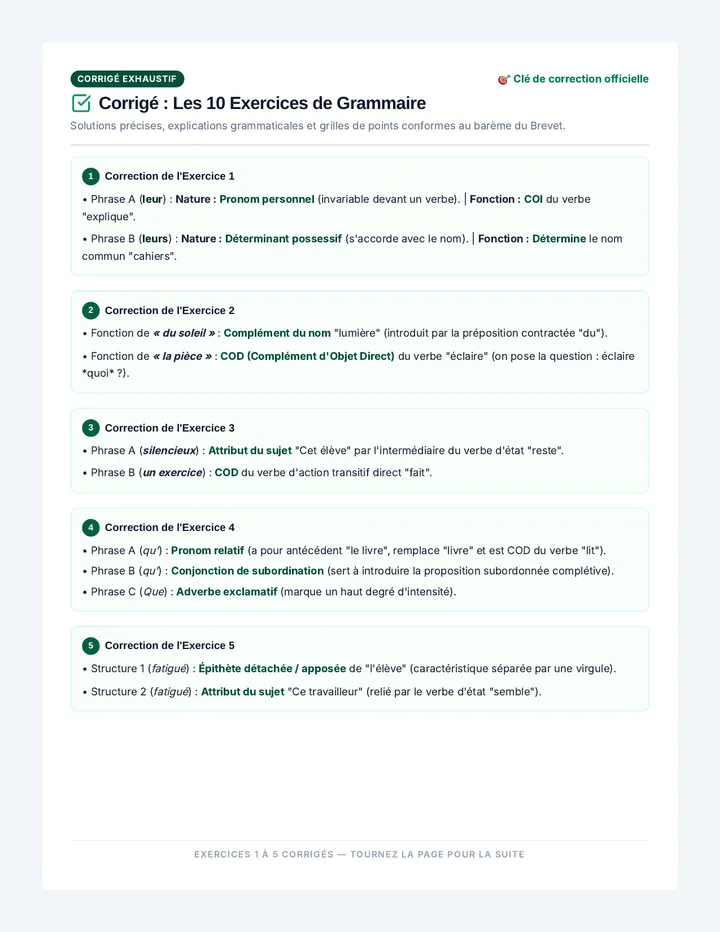
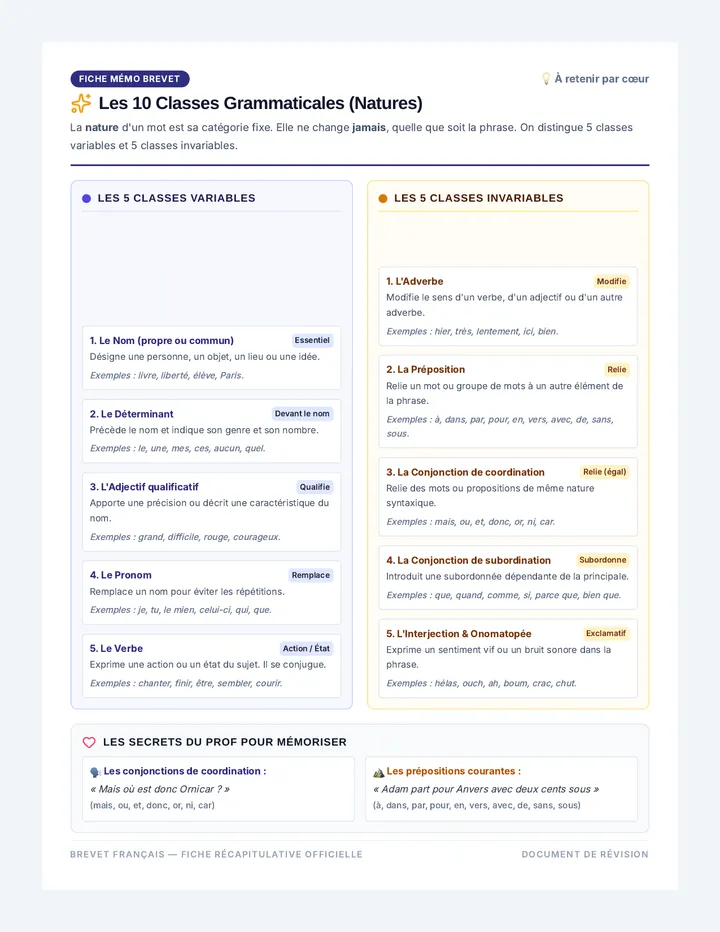
Un programme complet de révision intensive pour le Brevet, regroupant des fiches, exercices et corrigés détaillés en français et en physique-chimie.
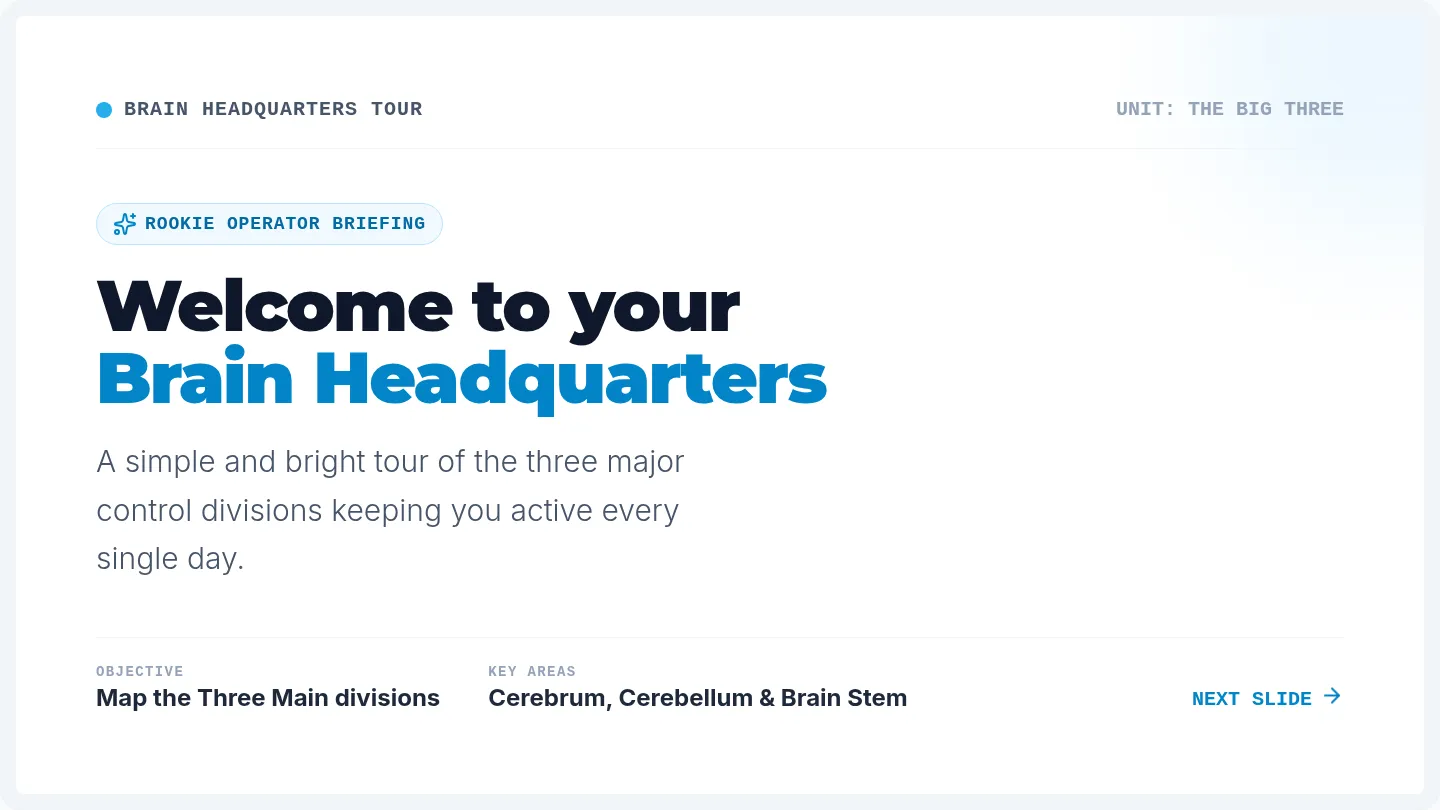
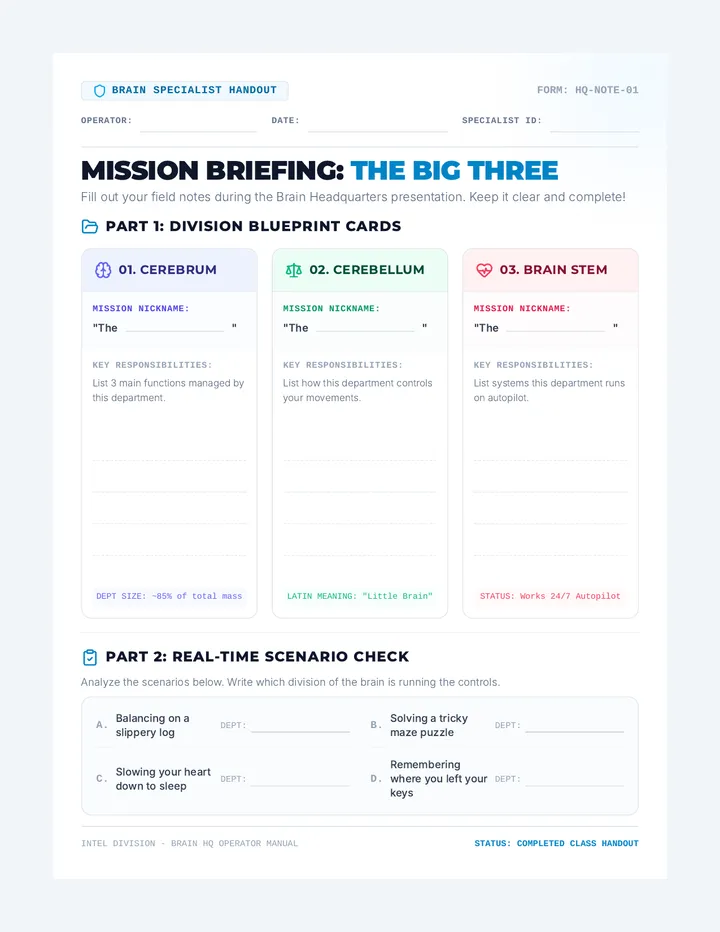
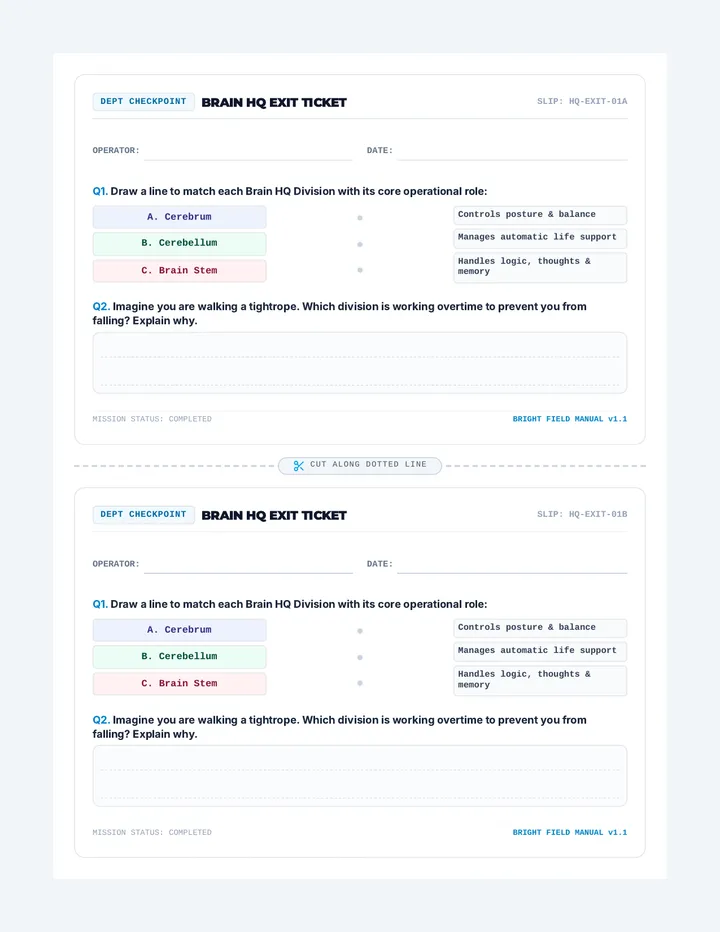
An interactive lesson introducing elementary or middle school students to the three major divisions of the brain: the Cerebrum, Cerebellum, and Brain Stem.
A 5-page interactive print-ready split booklet where students cut pages in half to match rich narrative weather scenes (top half) with scientific definitions (bottom half). Perfect for Year 5 meteorology and vocabulary integration.