Watershed Sleuths Slides Georgia Standards of Excellence • Grade 5 STEAM
GSE S5E1 • VA5 • CSS.5
Storm Shield Guardians: Watershed Sleuths
PBL Driving Question (Georgia GSE S5E1)
“How can we engineer solutions to protect Georgia ecosystems and human health from severe storm erosion and contamination?”
GSE S5E1.a: Destructive Forces
VA5.CR.2: Topographic Art
CSS.5.DA.01: GIS Digital Data
Georgia GSE S5E1.a & S5E1.b • Earth Science
Constructive vs. Destructive Forces
Water as a Destructive Agent in Georgia
From the Georgia Piedmont red clay to Coastal Plain barrier islands, severe storms trigger rapid destructive erosion.
Natural Vegetative Shield
Native pine and hardwood root canopies absorb kinetic raindrop energy, preventing mass soil wasting.
🌲 Georgia GSE S5E1.c: Vegetative cover as erosion-limiting technology
Urban Impervious Surfaces
Parking lots, school roofs, and concrete gutters channel stormwater into high-velocity scour torrents.
⚡ Destructive Scour: Carves Piedmont red clay gullies within minutes
Georgia Watershed Sleuth Task: Track precipitation from our school roof to the nearest Georgia river basin!
Technology Integration • GSE CSS.5.DA.01 & S5E1.c
Digital Hydrology Tools
Digital Tech Predicts Storm Impact
Modern civil engineers use digital sensors and satellite GIS data to model erosion before downpours strike.
Digital GIS Elevation
Students use digital topographic LIDAR maps to identify steep gradient slopes across campus.
GSE CSS.5.DA.01 Data Modeling
Digital Rain Telemetry
Automated wireless tipping-bucket rain gauges transmit precipitation rate data directly to student tablets.
Real-Time Rainfall Intensity (in/hr)
Interactive Stream Table
Augmented digital cameras measure real-time gully cut depth and sediment transport rates.
Georgia GSE S5E1.b Interactive Models
Tech Standard: Students organize and visualize digital runoff data to predict slope failure risk.
Visual Art Integration • Georgia GSE VA5.CR.1 & VA5.CR.2
Visualizing Elevation & Energy
Topographic Relief & Contour Line Art
In STEAM, artists translate topographic data into visual relief maps using color gradients and line density.
Contour Line Density Technique
• Closely Spaced Lines: Visually communicate steep cliff slopes and extreme runoff velocity.
• Widely Spaced Lines: Depict gentle floodplains where deposition naturally occurs.
• Line Weight (GSE VA5.CR.2): Thick stroke lines highlight primary watershed drainage ridges.
Hypsometric Color Gradients
• Warm Ochres & Browns: Paint high-elevation plateau ridges and runoff headwaters.
• Cool Greens & Blues: Blend low-lying wetland retention basins and riparian zones.
• Art Studio Connection: Students paint watercolor relief maps in Project Pack 1.1!
Art Studio Task: Render our school's 3D watershed terrain with layered contour washes! VA5.CR.2 Practice
Georgia 5th Grade STEAM Standards Map
Interdisciplinary Standards of Excellence
Year-Long Georgia STEAM Matrix
How every STEAM subject area unites across our four quarters:
SCIENCE (GSE)
S5E1 & S5L4
Destructive storm erosion, water weathering, harmful microorganisms, and soil conservation.
TECHNOLOGY
CSS.5.DA.01
Digital GIS slope mapping, sensor data telemetry, and electronic water probes.
VISUAL ART
VA5.CR.2
Topographic relief rendering, bioretention schematics, and civic advocacy posters.
MUSIC
GM5.CR.1
Acoustic storm soundscapes, hydrograph sonification, and resilience anthems.
Georgia Standards of Excellence verified and integrated. Launch Project Pack 1.1
Storm Forensics Project Pack GEORGIA STANDARDS OF EXCELLENCE • GRADE 5 STEAM
GSE S5E1 • VA5.CR.2 • CSS.5
Module 1.1: Watershed Topography, GIS Tech & Contour Art
Student:
Date:
STEAM Squad:
Georgia Standards: S5E1.a (constructive/destructive processes), VA5.CR.2 (traditional/contemporary art practices), and CSS.5.DA.01 (digital GIS elevation data).
Part A: Digital GIS Campus Audit & Slope Telemetry (CSS.5.DA.01)
Zone Sector
Surface Type
Digital Elevation / Slope
Destructive Erosion Signs?
Zone 1: Bus Loop Runoff
[ ] Pervious [ ] Impervious
Elevation: ____ ft
Slope: ____%
Zone 2: Athletic Field Bank
[ ] Pervious [ ] Impervious
Elevation: ____ ft
Slope: ____%
Zone 3: Courtyard Walkway
[ ] Pervious [ ] Impervious
Elevation: ____ ft
Slope: ____%
Part B: Visual Art Studio — Topographic Contour Line Rendering (VA5.CR.2)
Apply artistic contour line drawing techniques. Use closely spaced contour lines to show steep erosion gullies, widely spaced lines for flat floodplains, and directional flow arrows (→). Shade elevation zones with colored pencil gradients.
Topographic Contour Canvas (Label Ridgelines, Infiltration Basins, and Red Clay Rills)
Science Argument (GSE S5E1.a): How does high water velocity on impervious concrete turn ordinary rain into a destructive force?
Georgia Standards of Excellence • Grade 5 STEAM Sequence Page 1 of 3
GEORGIA GSE S5E1.b INTERACTIVE MODELING
Controlled Soil Lab
Stream Table Model: Vegetative Cover vs. Water Weathering
Developing a scientific model to collect quantitative data on how water causes destructive weathering and deposition in Georgia soils.
Georgia Standard: GSE S5E1.b (erosion & deposition models)
Independent Variable: Cover (Piedmont Bare Soil, Mulch, Root Mesh)
Constants: 15° Slope, 1000 mL Rain, 3 Min Duration
Soil Displacement Data Matrix
Condition Trial
Runoff Collected (mL)
Gully Depth (mm)
Sediment Mass (g)
Clarity (1-5)
Trial 1: Bare Georgia Red Clay
Trial 2: Pine Straw / Wood Mulch
Trial 3: Rooted Sod Grass
Math Connection (GSE 5.MDR.7): Sediment Mass Reduction Percentage
Formula: \( \text{Reduction \%} = \frac{\text{Trial 1 Mass} - \text{Trial 3 Mass}}{\text{Trial 1 Mass}} \times 100 \)
Visual Diagram (VA5.CR.1): Draw cross-section profiles showing rill cuts vs. vegetative root mesh armor.
Trial 1: Destructive Scour Profile
Trial 3: Root-Protected Shield
Georgia Standards of Excellence • Grade 5 STEAM Sequence Page 2 of 3
LAB 1.3 & GEORGIA GSE S5E1.c SYNTHESIS
Turbidity & Technology
Turbidity Metrics & Erosion-Limiting Technology
Evaluating water clarity with Secchi disks and framing engineering requirements under Georgia GSE S5E1.c.
Turbidity Tube Measurement Protocol
Record the water column depth in centimeters (\(\text{cm}\)) where the black-and-white disk disappears. Less than 20 cm indicates high sediment contamination threatening aquatic organisms.
Water Sample Turbidity Comparison
Sample Location
Water Depth at Disappearance
Turbidity Rating
Impact on Georgia Native Fish
A: Bare Clay Stream Table Effluent
B: Vegetated Turf Effluent
C: Campus Storm Drain Outfall
Quarter 1 Synthesis: Georgia GSE S5E1.c Engineering Criteria
1. Core Destructive Process Statement (S5E1.a): What specific erosion event is threatening our local Georgia watershed?
2. Technological Solution Focus (S5E1.c): How will our team use vegetative cover or green engineering to limit this destructive impact?
3. Interdisciplinary Connection (Technology / Art): How did GIS digital mapping and contour sketching clarify your design target?
Georgia Standards of Excellence • Grade 5 STEAM Sequence Page 3 of 3
Runoff Radar Slides Georgia Standards of Excellence • Grade 5 STEAM
GSE S5P1 • S5L4 • GM5 • CSS.5
Runoff Radar: Chemicals & Contamination
Quarter 2 STEAM Focus (Georgia GSE S5P1 & S5L4)
“How do chemical mixtures and harmful microorganisms travel in stormwater, and how can we use music and digital sensors to decode runoff?”
S5P1: Matter Mixtures
GM5.CR.1: Acoustic Soundscapes
S5L4: Harmful Microbes
Georgia Science GSE S5P1 & S5L4 • Matter & Microorganisms
Dissolved Solutions & Pathogens
Invisible Mixtures in Georgia Stormwater
Rain transforms surface pollutants into complex physical mixtures, chemical solutions, and bacterial suspensions.
Chemical Solutions (GSE S5P1)
Fertilizer nitrates and road salts dissolve completely into water molecules, forming homogeneous solutions that pass right through ordinary storm grates.
🧪 Cannot be filtered by simple grates—requires chemical sorbents!
Harmful Microorganisms (GSE S5L4)
Pet waste and stormwater sewer backups wash pathogenic E. coli and coliform bacteria into local Georgia waterways, contaminating oyster beds and lakes.
⚠️ S5L4 Evidence: Microbes that cause severe gastrointestinal illness.
Investigation Task: Use electronic digital probes (GSE CSS.5) to test chemical solution properties!
Technology Integration • GSE CSS.5.ET.01 & S5P1
Digital Chemical Diagnostics
Digital Sensor Probes: Reading the Invisible
Students deploy digital probes to collect real-time quantitative chemical metrics:
Digital pH Probes
Glass electrode sensors measure hydrogen ion concentration to 0.01 precision, logging data to spreadsheets.
GSE CSS.5.DA.01 Telemetry
Optical DO Sensors
Luminescence-based optical caps instantly read Dissolved Oxygen (\(\text{mg/L}\)), identifying hypoxic dead zones.
Real-Time Hypoxia Alerts
Digital Colorimeters
Measures light absorbance of nitrate and phosphate reagent dyes to calculate exact ppm nutrient levels.
EPA Threshold Compliance
Digital Standard: Students graph multi-sensor water quality profiles to identify peak storm contamination spikes.
General Music Integration • Georgia GSE GM5.CR.1 & GM5.PR.2
Hydro-Acoustic Composition
Sound of the Surge: Hydrograph Sonification
In STEAM, musicians translate stormwater hydrograph data into acoustic percussion and timbre soundscapes!
Movement 1
Raindrop Staccato
Pianissimo finger tapping & rainsticks simulate gentle initial infiltration.
Tempo: Andante (80 bpm)
Movement 2
Runoff Crescendo
Shakers & guiros build dynamic volume as water floods parking lots and gutters.
Dynamics: Mezzo-Forte → Forte
Movement 3
Toxin Collision
Metallic cymbals & brake drum hits signify chemical flush and turbidity surge.
Texture: Dissonant Polyphony
Movement 4
Biofilter Calm
Sustained xylophone chimes & ocean drums reflect clean water percolation.
Harmony: Major Chord Consonance
GSE GM5.CR.1 Task: Squads perform their 60-second acoustic hydrograph soundscape in Lab 2.2!
Georgia Ecosystem Impact • S5E1 & S5L4 Connection
Protecting Georgia Waterways
From Georgia Gutters to Seafood Nets
How storm runoff impacts Georgia river basins and coastal fishing estuaries:
1. Runoff
Storm Outfall
Heavy metals & bacteria flush from asphalt into urban creeks.
2. Estuary
Plankton Bloom
Algae absorb fertilizers; decomposing bacteria crash oxygen levels.
3. Marsh
Georgia Oysters
Filter-feeding shellfish accumulate toxins and coliform microbes.
4. Table
Human Health
Contaminant concentrations peak, triggering public health seafood bans.
Quarter 3 Engineering Goal: Engineer layered biofilters to neutralize chemical solutions and bacteria!
Contaminant Lab Protocol Guide GEORGIA STANDARDS OF EXCELLENCE • GRADE 5 STEAM
GSE S5P1 • S5L4 • CSS.5
Module 2.1: Non-Point Solutions & Pathogen Forensics
Student:
Date:
Lab Squad:
Georgia Standards: S5P1 (investigate chemical solutions and mixtures), S5L4 (harmful microorganisms in runoff), and CSS.5.ET.01 (digital tools for scientific analysis).
Part A: Watershed Contaminant Classification (S5P1 & S5L4)
Runoff Source
Specific Contaminant
Matter State (S5P1)
Ecological / Health Hazard
Lawn Turf Fertilizer
Nitrates & Phosphates
[ ] Dissolved Solution [ ] Suspension
Asphalt Parking Lot
Motor Oil Hydrocarbons
[ ] Immiscible Liquid Mixture
Dog Park Runoff
E. coli Bacteria (S5L4)[ ] Biological Microbe Suspension
Highway De-Icing
Sodium Chloride Salt
[ ] Dissolved Ionic Solution
Part B: Dissolved Solution Transport Diagram (GSE S5P1)
Illustrate how dissolved nitrate solutions flow from school grass into the storm curb drain without settling out. Show why simple physical trash grates fail to capture dissolved chemical solutions.
Solution Transport Pathway Canvas (Label Infiltration, Gutter Stream, and Untreated Outfall)
Science Explanation (S5L4): Why are coliform microorganisms considered harmful, and what happens when they wash into Georgia recreational lakes?
Georgia Standards of Excellence • Grade 5 STEAM Sequence Page 1 of 3
DIGITAL DIAGNOSTICS • GSE CSS.5.ET.01 & S5P1
Water Quality Lab
Chemical Assay: Digital Probes & Water Indicators
Using digital sensors and colorimetric test reagents to measure pH, nitrates, and dissolved oxygen across Georgia storm runoff samples.
Digital Tech Standard: CSS.5.ET.01 (digital sensor probes & colorimeters)
EPA Aquatic Baselines: pH 6.5–8.5 | Nitrates < 10 mg/L | DO > 6 mg/L
Digital Chemical Results Matrix
Sample Identifier
Digital pH
Nitrates (mg/L)
Dissolved Oxygen (mg/L)
Georgia Safety Rating
Sample A: Tap Water (Control)
Sample B: Parking Lot Gutter
Sample C: Fertilized Field Runoff
Sample D: Local Creek Outfall
STEAM Graphing (GSE 5.MDR.7): Nitrate Concentration Comparison
Construct a comparative bar chart for Samples A–D. Draw a red dashed horizontal line at the EPA drinking water safety ceiling (\(10\text{ mg/L}\)).
15 mg/L — Sample A Sample B Sample C Sample D
10 mg/L (EPA Safety Ceiling) — — — — — — — — — — — — — — — — — — — — — — — — — — — — — — — — —
5 mg/L —
0 mg/L —
Data Analysis: Which sample exceeded the safety threshold? What land management practice caused this chemical spike?
Georgia Standards of Excellence • Grade 5 STEAM Sequence Page 2 of 3
GENERAL MUSIC INTEGRATION • GEORGIA GSE GM5.CR.1
Acoustic Sonification
Hydrograph Sonification: Stormwater Soundscape Score
Improvising and arranging a 4-movement acoustic soundscape translating stormwater volume, chemical turbulence, and filtration into rhythm and timbre.
4-Movement Stormwater Acoustic Graphic Score (GM5.CR.1)
Storm Movement
Hydrology Stage
Instrumentation / Timbre
Dynamics & Tempo
1: Raindrop Infiltration
First downpour droplets soak dry soil
Finger taps, rainstick, woodblocks
Pianissimo (\(p\)), Andante
2: Gutter Surge Crescendo
Impervious runoff torrent floods street
Guiros, maracas, building shakers
Crescendo → Forte (\(f\))
3: Chemical Collision
Hydrocarbons & fertilizers flush to creek
Crash cymbals, metallic triangle hits
Fortissimo (\(ff\)), Dissonant
4: Biofilter Resurgence
Water percolates through clean roots
Xylophone chimes, ocean drums
Decrescendo → Piano (\(p\))
Graphic Notation Canvas: Compose Your Squad's Score (GM5.CR.1)
Draw your graphic notation score across the 60-second storm timeline. Use wave lines for water volume, jagged spikes for chemical dissonance, and sustained bell symbols for biofiltered harmony.
0s: Rain Infiltration 15s: Peak Runoff 35s: Toxic Outfall 60s: Cleansed Effluent
Acoustic Score Timeline (Label dynamic markings: p, mf, f, ff)
Musical Connection (GM5.CN.1): How does composing soundscapes help an audience “feel” the urgency of stormwater pollution?
Georgia Standards of Excellence • Grade 5 STEAM Sequence Page 3 of 3
Eco Shield Engineering Slides Georgia Standards of Excellence • Grade 5 STEAM
GSE S5E1.c • VA5.CR.1 • 5.MDR.7
Eco Shield Engineering: Biofilter Builders
Quarter 3 Engineering Focus (Georgia GSE S5E1.c)
“How can we design, architecturally draft, and test layered green technologies that limit destructive storm erosion and filter contaminated runoff?”
S5E1.c: Erosion Technology
VA5.CR.1: Technical Drafting
5.MDR.7: Flow Rate Math
Georgia Science GSE S5E1.c • Erosion-Limiting Technology
Controlling Destructive Processes
Engineering Green Defense in Georgia
GSE S5E1.c asks: How is technology used to limit the impact of destructive processes? Here is our engineering answer:
Traditional Gray Tech
Concrete culverts and storm drains merely move floodwater faster downstream, carving huge erosion canyons in Georgia red clay.
❌ Fails to filter chemical solutions or slow peak flood energy.
Bioretention Green Tech (S5E1.c)
Layered biofilters, bioswales, and rain gardens use natural media to slow velocity, capture sediment, and biodegrade pollutants.
✅ GSE S5E1.c Target: Limits flood damage and restores soil stability!
STEAM Integration: We combine visual architectural drafting with flow rate mathematics!
Visual Art Integration • Georgia GSE VA5.CR.1 & VA5.CR.2
Architectural Elevation Drafting
Architectural Cross-Section Drafting
Professional civil engineers and landscape architects use visual art drafting conventions to communicate schematics:
1. Dimensioning
Scaled Grid
Drafting with 1:2 scale grids where 1 square = 2 cm height ensures proportional precision.
GSE VA5.CR.1 Planning
2. Texturing
Material Shading
Stippling dots for sand, woodgrain hatches for mulch, and pebble circles for gravel beds.
Visual Line Techniques
3. Callouts
Leader Lines
Crisp 45-degree arrow leader lines clearly annotate media specifications and porosities.
Technical Labeling
4. Dynamics
Flow Vectors
Graduated blue flow arrows visualize hydraulic percolation velocity through strata.
Hydraulic Visualization
📐 Art Studio Challenge: Render your blueprint in Blueprint 3.2 using clean architectural line hierarchy!
Mathematics Integration • Georgia GSE 5.MDR.7
Hydraulic Rate & Ratios
Hydraulic Mathematics: Sizing the Shield
Students apply 5th grade rate equations to verify prototype drainage times:
Equation 1
Percolation Rate
Calculate mL drained per second: \( \text{Rate} = \frac{\text{Volume (mL)}}{\text{Time (s)}} \). Target: 3.5 – 5.0 mL/s .
Equation 2
Sediment Capture %
Measure trapped solids percentage: \( \text{Efficiency} = \frac{\text{Inflow} - \text{Outflow}}{\text{Inflow}} \times 100 \). Target: > 85% .
Equation 3
Unit Cost Budget
Sum layer unit costs to ensure prototype stays strictly under the $25.00 municipal cap .
Georgia Math Standard: Use decimal operations and rate calculations to validate engineering performance!
Engineering Design Process • GSE S5E1.c
Test • Analyze • Optimize
Stress-Testing Under 100-Year Storm Surges
How real engineers refine technology when prototypes face failure:
Clogging Bottleneck
Georgia red clay silts form an impermeable seal over the top sand layer.
Art/Tech Fix: Add coarse river rock splash ring to disperse impact energy.
Internal Channeling
Water drills a single high-speed wormhole without contacting biochar.
Math/Tech Fix: Tamp media evenly; install horizontal root mesh baffles.
Substrate Washout
Fine charcoal particles escape through underdrain gravel.
Art/Tech Fix: Drape permeable geotextile cheesecloth between strata.
Ready to Draft? Open Project Pack 3.2 and begin your architectural blueprint!
Biofilter Prototype Design Pack GEORGIA STANDARDS OF EXCELLENCE • GRADE 5 STEAM
GSE S5E1.c • 5.MDR.7
Module 3.1: Substrate Science & Hydraulic Rate Math
Student:
Date:
Engineering Squad:
Georgia Standards: S5E1.c (designing technologies to limit destructive water erosion) and 5.MDR.7 (calculating percolation flow rates using division and decimals).
Media Characterization Trials (200 mL Water Pour)
Filter Media Sample
Drain Time (s)
Rate (mL/s)
Particle Trapping Ability
Recommended Role
A: Coarse Pea Gravel
B: Builder's Sand
C: Activated Biochar
D: Hardwood Mulch
STEAM Math (GSE 5.MDR.7): Flow Rate Calculation
Apply division: \( \text{Flow Rate (mL/s)} = \frac{200\text{ mL}}{\text{Drain Time (seconds)}} \). Target optimal range: \(3.5\text{ to }5.0\text{ mL/s}\).
Squad Engineering Hypothesis (S5E1.c): How will your layering order prevent soil clogging while still absorbing dissolved chemicals?
Georgia Standards of Excellence • Grade 5 STEAM Sequence Page 1 of 3
VISUAL ART STUDIO • GEORGIA GSE VA5.CR.1 & VA5.CR.2
Technical Drafting
Architectural Elevation: Layered Bioretention Blueprint
Drafting a proportional technical cross-section schematic using material shading textures, leader lines, and dimensional callouts.
Scaled Elevation Canvas (GSE VA5.CR.1 • Scale: 1 Block = 2 cm)
Max Column Height: 40 cm
Apply artistic hatching and stippling to represent media textures. Draw 45° leader callout lines to name media layers and write layer thicknesses in cm. Draw blue arrows for hydraulic flow vectors.
40 cm Top Inflow Weir — — — — — — — — — — — — — — — — — — — — — — — — — — — — — — — — — — — — —
30 cm — — — — — — — — — — — — — — — — — — — — — — — — — — — — — — — — — — — — — — — — — — — — —
20 cm — — — — — — — — — — — — — — — — — — — — — — — — — — — — — — — — — — — — — — — — — — — — —
10 cm — — — — — — — — — — — — — — — — — — — — — — — — — — — — — — — — — — — — — — — — — — — — —
0 cm Perforated Underdrain — — — — — — — — — — — — — — — — — — — — — — — — — — — — — — — — — — —
Bill of Materials & Municipal Cost Sheet (Max Budget: $25.00)
Strata Layer Component
Target Depth (cm)
Unit Price / cm
Subtotal ($)
Shredded Bark Mulch Screen
$0.25 / cm
Engineered Sand & Topsoil Blend
$0.40 / cm
Activated Biochar Granules Core
$0.85 / cm
Washed River Pea Gravel Bed
$0.20 / cm
Total Prototype Expenditure:
$
Georgia Standards of Excellence • Grade 5 STEAM Sequence Page 2 of 3
GEORGIA GSE S5E1.c ENGINEERING VERIFICATION
Stress Test & Redesign
100-Year Storm Simulator: Hydraulic Stress Test
Benchmarking Cycle 1 prototype against simulated 500 mL storm deluge and iterating redesign to limit destructive runoff.
Performance Trial Benchmark
Engineering Performance Metric
GSE Target Standard
Cycle 1 Prototype
Cycle 2 (Redesign)
Flow Delay / Detention Buffer
30 – 60 seconds delay
Turbidity Reduction %
> 85% sediment trapped
pH Buffering (Inflow 4.5)
Buffered to pH 6.5 – 7.5
Structural Layer Stability
No media washout / collapse
Failure Analysis & Redesign Iteration (S5E1.c)
Observed Failure Mode or Flow Bottleneck in Cycle 1:
Root Cause & Responsible Substrate Layer:
Cycle 2 Engineering Modification: What specific media or mesh adjustment achieved peak drainage and clarity?
Georgia Standards of Excellence • Grade 5 STEAM Sequence Page 3 of 3
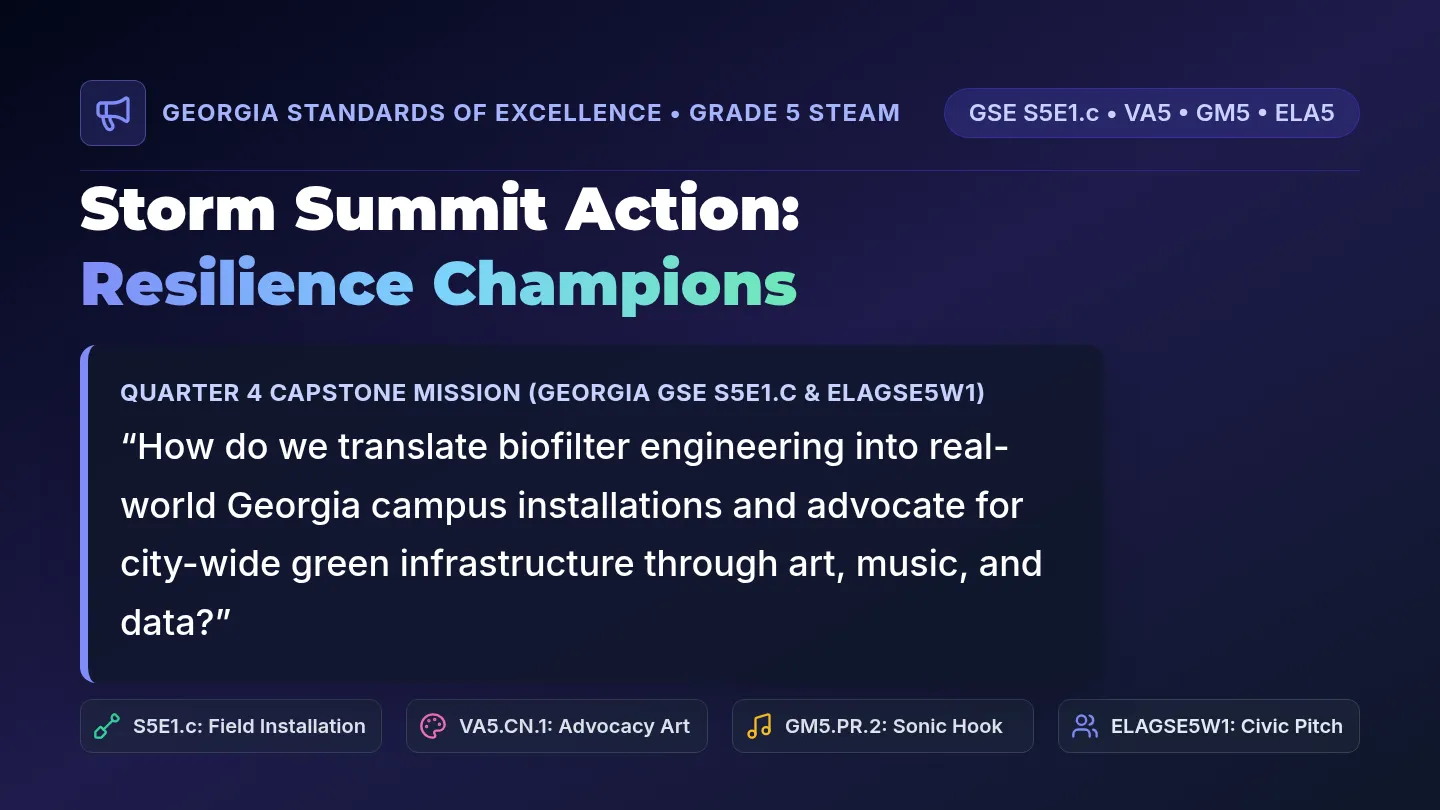
Storm Summit Action Slides Georgia Standards of Excellence • Grade 5 STEAM
GSE S5E1.c • VA5 • GM5 • ELA5
Storm Summit Action: Resilience Champions
Quarter 4 Capstone Mission (Georgia GSE S5E1.c & ELAGSE5W1)
“How do we translate biofilter engineering into real-world Georgia campus installations and advocate for city-wide green infrastructure through art, music, and data?”
S5E1.c: Field Installation
VA5.CN.1: Advocacy Art
GM5.PR.2: Sonic Hook
ELAGSE5W1: Civic Pitch
Georgia Science GSE S5E1.c • Erosion-Limiting Technology
Campus Groundwork
Scaling Green Defense to Georgia Soil
Our Quarter 3 prototypes scale up to a living outdoor bioretention cell filtering real Georgia storm runoff!
1. Perc Testing
Siting Safety
Locate downslope runoff channels 10+ feet from school walls; conduct percolation rate tests in Piedmont clay.
2. Earth Graded
Basin Dig
Excavate a 12-inch bowl depression with stone energy dissipator and level infiltration bottom.
3. Georgia Natives
Root Guild
Plant native switchgrass and coneflower whose 8-foot roots channel floodwaters deep into aquifers.
Georgia S5E1.c Standard: Demonstrates technology that actively prevents destructive gully erosion!
Art & Music Advocacy • Georgia GSE VA5.CN.1 & GM5.PR.2
Creative Civic Persuasion
Art & Music Power the Civic Pitch
Engineers change community hearts and minds by pairing technical data with compelling creative arts:
Advocacy Infographics (VA5.CN.1)
• Create high-contrast visual posters highlighting local creek turbidity.
• Connect art directly to community environmental justice and clean water.
• Display student-designed posters in the City Council lobby during the summit!
Acoustic Sonic Hook (GM5.PR.2)
• Open presentation with a 30-second storm soundscape performance.
• Fast percussion simulates flash flood surge; chime resolves to clean water.
• Captures immediate stakeholder emotional focus before sharing statistics!
🎨 GSE VA5.CN.1 & GM5.PR.2: Developing artistic and musical voice to serve local Georgia communities!
ELA Opinion & Economics • Georgia GSE ELAGSE5W1 & 5.MDR.7
Evidence-Based Civic Pitch
Pitching With Irrefutable Evidence
Georgia council leaders demand fiscal accountability and empirical proof:
Claim 1
Hydrologic Volume
Campus rain garden diverts 12,000 gallons of storm surge from aging municipal pipes every year.
Claim 2
Water Quality Assay
Digital probe data proves 88% reduction in nitrates and sediment before runoff reaches the river basin.
Claim 3
Municipal Savings
Green rain garden saves taxpayers $59,400 over 10 years versus concrete storm vaults!
Georgia ELA Standard: Write and deliver opinion speeches supported by logical facts and organizational structure!
PBL Culmination • ELAGSE5SL4 Authentic Defense
Georgia STEAM Graduation
Standing Before Community Leaders
At the Summit, your squad presents to city civil engineers, school board members, and neighbors:
01
Sonic Hook
Perform 30s hydrograph soundscape (GM5.PR.2) to evoke storm power.
02
Visual Evidence
Display advocacy infographics and technical blueprints (VA5.CN.1).
03
Tech Defense
Present digital probe data and biofilter stress-test results (S5E1.c).
04
Civic Call
Deliver structured policy motion for city green infrastructure (ELA5W1).
Georgia 5th Grade STEAM Champions: You have mastered science, tech, engineering, art, and music to protect our state!
Community Defense Action Portfolio GEORGIA STANDARDS OF EXCELLENCE • GRADE 5 STEAM
GSE S5E1.c • 5.MDR.7
Module 4.1: Georgia Rain Garden Field Siting & Guild
Student:
Date:
Action Squad:
Georgia Standards: S5E1.c (field installation of erosion-limiting vegetative cover), VA5.CR.2 (site plan landscape drafting), and 5.MDR.7 (drainage volume calculations).
Georgia Native Bioretention Plant Guild (S5E1.c)
Georgia Native Species
Root Depth
Moisture Inundation Zone
Phytoremediation Function
Count
Tussock Sedge
3 – 5 feet
Basin Floor (Frequent Ponding)
Heavy nitrogen & phosphate uptake
Blue Flag Iris
2 – 4 feet
Mid-Slope Transition Zone
Traps heavy metals & hydrocarbons
Purple Coneflower
5 – 8 feet
Outer Berm Crest (Dry Border)
Soil macro-channels & native bees
Switchgrass
7 – 10 feet
Inflow Dissipation Apron
Deep root mat prevents gully cuts
Landscape Architectural Site Layout Plan (GSE VA5.CR.2)
Draft the top-down plan view. Label: (1) Parking lot curb inlet, (2) River rock splash pad, (3) Native plant zones, and (4) Overflow weir channel.
Campus Rain Garden Schematic (Scale: 1 in = 5 ft)
Post-Storm Infiltration Test (S5E1.c): How will your squad measure water disappearance 24 hours after a storm event?
Georgia Standards of Excellence • Grade 5 STEAM Sequence Page 1 of 3
STEAM ECONOMICS & CIVIC FINANCE • GSE 5.MDR.7
Cost-Benefit Analysis
10-Year Municipal Lifecycle Expense: Gray vs. Green
Calculating cost-effectiveness and ecological returns of student-designed green infrastructure versus underground concrete vaults.
Comparative 10-Year Infrastructure Ledger
Financial / Ecological Metric
Option A: Concrete Storm Vault
Option B: Engineered Green Bioswale
Initial Construction Expense
$48,000 (concrete & heavy excavation)
$2,400 (native plants, soil blend, stone)
10-Year Maintenance Total
$15,000 ($1,500/yr vactor pumping)
$1,200 ($120/yr volunteer mulch weeding)
Contaminant Removal %
0% (dumps raw runoff into creek)
88% – 92% filtered by biochar & roots
Community Co-Benefits
None (sealed dark concrete box)
Outdoor STEAM lab, monarch pollinator garden
10-Year Total Taxpayer Cost:
$63,000
$3,600
STEAM Math (GSE 5.MDR.7): Total Municipal Taxpayer Savings
Calculate taxpayer savings: \( \text{Savings} = \$63,000 - \$3,600 = \text{\$} \). What is the cost reduction factor (\(\$63,000 \div \$3,600\))?
Fiscal Argument (ELAGSE5W1): State your claim with two supporting economic facts explaining why our city should fund green bioswales:
Georgia Standards of Excellence • Grade 5 STEAM Sequence Page 2 of 3
GEORGIA RESILIENCE SUMMIT • GSE ELAGSE5W1 & VA5/GM5
Annual Synthesis
Civic Pitch Script & Annual Georgia STEAM Rubric
Defending your squad's engineered green infrastructure before local municipal leaders using structured opinion speech, art posters, and acoustic music.
3-Minute Stakeholder Presentation Outline (ELAGSE5W1)
1. The Sonic Hook & Urgent Problem (GM5.PR.2 & S5E1.a):
“[Perform 30s storm soundscape]. Honorable City Council, severe downpours cause ______ NTU turbidity and flash flooding because...”
2. Our Engineered Green Solution & Infographic Art (S5E1.c & VA5.CN.1):
“As shown in our advocacy poster, our squad engineered a bioretention cell that traps ______% of pollutants and saves...”
3. Our Formal Policy Motion:
“We formally propose that the council allocate $15,000 to construct bioswales across 5 school campuses to protect our watershed.”
Annual Georgia Standards of Excellence STEAM Mastery Rubric
GSE Domain
Performance Standard
Mastery (1-4)
Science (S5E1 & S5L4)
Identified destructive water erosion and engineered green vegetative technologies to limit soil loss
Visual Art (VA5.CR.2 & CN.1)
Rendered topographic contour elevation art and designed community advocacy infographic posters
General Music (GM5.CR.1 & PR.2)
Composed and performed hydro-acoustic stormwater soundscapes using timbre, dynamics, and rhythm
Technology & Math (CSS.5 & 5.MDR)
Logged digital GIS & chemical probe data; calculated flow rates and municipal taxpayer savings
Annual Synthesis: How did integrating science, art, music, and technology prepare you to solve real problems in Georgia?
Georgia Standards of Excellence • Grade 5 STEAM Sequence Page 3 of 3