Fault Mechanics Slides LESSON 01
FAULT STRESS
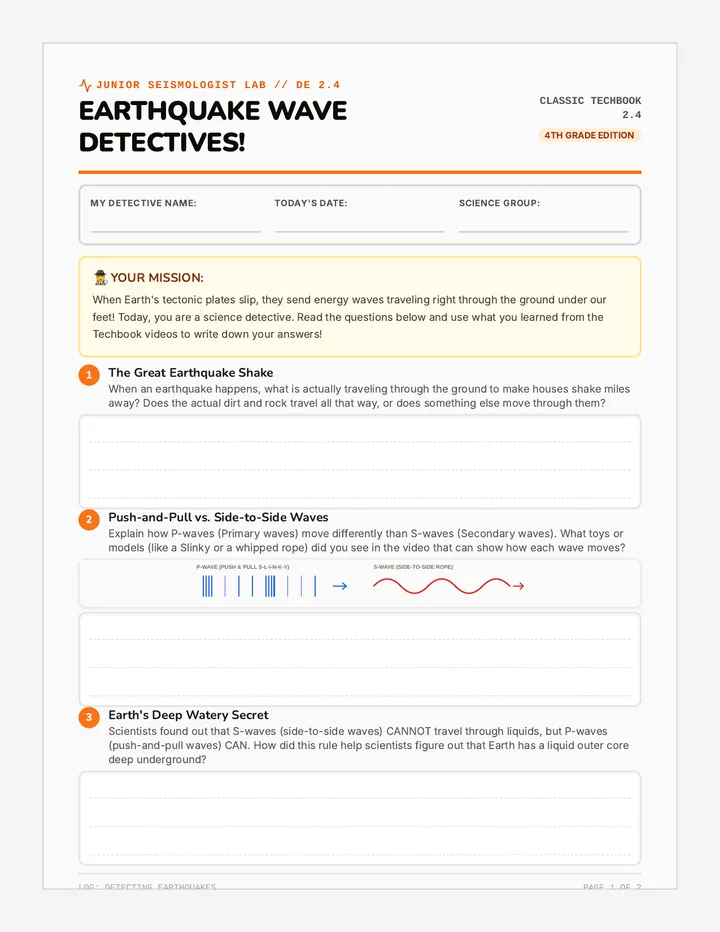
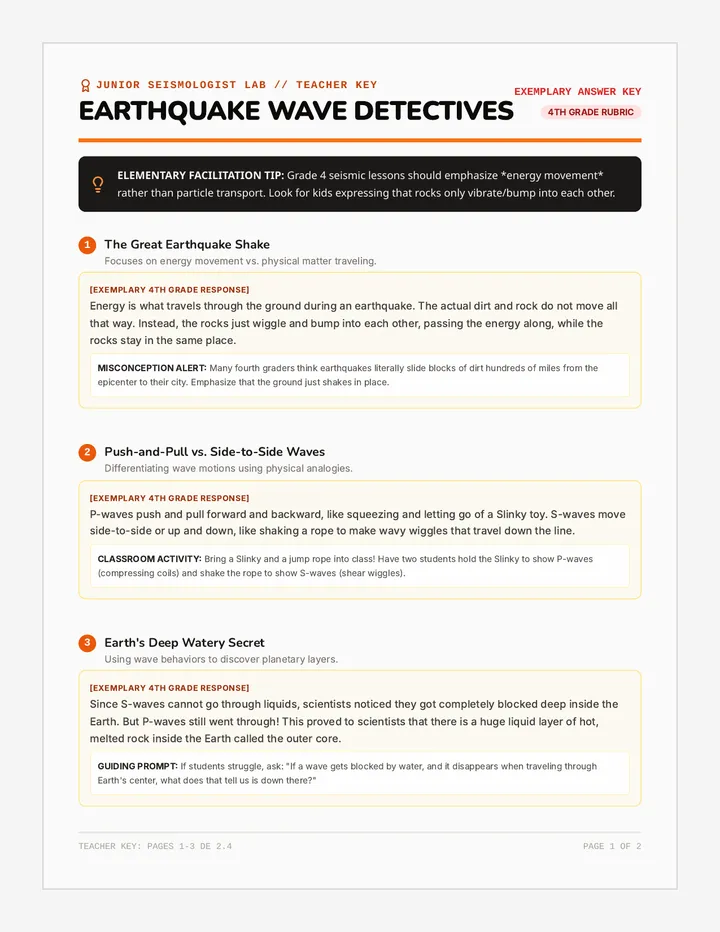
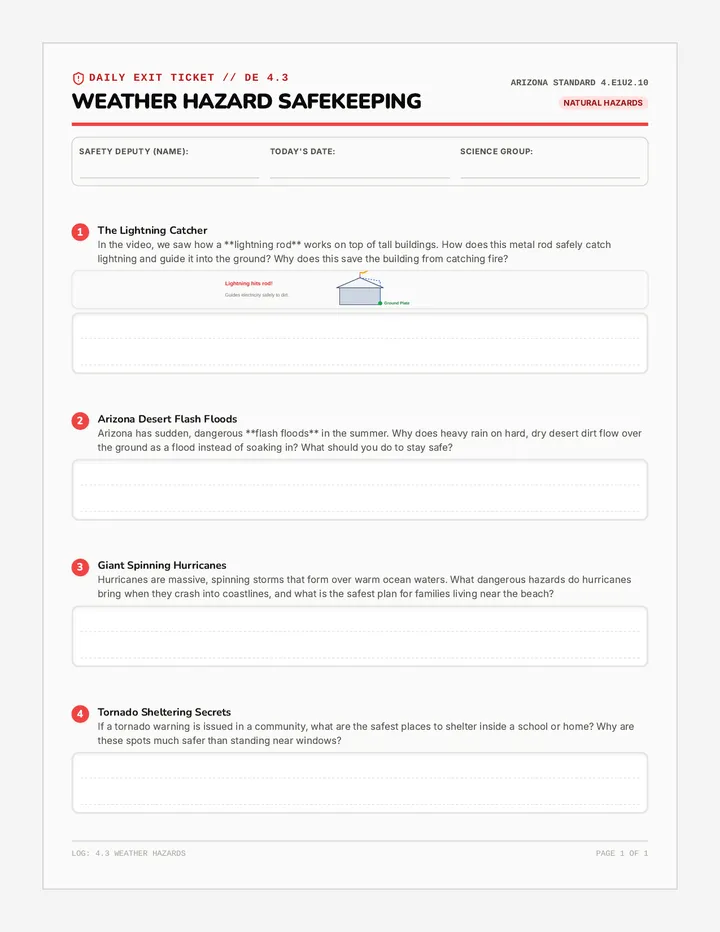
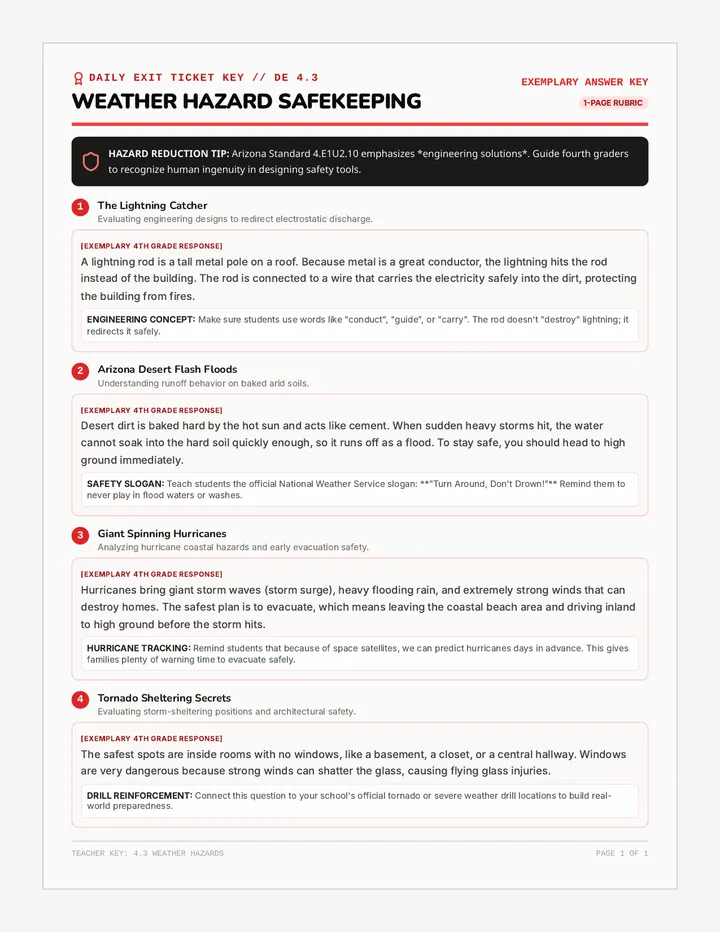
& STRAIN
Investigating the mechanics of elastic rebound theory and the physics of energy release.
Elastic Rebound
Stress vs. Strain
Phase 01: Mechanics
THE LIMIT OF ELASTICITY
Physical Hook
Watch as your teacher bends a wooden ruler. What happens to the wood as force is applied? What happens when it reaches its breaking point?
Key Questions:
Where is the energy stored while the ruler is bent?
What form does that energy take once it snaps?
How does this model the movement of tectonic plates?
Observation: Deformation precedes failure.
MECHANICAL STRESSORS
Compression
Squeezing or pushing together. Common at convergent boundaries.
RESULT: REVERSE FAULTS
Tension
Pulling apart or stretching. Common at divergent boundaries.
RESULT: NORMAL FAULTS
Shear
Sliding past in opposite directions. Common at transform boundaries.
RESULT: STRIKE-SLIP FAULTS
ELASTIC REBOUND THEORY
01
STRESS
"The Build Up"
Tectonic forces apply pressure to rock masses along a fault line.
02
STRAIN
"The Deformation"
Friction locks the fault. Rocks bend and deform elastically, storing potential energy.
03
RUPTURE
"The Break"
Stress exceeds the frictional strength of the rock. The fault slips suddenly.
04
REBOUND
"The Release"
Rocks snap back to a new undeformed state, releasing energy as seismic waves.
CORE CONCEPT: Earthquakes are the sudden release of stored elastic strain energy.
Elastic Rebound Lab Worksheet ELASTIC REBOUND LAB
Subject: Seismic Mechanics & Strain accumulation
NAME
DATE
OBJECTIVE
To model the accumulation of elastic strain in rocks along a fault and observe the relationship between friction, stress buildup, and the sudden release of energy during seismic failure.
MATERIALS
2 Sandpaper blocks
Rubber band (thick)
Metric ruler
Permanent marker
Mass set (200g - 1kg)
PART 1: THE ACCUMULATION MODEL
1
Place two sandpaper blocks side-by-side on a flat surface so the rough sides are touching (representing a strike-slip fault). Draw a straight line across both blocks with a marker.
2
Secure one block (Block A) so it cannot move. Attach a rubber band to the other block (Block B). Place a 500g mass on top of Block B to increase friction.
3
Slowly pull the rubber band. Observe what happens to the rubber band (the "strain") and the blocks (the "fault") before any movement occurs.
OBSERVATIONS: What do you observe about the rubber band as you pull? How does the marker line change?
PART 2: MEASURING FAILURE
Repeat the pull 5 times. Measure the length of the rubber band (strain) at the moment of the "slip" and the distance the block jumps.
Trial Strain Length (cm) Slip Distance (cm) Notes (Sound/Vibration) 1 2 3 4 5
PART 3: PHYSICS ANALYSIS
1. In this model, what represents the tectonic plates, what represents the friction holding them together, and what represents the accumulation of stress?
2. Did the block slip at the exact same strain length every time? Why or why not? Consider microscopic differences in the sandpaper texture.
3. Explain how the rubber band demonstrates potential energy and how the slip demonstrates kinetic energy. How does this relate to earthquake seismic waves?
Conclusion Challenge
Based on your observations, why is it extremely difficult for geologists to predict the exact second an earthquake will occur, even if they know stress is building up along a fault?
Tectonic Forces Teacher Guide TEACHER GUIDE
Sequence: Tectonic Forces and Waves
Professional Resource
LESSON 01: FAULT MECHANICS
The "Hook" Tips
When snapping the ruler, emphasize the deformation . Ask students to point out where the ruler is most bent right before the snap. This is the visualization of elastic potential energy.
Common Misconception
Students often think the "slip" is the earthquake. Clarify that the slip causes the waves , and the waves are what we feel as the "earthquake."
Lab Troubleshooting
Ensure sandpaper is coarse (Grit 60-80).
If blocks slip too easily, add more weight.
Remind students to pull slowly and steadily.
LESSON 03: TRIANGULATION HINTS
Station A Distance
640 km
Station B Distance
960 km
Station C Distance
1080 km
Teaching Strategy: Have students use a string and a tack if compasses are unavailable. Focus on the concept that "distance is a radius of possible locations."
LESSON 04: SCALE DIFFERENTIATION
Magnitude (Logarithmic)
Stress the math: $32 \times 32 = 1024$ times more energy between an 8.0 and a 6.0. High schoolers often miss the scale of this difference.
Intensity (Qualitative)
Focus on "The Substrate Challenge." Bedrock vs. Silt is the single biggest predictor of intensity variation in a local area.
RUBRIC: RETROFIT PROPOSAL
CRITERIA
Scientific Justification
Engineering Application
MASTERY (4)
Explains liquefaction & resonance physics perfectly using Newton's Laws.
PROFICIENT (3)
Correctly identifies hazards and suggests appropriate retrofits.
DEVELOPING (2)
Identifies retrofits but lacks clear scientific reasoning.
Seismic Wave Slides WAVES OF ENERGY
Deep-Earth Propagation & Refraction
P-WAVES S-WAVES SURFACE
BODY WAVES
P-Waves
Primary
Compression Motion: Push-pull movement (longitudinal).
Fastest Wave: Arrives first at seismic stations.
Universal: Travels through solids AND liquids.
Visualization: A Slinky being pushed forward.
S-Waves
Secondary
Shear Motion: Up-and-down movement (transverse).
Slower: Arrives second at seismic stations.
Restricted: Cannot travel through liquids (Outer Core).
Visualization: A Slinky being shaken side-to-side.
THE BENDING OF LIGHT... AND EARTH
Seismic Refraction
As waves move into denser layers, they refract (bend) and change speed. This proves Earth's layers are not uniform.
Shadow Zones
The absence of P or S waves at specific distances from an earthquake reveals the size and state of the Liquid Outer Core.
PROBE THE CORE
If S-waves stop at 2,900km depth, what does that tell us about the material at 3,000km depth?
SURFACE WAVES
Most Destructive
Love Waves
Side-to-side motion on the surface. Extremely damaging to building foundations.
Rayleigh Waves
Rolling, elliptical motion (like ocean waves). Moves the ground both up-down and side-to-side.
Epicenter Triangulation Lab Worksheet DATA REPORT: EPICENTER LOCATION
Seismic Network Analysis Task
Student Identification
THE MISSION
A significant seismic event has occurred. You have been provided with data from three seismic monitoring stations. Your task is to calculate the P-S Lag Time for each station, determine the distance to the epicenter using the Travel-Time curve, and triangulate the location on the provided map.
STATION DATA LOG
Station Name P-Wave Arrival S-Wave Arrival Lag Time (sec) Distance (km) Station A (Eureka) 10:04:20 10:05:40 Station B (Boulder) 10:05:00 10:07:00 Station C (Austin) 10:05:30 10:07:45
*Conversion Constant: Every 1 second of lag time ≈ 8km of distance (Simplified for this exercise). For precise results, use your Earth Science Reference Table (ESRT) travel-time graph.
EPICENTER TRIANGULATION MAP
Scale: 1 square = 200km
STATION A
STATION B
STATION C
Procedure Check
Subtract P arrival from S arrival.
Use the lag time to find distance (km).
Set your compass to the correct scale.
Draw circles around each station.
Mark the Epicenter (X) where all three circles intersect.
FINAL ANALYSIS:
Why are three stations the minimum required to find the exact location? What would happen if we only had two?
Measuring Earthquakes Slides HOW DO WE
MEASURE IT?
Distinguishing Magnitude (Science) from Intensity (Experience)
M
Magnitude
I
Intensity
MAGNITUDE: THE ENERGY
Moment Magnitude ($M_w$)
The modern standard. It measures the total energy released by an earthquake based on rock rigidity, fault area, and slip distance.
Logarithmic Scale
Each whole number increase (e.g., 6.0 to 7.0) represents a 32x increase in total energy release.
Energy Comparison
Mag 4.0 Small Firework
Mag 6.0 Hiroshima Bomb
Mag 8.0 Mt. St. Helens Eruption
Mag 9.0+ Massive Mega-Quake
INTENSITY: THE DAMAGE
Modified Mercalli Scale
A qualitative scale (I to XII) measuring human observation and building damage. It changes based on where you are relative to the epicenter.
Factors Influencing Intensity:
Distance from Epicenter
Depth of Focus (shallow = more damage)
Local Substrate (Rock vs. Mud)
Building Structure Quality
II
Felt by few
VI
Felt by all; heavy furniture moved
IX
Panic; masonry destroyed
XII
Total Destruction; Waves seen on ground
CASE STUDY: THE SUBSTRATE EFFECT
"The same magnitude 6.5 earthquake hits two nearby cities..."
City A: Bedrock Base
Buildings anchored into solid granite. Waves pass through quickly with low amplitude.
Intensity: V (Moderate)
City B: Soft Mud / Fill
Buildings sitting on loose, saturated soil. Waves slow down, amplify, and cause Liquefaction.
Intensity: IX (Violent)
Liquefaction
When solid ground begins to behave like a liquid under seismic stress. Foundations sink, buildings tilt, and infrastructure collapses.
Seismic Retrofit Challenge Worksheet SEISMIC RETROFIT BRIEF
Project: Civil Engineering & Hazard Mitigation
Client
SafeZone Municipal Dept.
URGENT
SITE ANALYSIS: DISTRICT 7
District 7 sits approximately 15km from the San Jacinto Fault. Recent geological surveys indicate the district is built on unconsolidated alluvial silt with a shallow water table. Your engineering firm must evaluate two existing building designs and propose retrofits to survive a projected Magnitude 7.2 event.
Primary Hazard: Liquefaction
Due to soft soil and water content, ground shaking will likely turn solid earth into "quicksand," causing heavy structures to sink or tilt.
Primary Hazard: Resonance
Building frequency matches seismic wave frequency, leading to uncontrolled swaying and structural collapse.
ENGINEERING CHALLENGE: STRUCTURE 01
Blueprint Mockup: Unreinforced Masonry
Building Type: Old Brick Hospital (4 Stories)
Main Weakness: Brittle material, no lateral flexibility.
PROPOSED RETROFITS:
Steel X-Bracing: Adding external steel trusses to absorb lateral shear forces.
Base Isolators: Placing the building on rubber/lead bearings to disconnect it from ground motion.
Shear Walls: Reinforcing central elevator shafts with thick concrete to resist twisting.
ENGINEERING JUSTIFICATION: Which retrofit(s) would be most effective for a brick building on soft soil? Explain the physics of your choice.
DESIGN REFLECTION: THE TUNED MASS DAMPER
Skyscraper System
High-rise buildings often use a Tuned Mass Damper (TMD) —a massive weight suspended near the top of the building. During an earthquake, as the building sways to the right, the TMD swings to the left.
1. Explain how Newton's Third Law (Action/Reaction) or the concept of Inertia applies to how a Tuned Mass Damper protects a building.
2. If you were a city planner, would you focus more on retrofitting individual buildings or improving early-warning systems? Justify your priority based on risk versus cost.