Visual presentation for the lesson on plant hormones and tropisms, explaining the roles of auxin, gibberellins, ABA, and ethylene, as well as the mechanisms of phototropism and gravitropism.
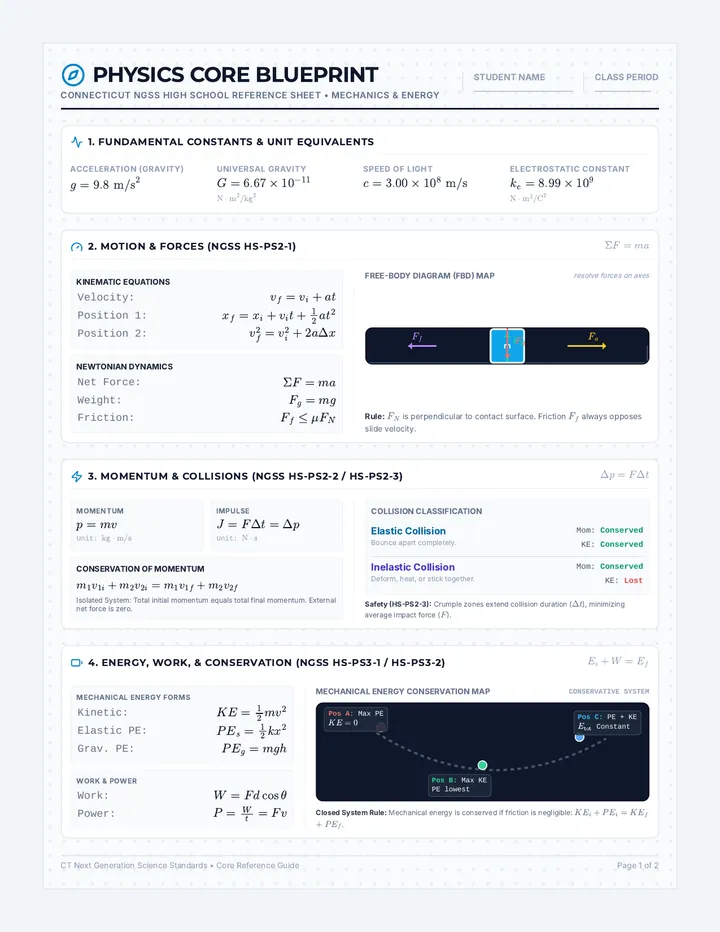
A comprehensive high school physics curriculum sequence aligned with the Connecticut Next Generation Science Standards (CT-NGSS), focusing on core concepts, quantitative problem-solving, and visual models.
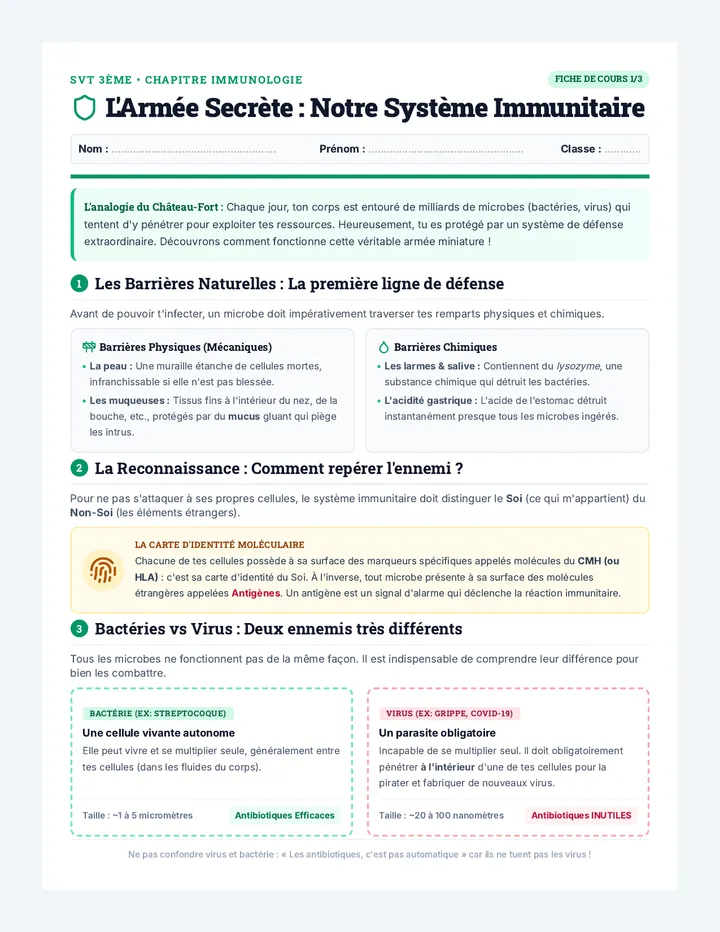
Une leçon complète et ultra-pédagogique de SVT (niveau 3ème) sur le système immunitaire. Conçue avec des analogies percutantes, des schémas structurés et des outils de révision active pour garantir la compréhension et la mémorisation de tous les élèves.
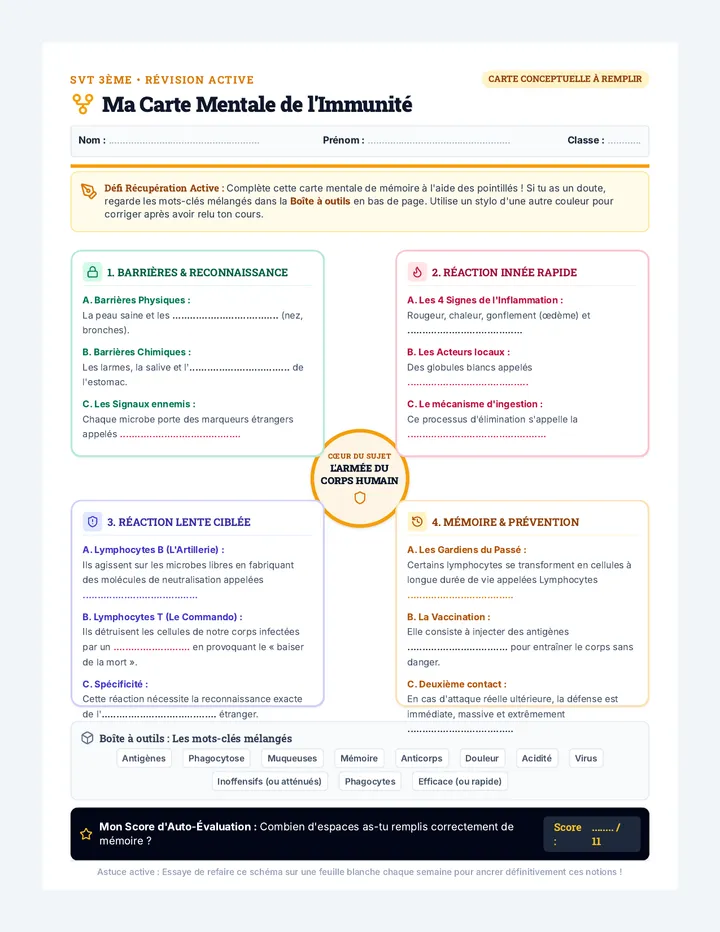
Un schéma conceptuel actif (carte mentale à compléter) conçu pour stimuler la mémorisation active des élèves. Structuré en 4 branches clés avec des zones à remplir, une boîte à mots d'aide et un encadré d'auto-évaluation.
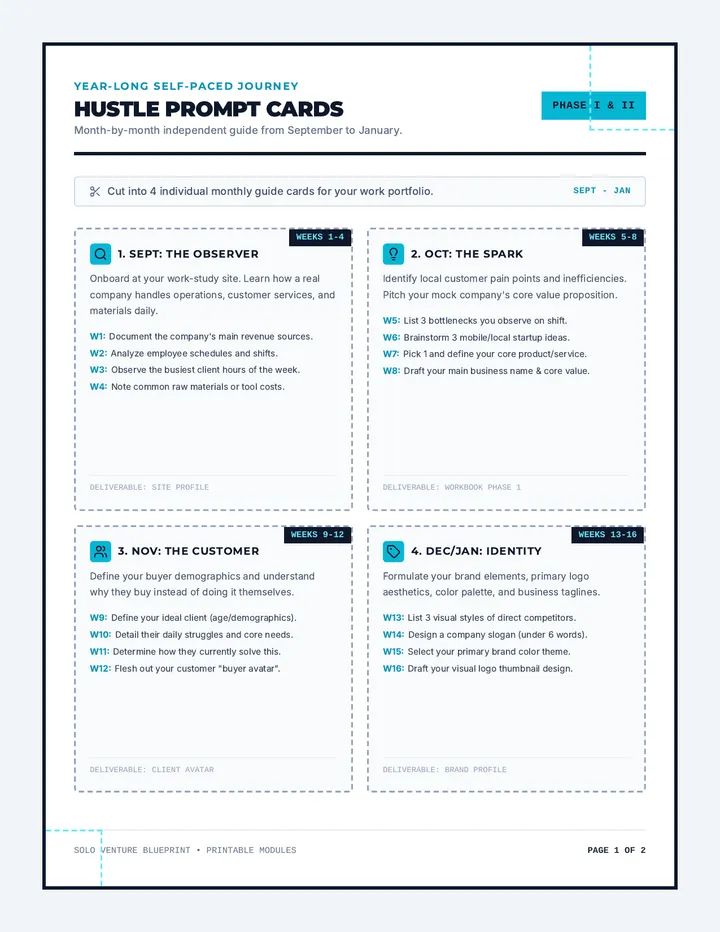
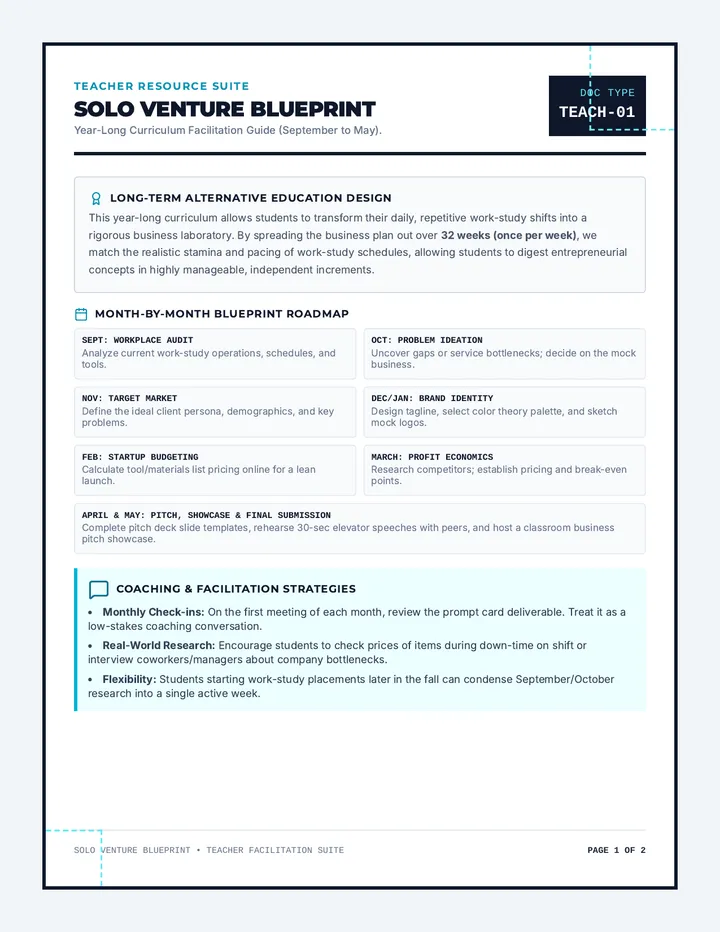
A year-long, self-paced entrepreneurship curriculum spanning September to May for alternative education students in work-study placements. Students transform real-world work experience into a modular business plan and slide presentation.
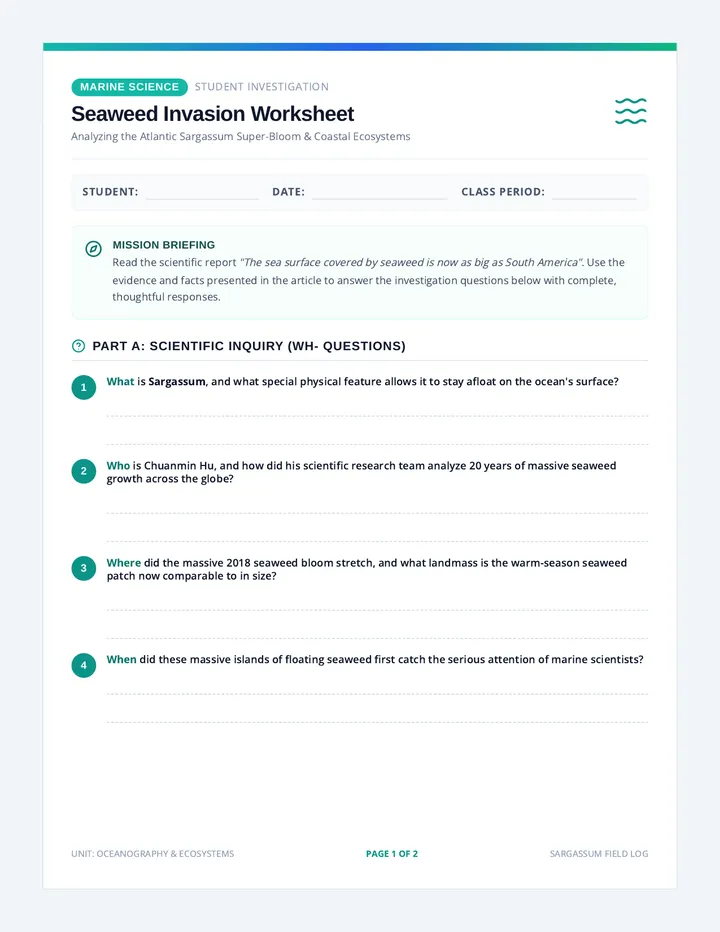
A science lesson investigating the massive Sargassum seaweed bloom stretching across the Atlantic Ocean. Students explore its ecological benefits in the open ocean, the hazards it poses to coastlines, and the human and environmental factors driving its growth.
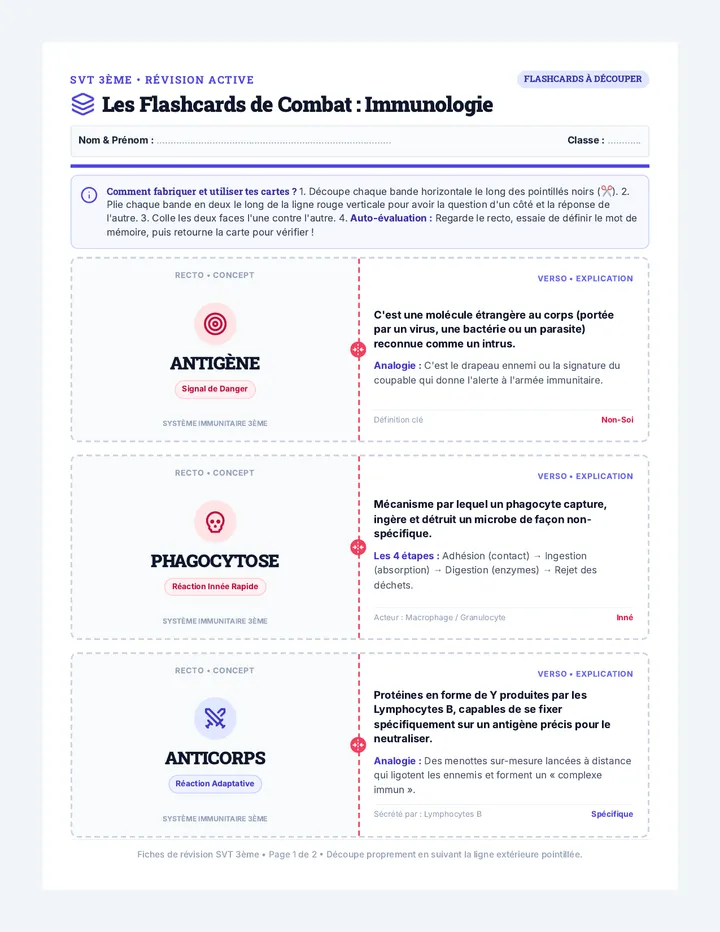
Une planche de 6 flashcards de révision à découper et à plier. Idéal pour travailler l'association terme-définition et réviser activement le vocabulaire clé de l'immunologie (Antigène, Anticorps, Phagocytose, Lymphocytes B et T, Vaccin).
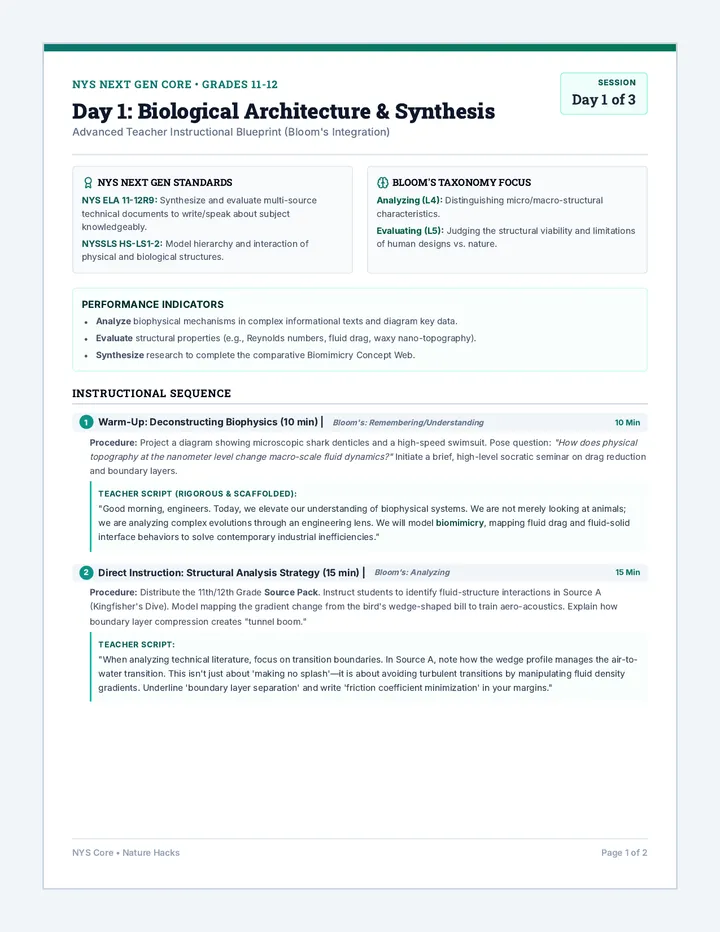
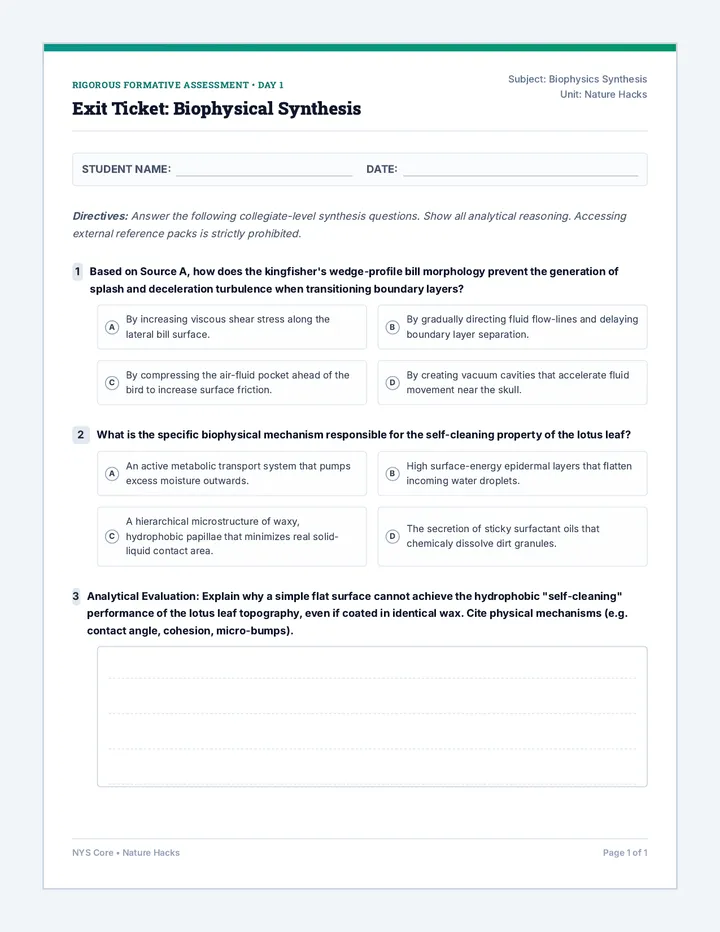
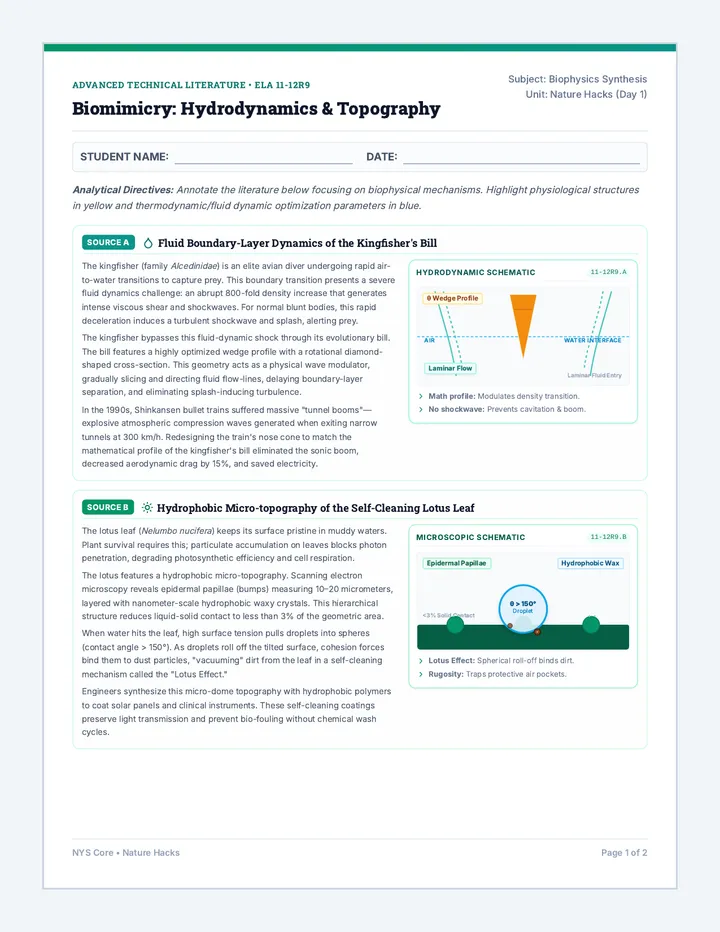
A 3-day cross-curricular STEAM unit where students research biological adaptations, design biomimetic engineering solutions, perform scale calculations, and write a synthesized informational article.
A collection of foundational reference sheets, formula grids, and problem-solving templates designed to support Connecticut high school physics students across all NGSS units.
Un cours complet de SVT niveau 3ème en 3 pages. Intègre désormais des schémas vectoriels précis et esthétiques (étapes de la phagocytose, complexes antigène-anticorps, et le "baiser de la mort" des lymphocytes T) pour une compréhension visuelle immédiate.
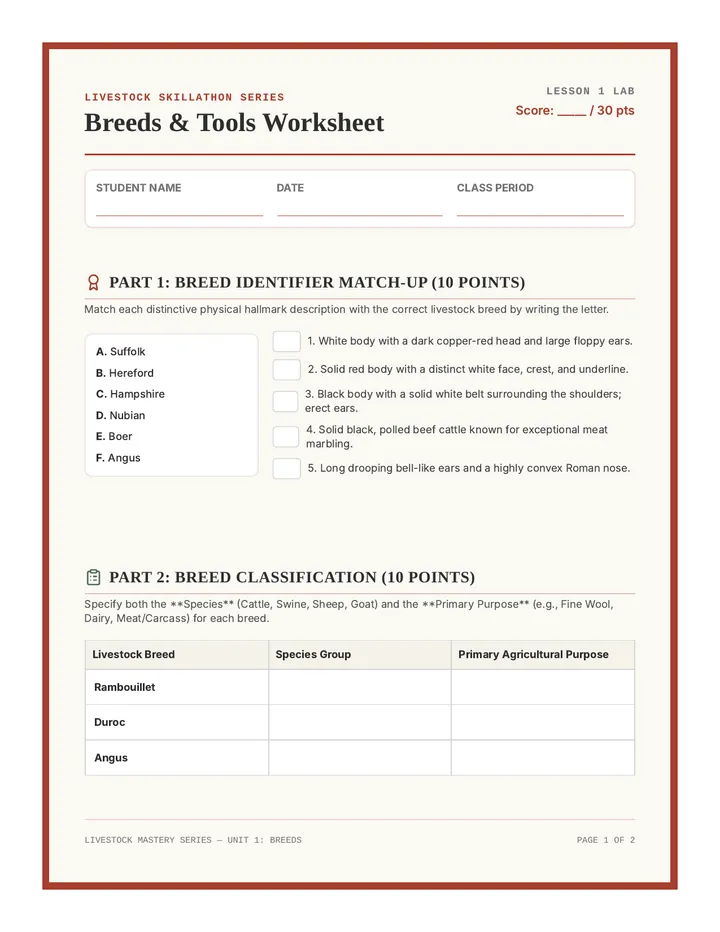
An immersive preparation program that equips agriculture students with the hands-on identification and evaluation skills needed to conquer competitive Livestock Skillathon contests.
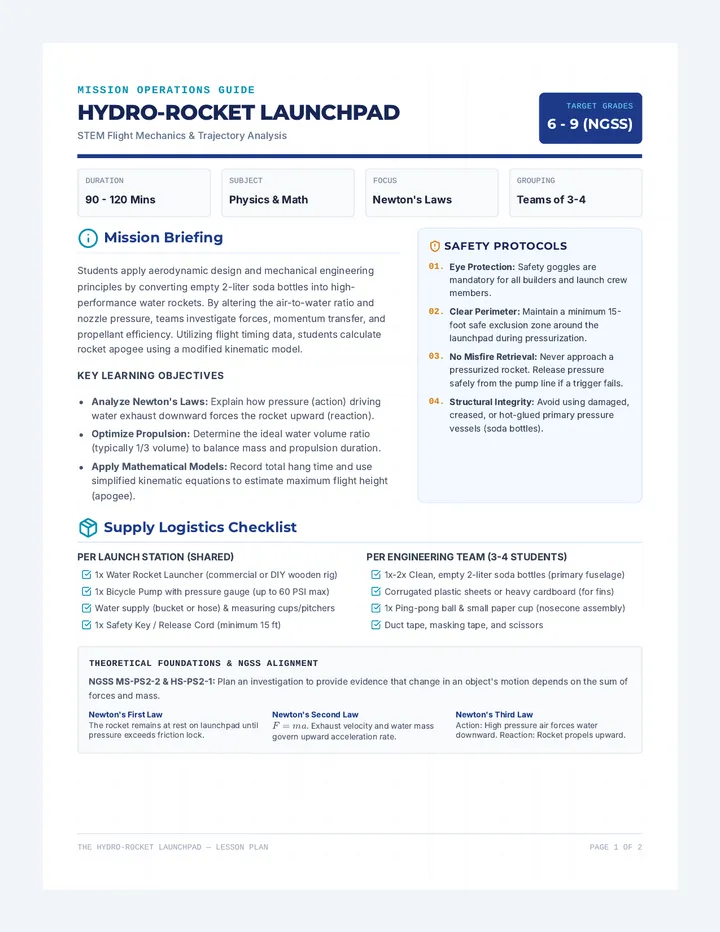
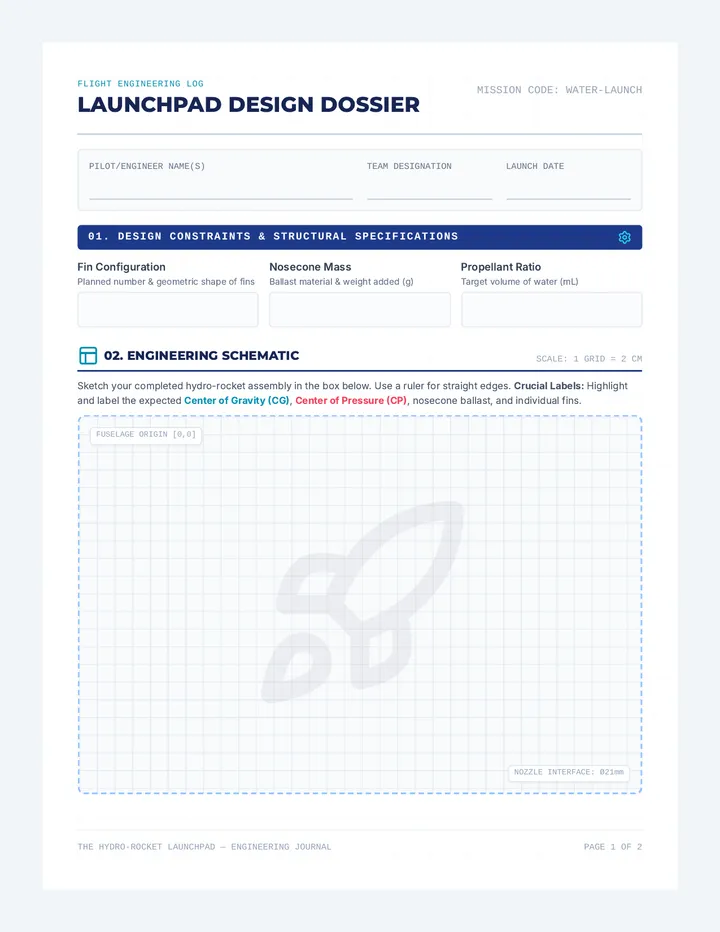
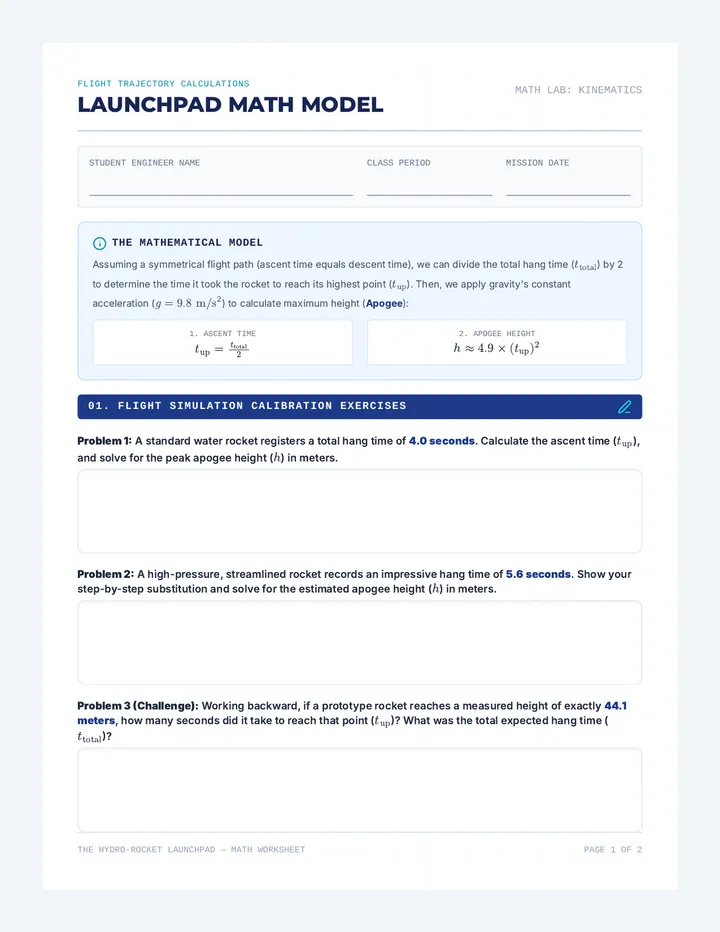
A comprehensive STEM lesson where students design, build, and launch water bottle rockets to explore pressure, volume, and Newton's laws. Students apply physics principles and mathematical formulas to model trajectories and calculate apogee height from hang time.
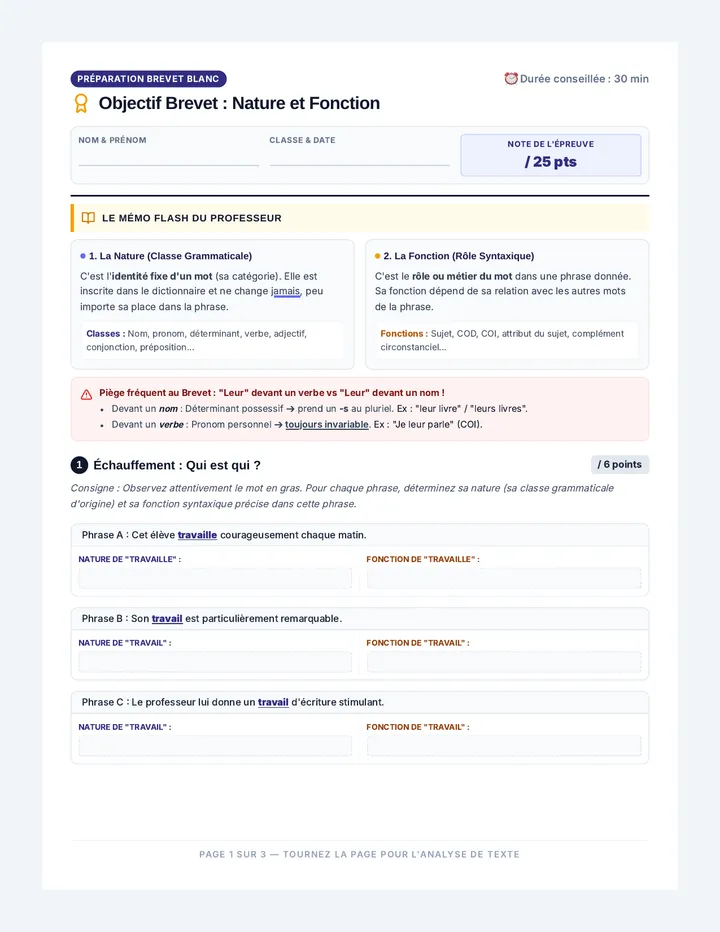
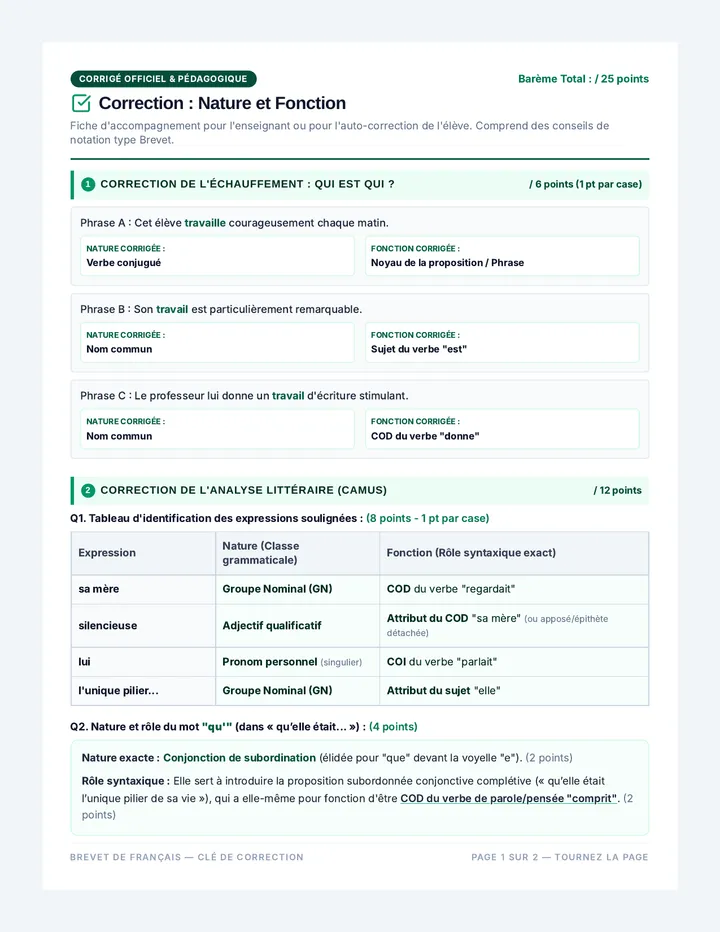
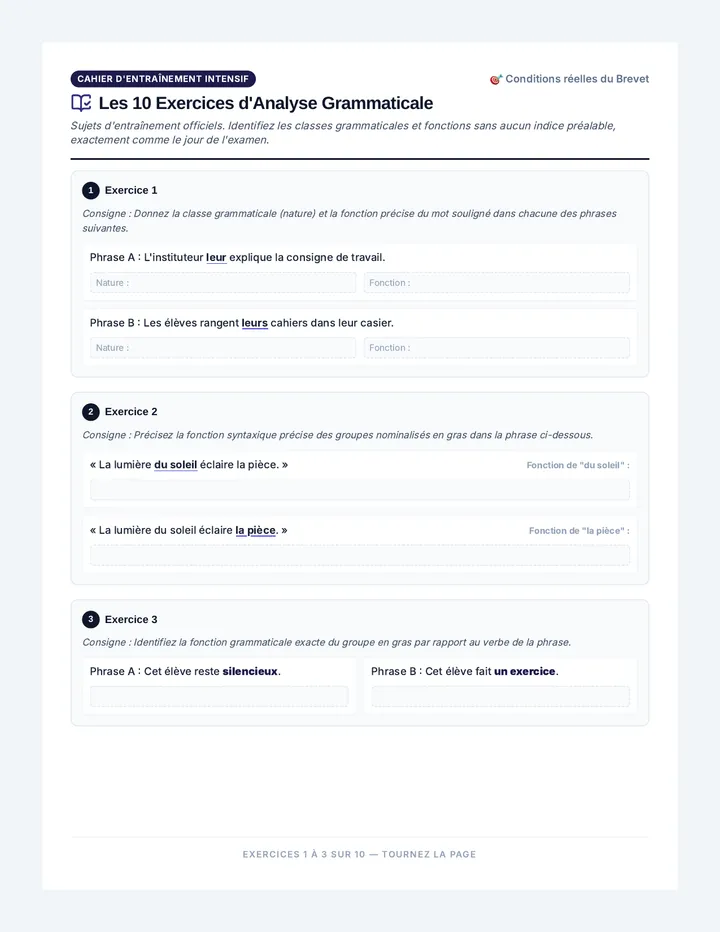
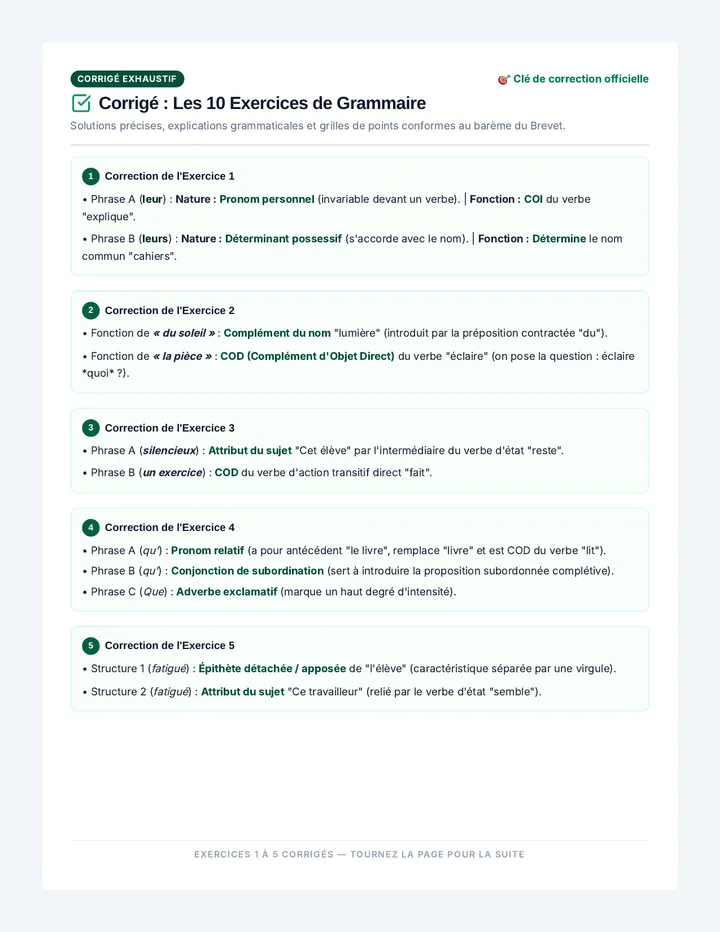
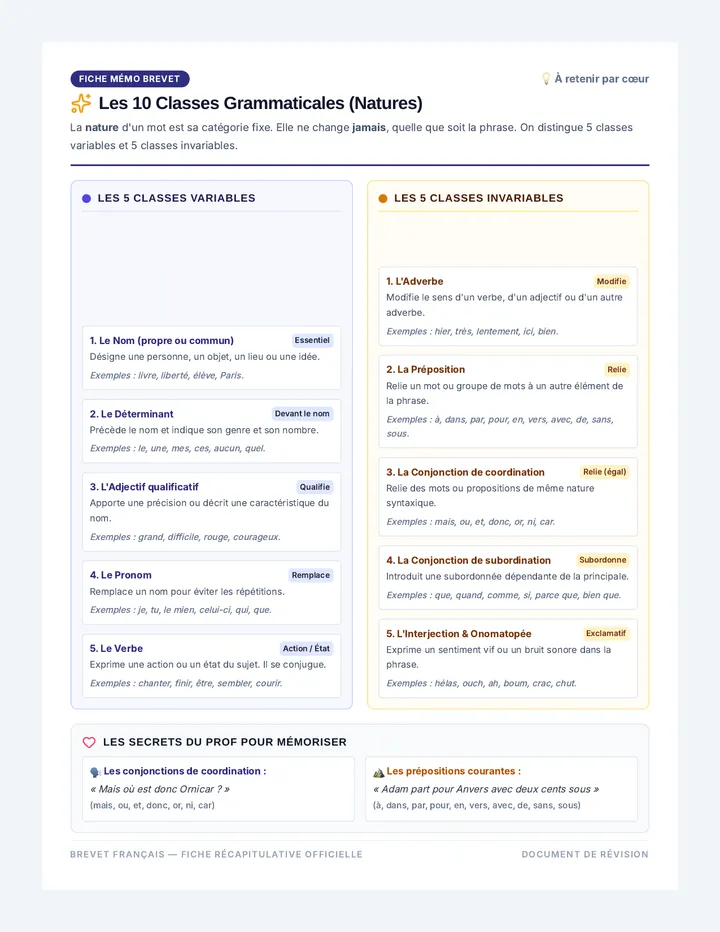
Un programme complet de révision intensive pour le Brevet, regroupant des fiches, exercices et corrigés détaillés en français et en physique-chimie.