A 6th-grade science lesson focused on identifying independent and dependent variables through a yeast and cellular respiration experiment. Students use a real-world demonstration to distinguish between control and experimental groups.
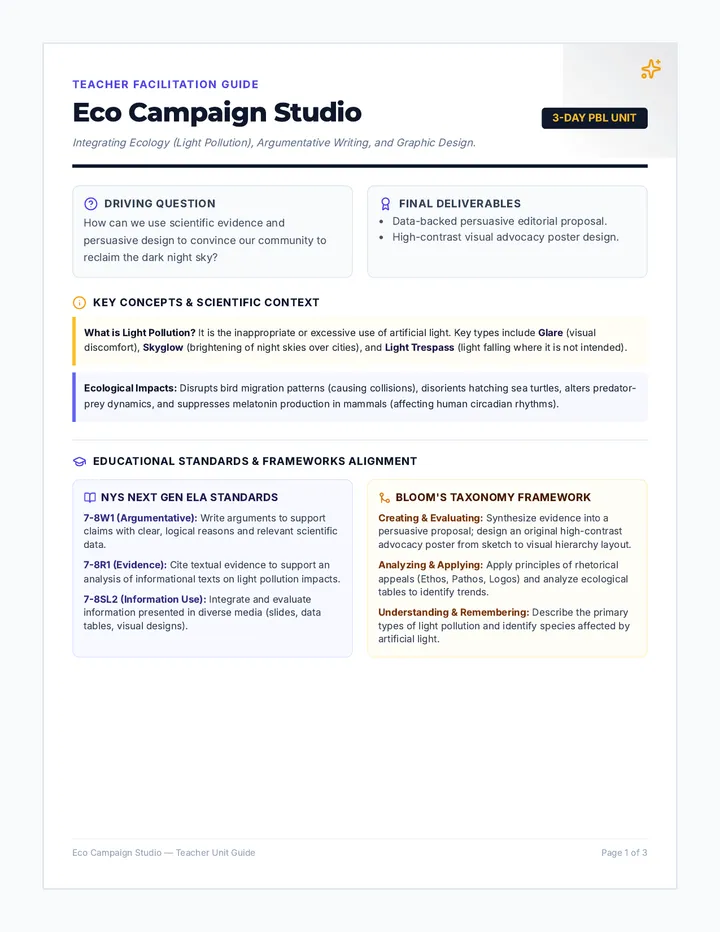
A cross-curricular, 3-day project-based unit combining science, argumentative writing, and graphic design. Students investigate the ecological impacts of light pollution, write a data-driven persuasive proposal, and design a community awareness campaign poster.
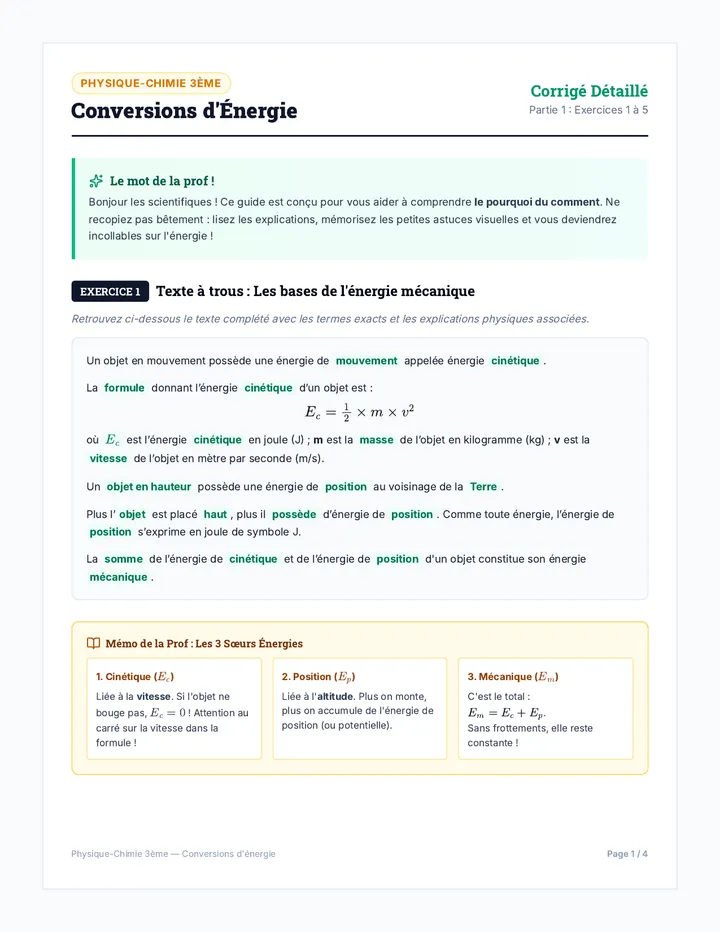
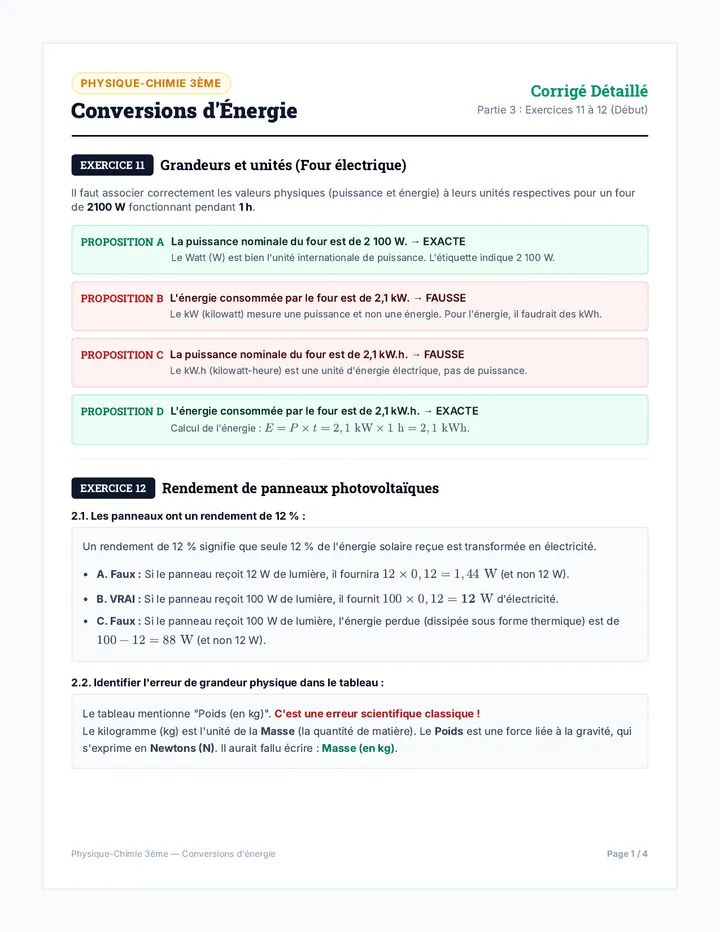
Corrigé ultra-pédagogique et complet des 15 exercices de physique-chimie de 3ème sur les conversions d'énergie. Conçu pour faciliter la compréhension profonde, avec des fiches mémo et des astuces visuelles pour mémoriser les formules clés.
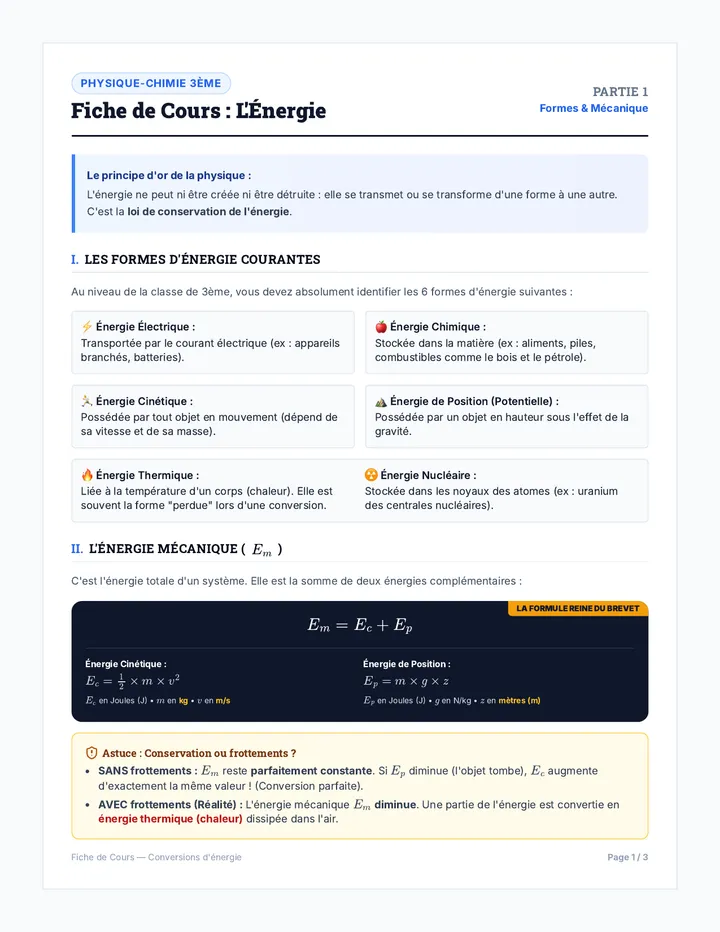
Cours complet, structuré et ultra-pédagogique sur les conversions d'énergie pour les élèves de 3ème. Contient des explications claires, des exemples concrets et des astuces indispensables pour réussir le brevet.
An immersive preparation program that equips agriculture students with the hands-on identification and evaluation skills needed to conquer competitive Livestock Skillathon contests.
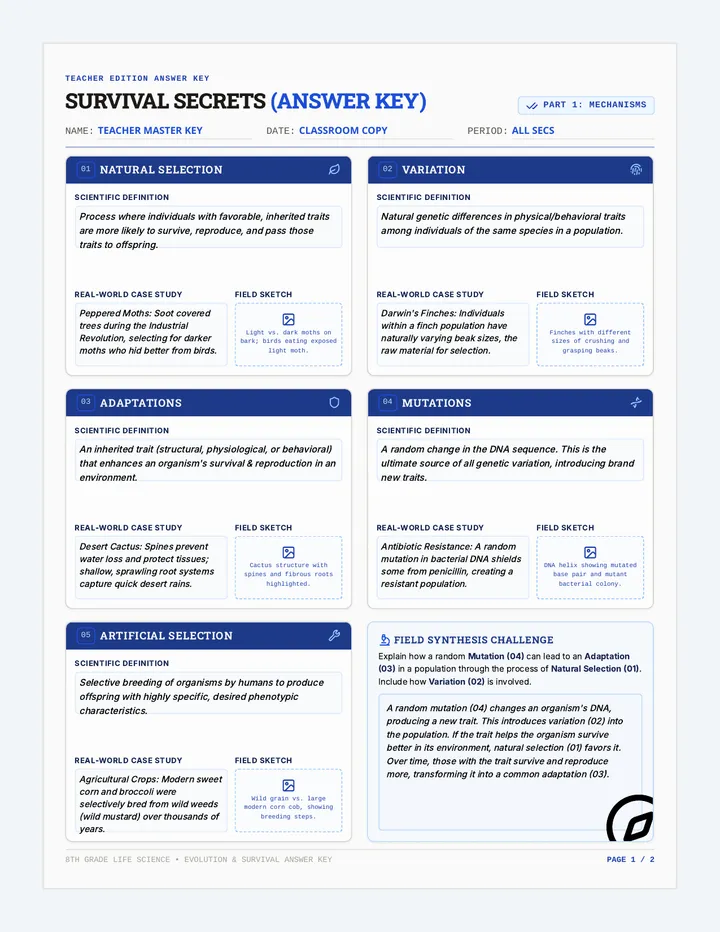
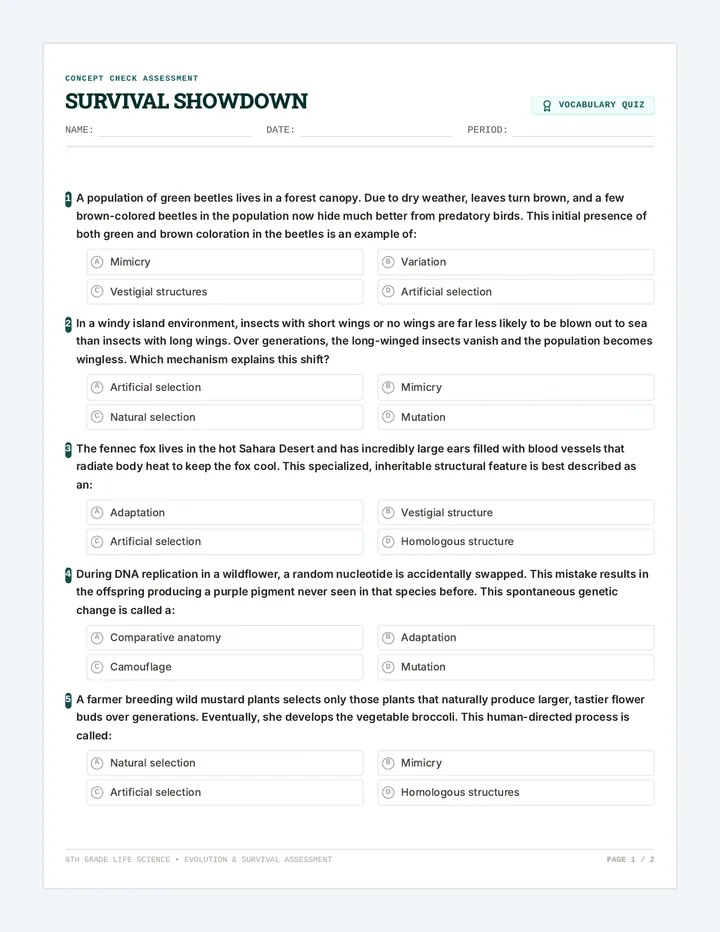
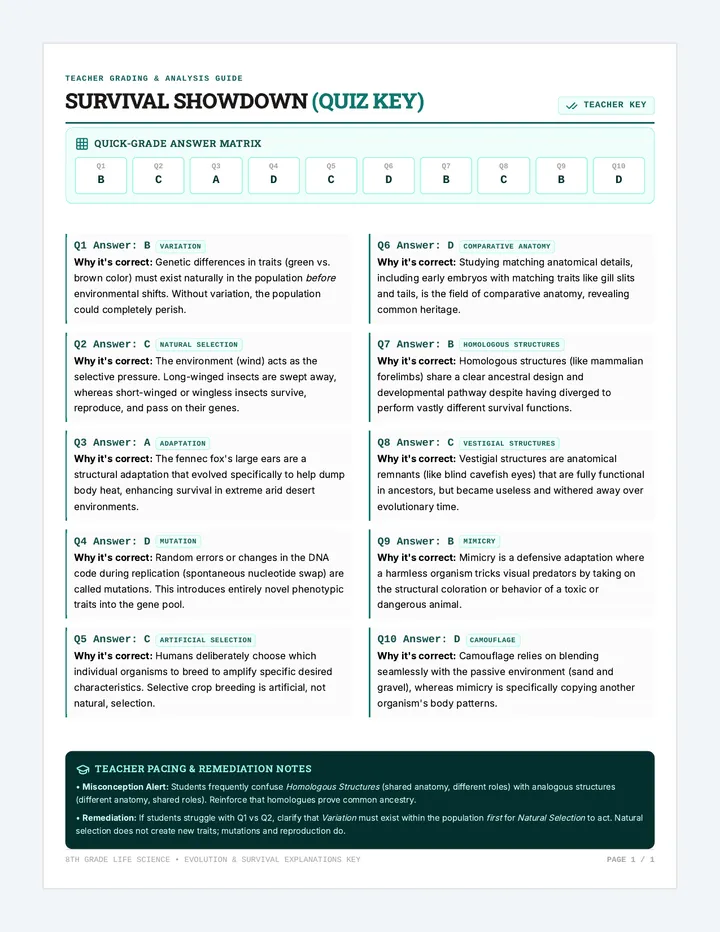
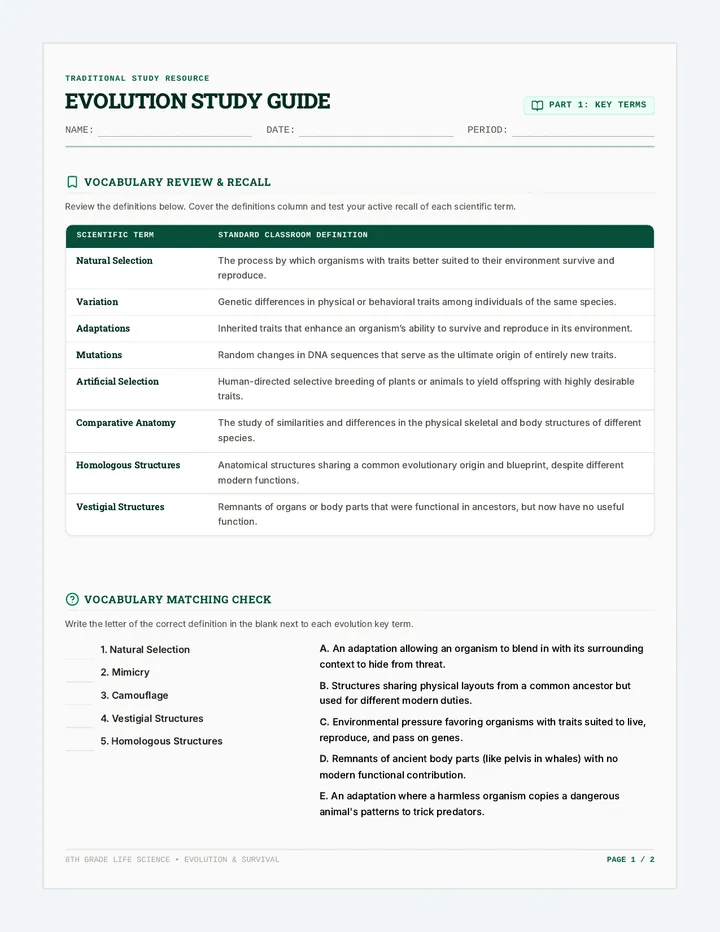
An active-recall study unit on natural selection and evolutionary evidence, featuring graphic organizers, application activities, and a practice quiz.
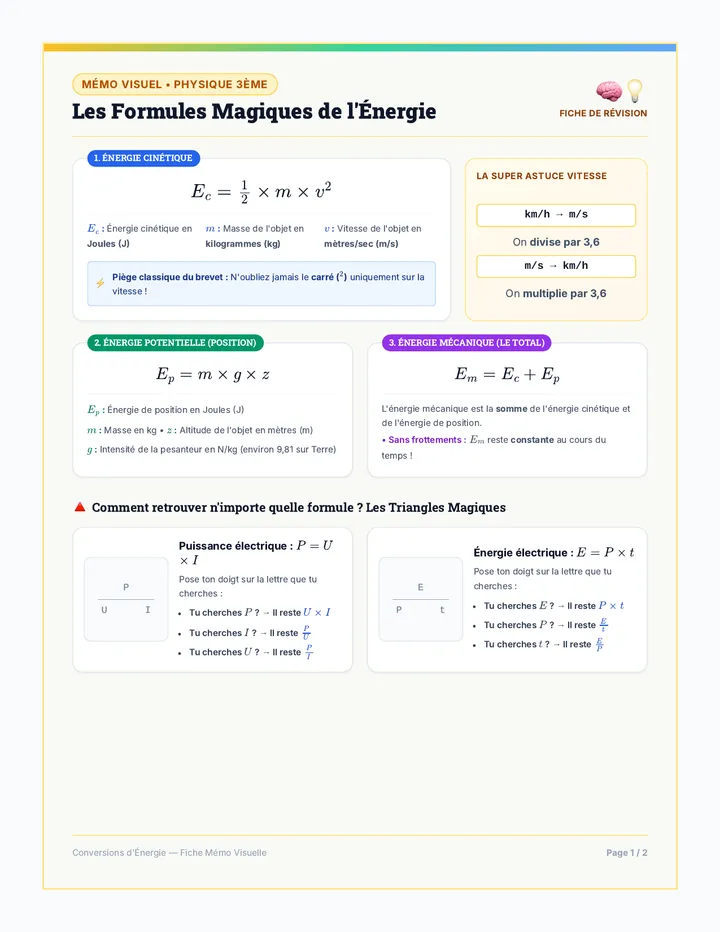
Fiches mémo synthétiques contenant des cartes mentales, des triangles magiques de formules et des astuces visuelles indispensables pour retenir les formules clés de physique-chimie de 3ème sur l'énergie.
Un programme complet de révision intensive pour le Brevet, regroupant des fiches, exercices et corrigés détaillés en français et en physique-chimie.
An interactive lesson introducing elementary or middle school students to the three major divisions of the brain: the Cerebrum, Cerebellum, and Brain Stem.
Troisième partie du corrigé ultra-pédagogique sur les conversions d'énergie (Exercices 11 à 15). Traite du fonctionnement des fours, des panneaux solaires, des thermoplongeurs d'aquarium, du navire écologique MANTA et des véhicules électriques.
A comprehensive unit on rainforest ecology, climate regulation, and conservation. Students explore the structural layers of the rainforest, their roles as carbon sinks, the threats of deforestation, and collaborative solutions for preservation.
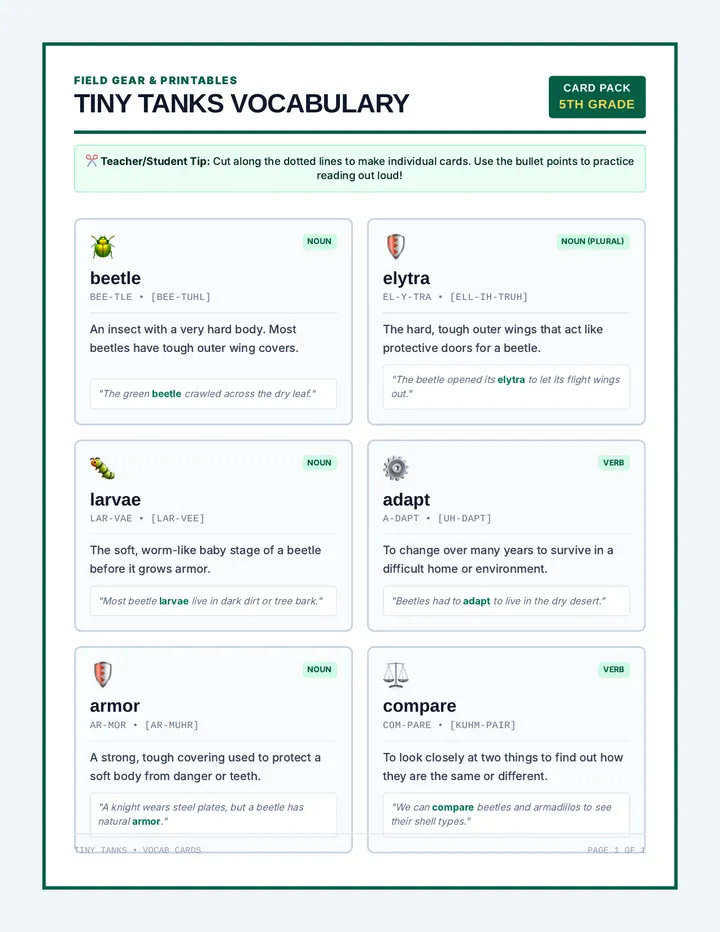
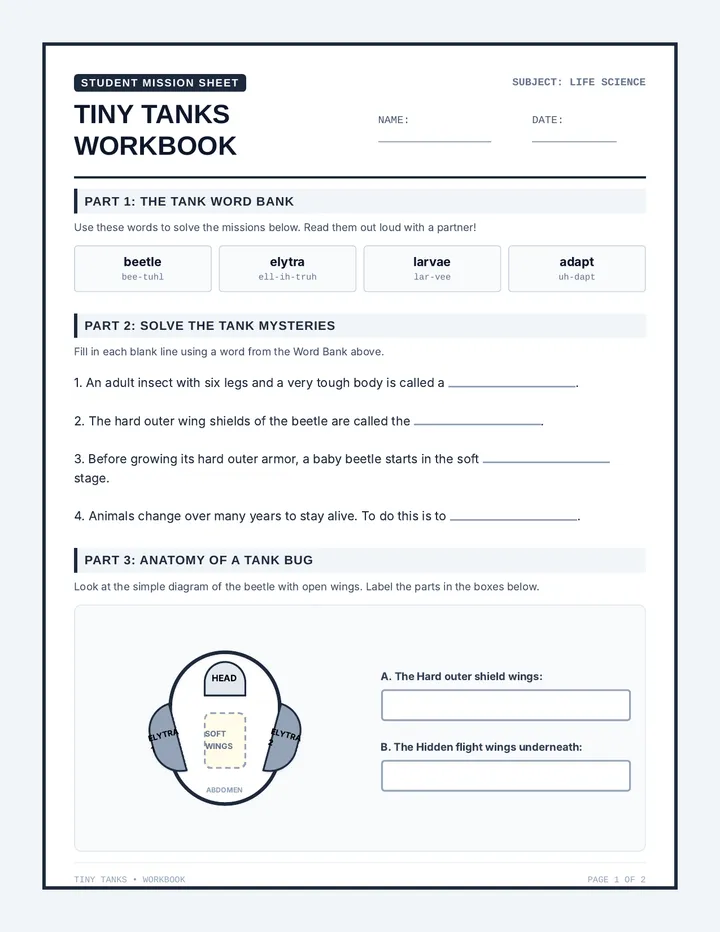
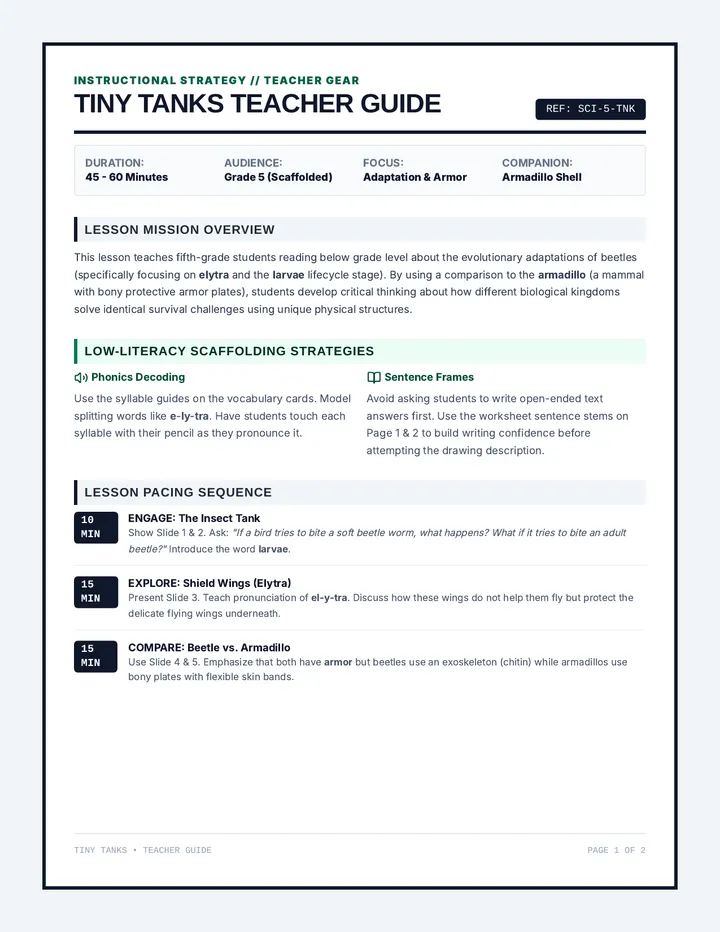
An engaging, highly visual science lesson exploring beetles as the armored tanks of the insect world, designed specifically for fifth-grade students reading below grade level. Students learn about elytra, beetle adaptation, and compare insect armor to that of the armadillo through scaffolded activities.
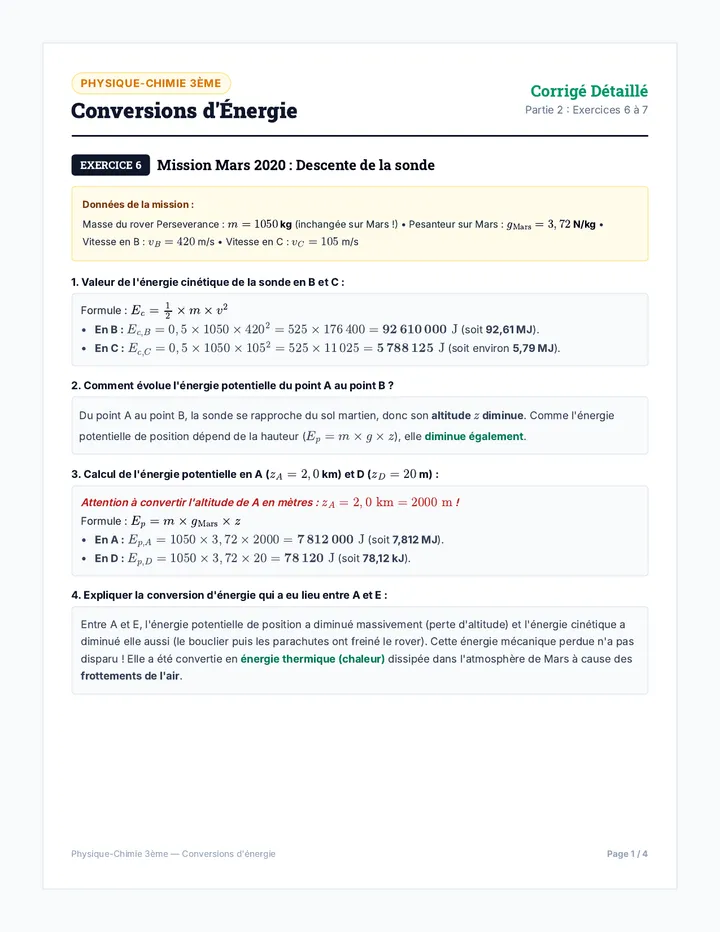
Deuxième partie du corrigé ultra-pédagogique sur les conversions d'énergie (Exercices 6 à 10). Comprend des explications de physique spatiale, de thermique du bâtiment, d'énergétique musculaire et industrielle.