Students analyze charts and graphs to identify manipulation techniques, such as truncated Y-axes or inconsistent scales. They learn to read raw data tables to verify visual claims.
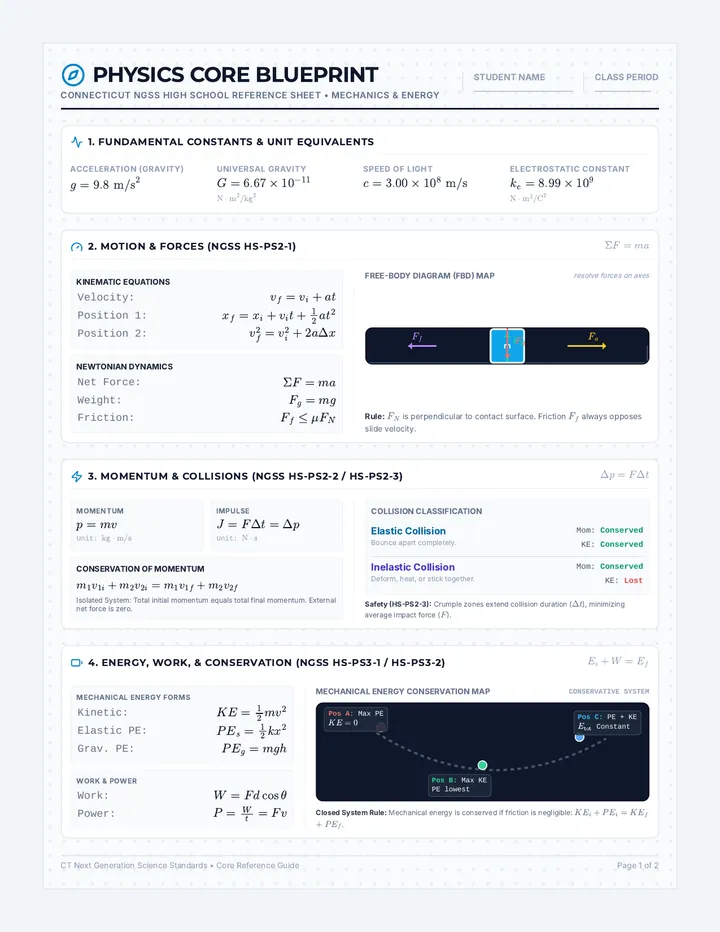
A comprehensive high school physics curriculum sequence aligned with the Connecticut Next Generation Science Standards (CT-NGSS), focusing on core concepts, quantitative problem-solving, and visual models.
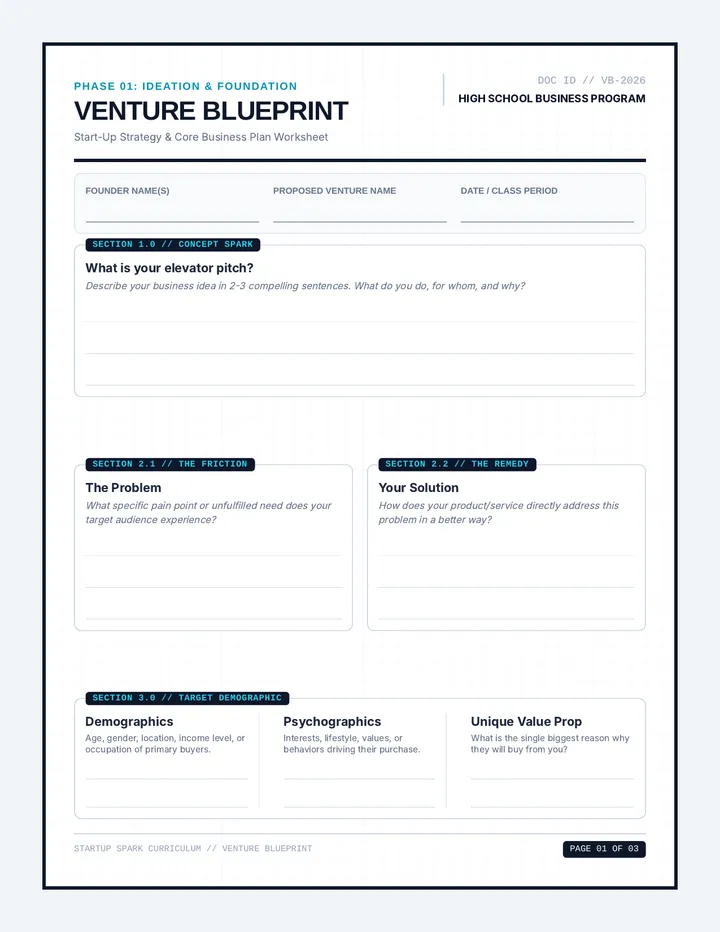
A comprehensive, step-by-step framework for high school students to design, structure, and refine a small business startup concept. Includes guided drafting templates, pacing checklists, and pitch preparation tools.
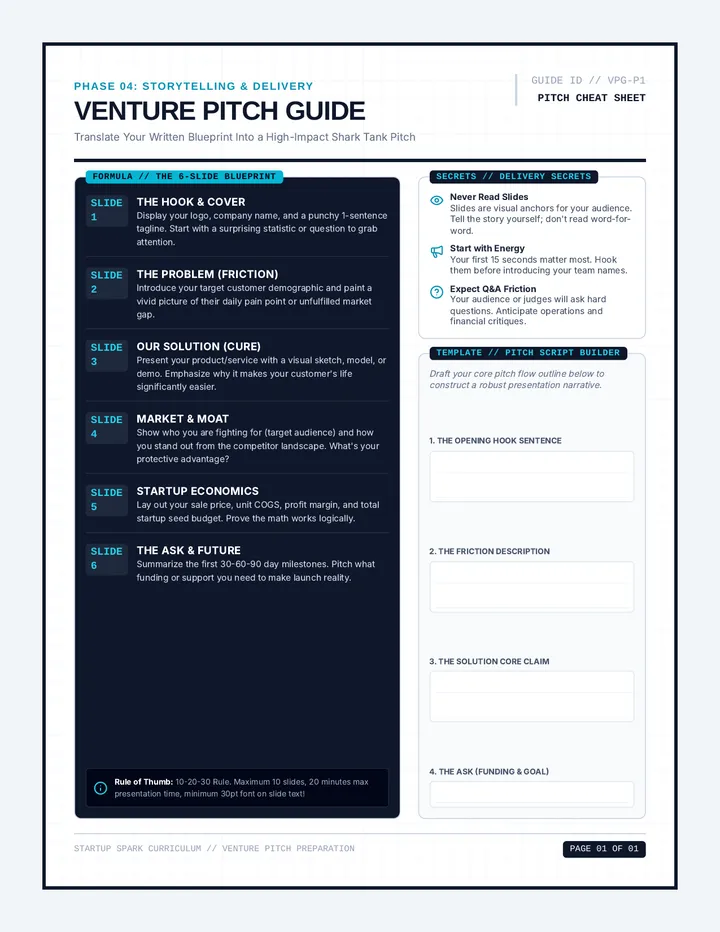
A student-facing companion reference and cheat sheet for building a 3-minute business pitch presentation. This single-page blueprint features a slide-by-slide content guide, executive delivery secrets, and an interactive presentation script builder.
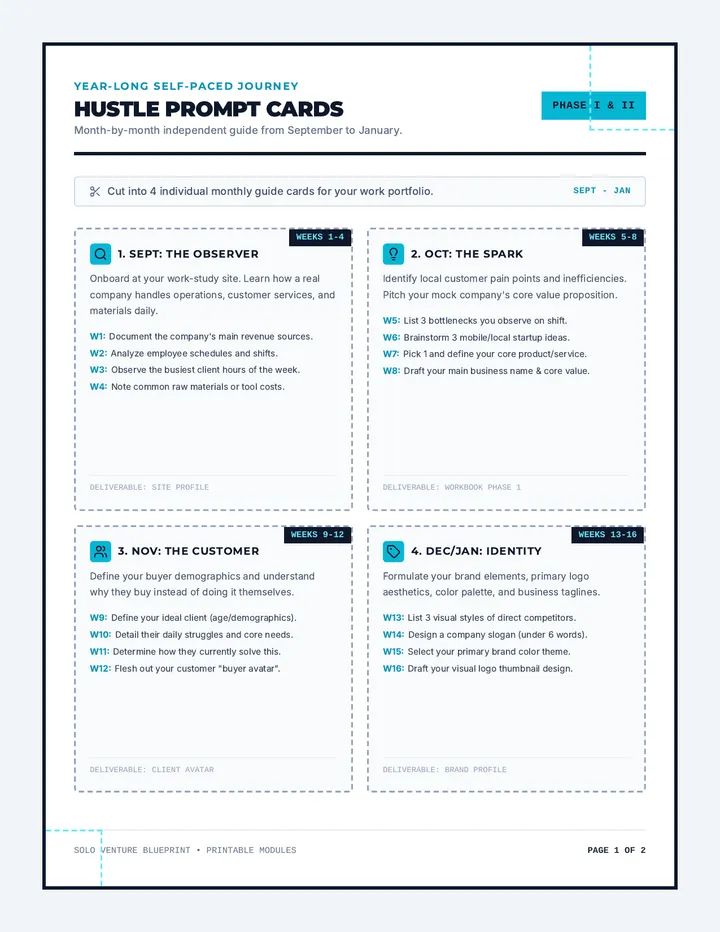
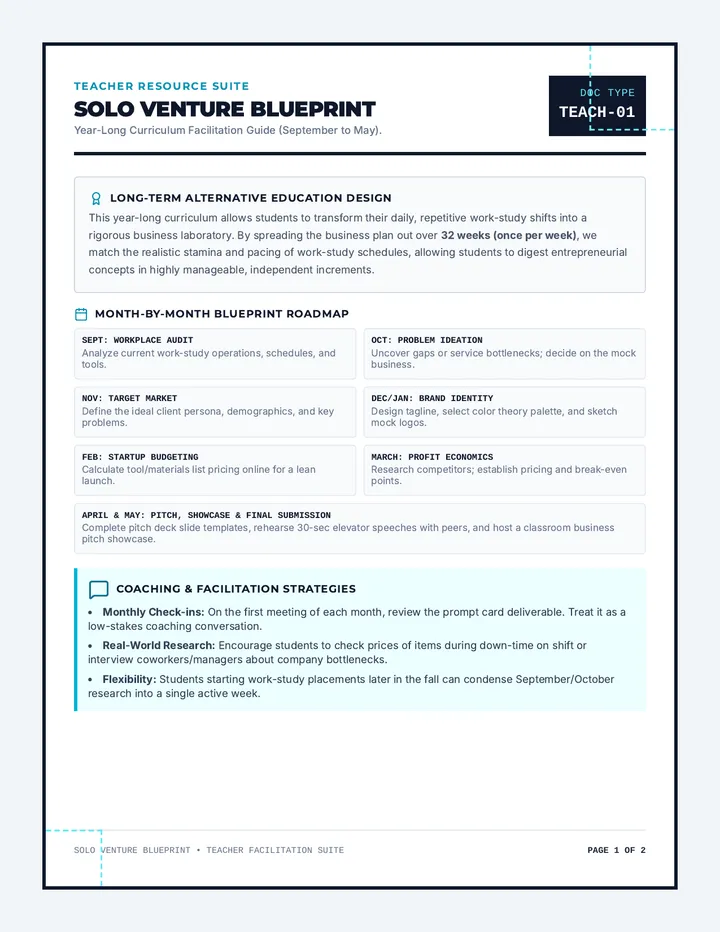
A year-long, self-paced entrepreneurship curriculum spanning September to May for alternative education students in work-study placements. Students transform real-world work experience into a modular business plan and slide presentation.
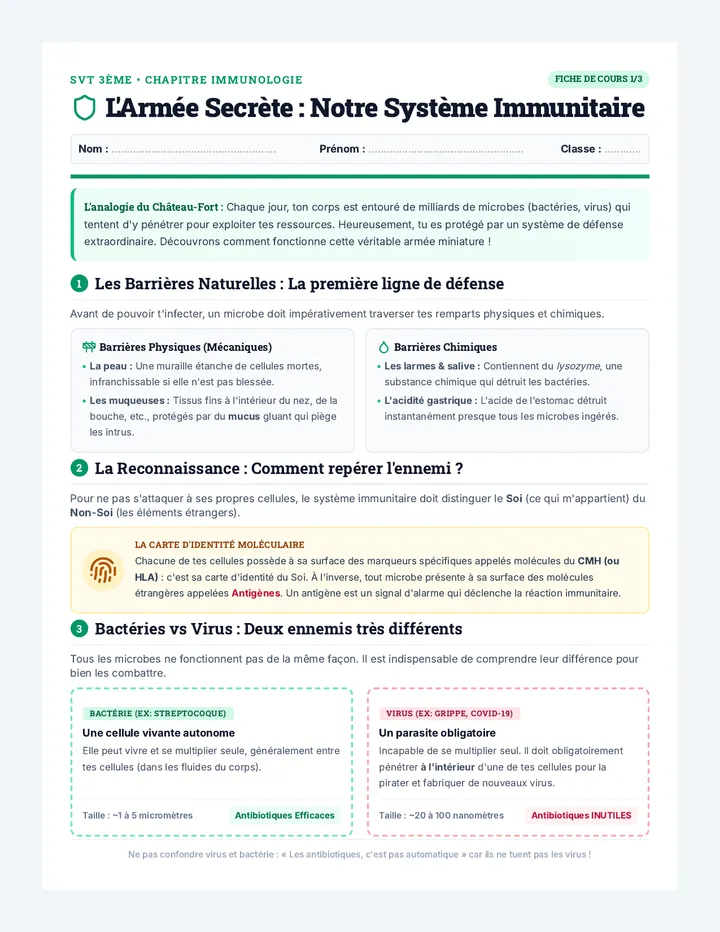
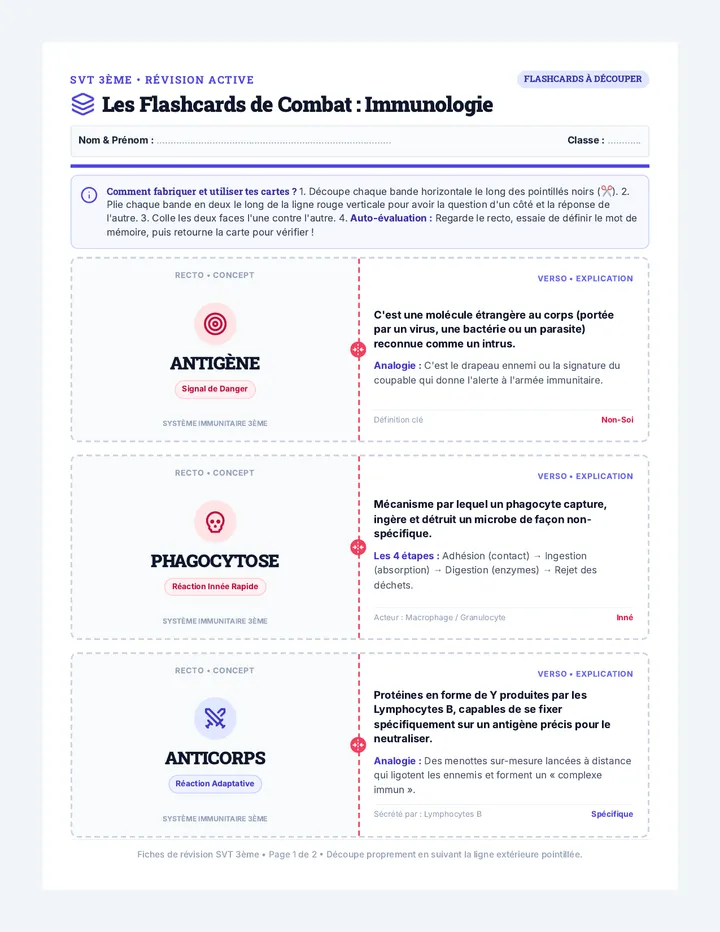
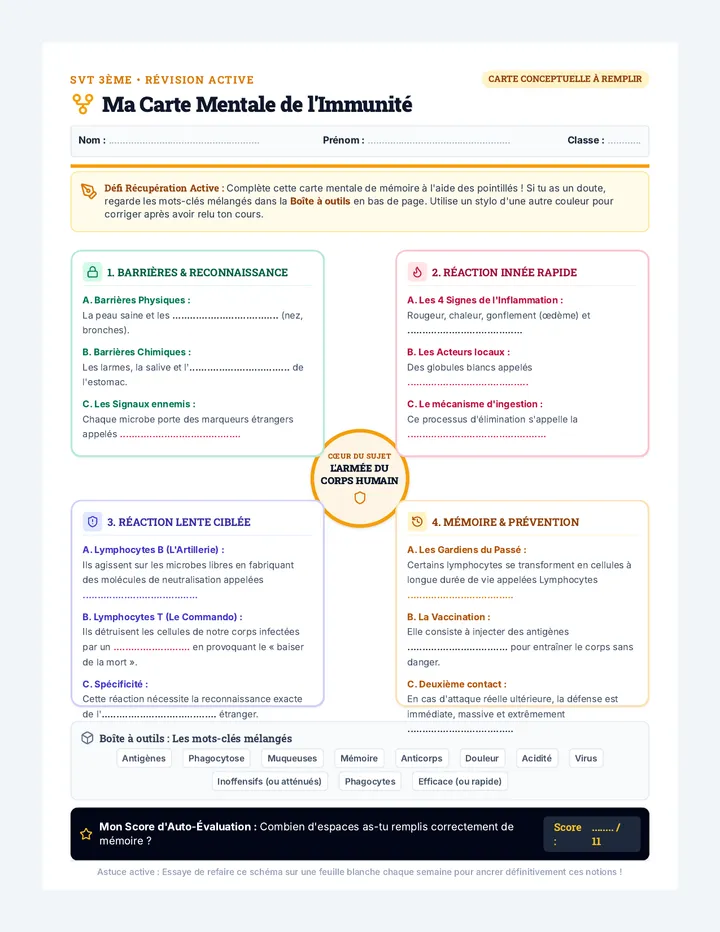
Une leçon complète et ultra-pédagogique de SVT (niveau 3ème) sur le système immunitaire. Conçue avec des analogies percutantes, des schémas structurés et des outils de révision active pour garantir la compréhension et la mémorisation de tous les élèves.
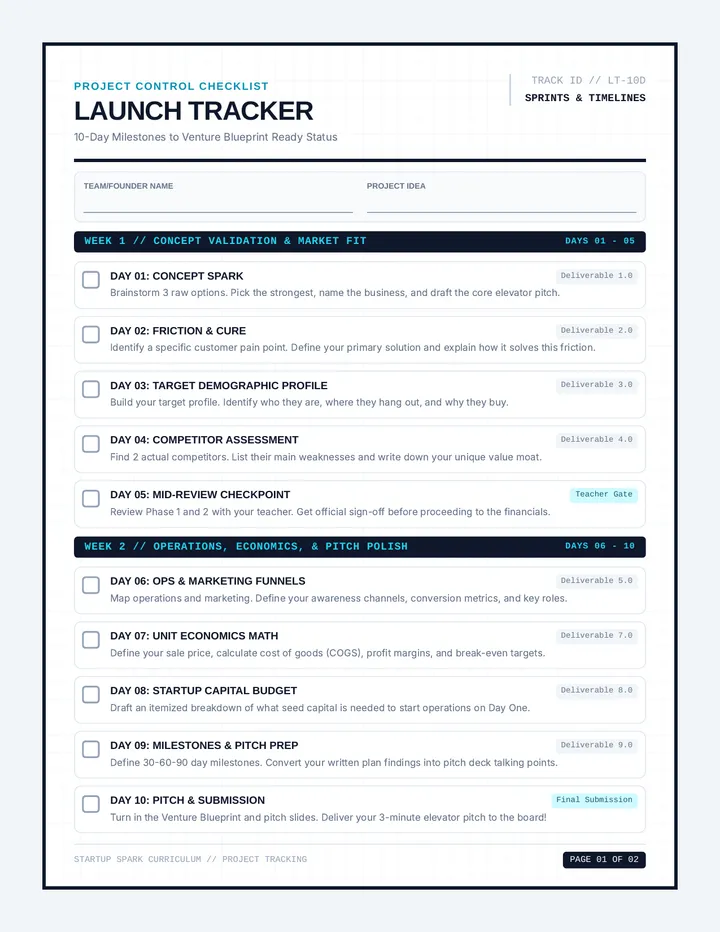
A student-facing daily pacing planner and a detailed teacher grading rubric. Styled with a professional project-tracking timeline grid, this 2-page document includes a 10-day sprint checklist and an analytical 100-point rubric matrix.
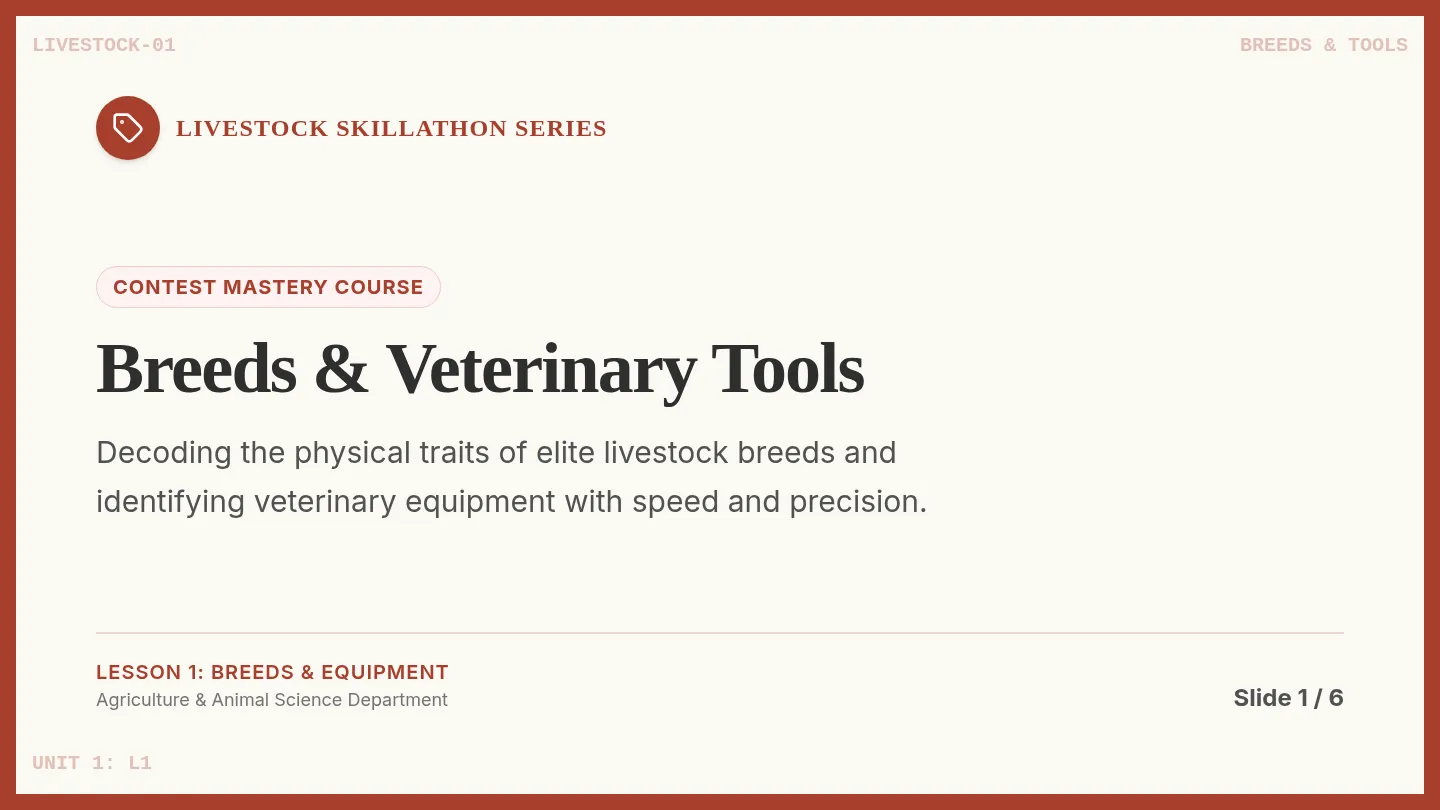
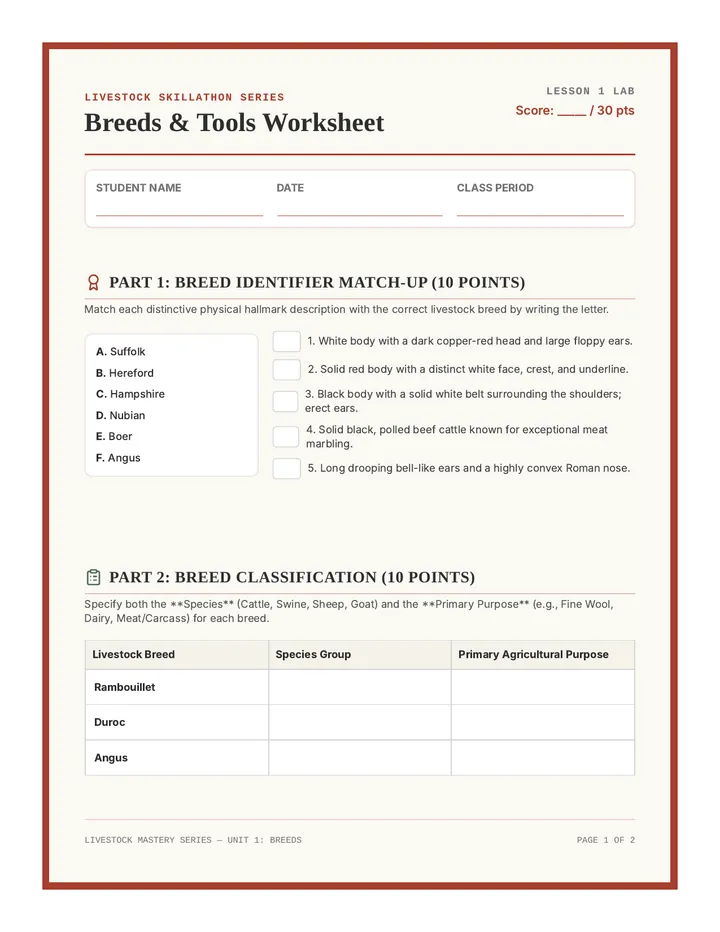
An immersive preparation program that equips agriculture students with the hands-on identification and evaluation skills needed to conquer competitive Livestock Skillathon contests.
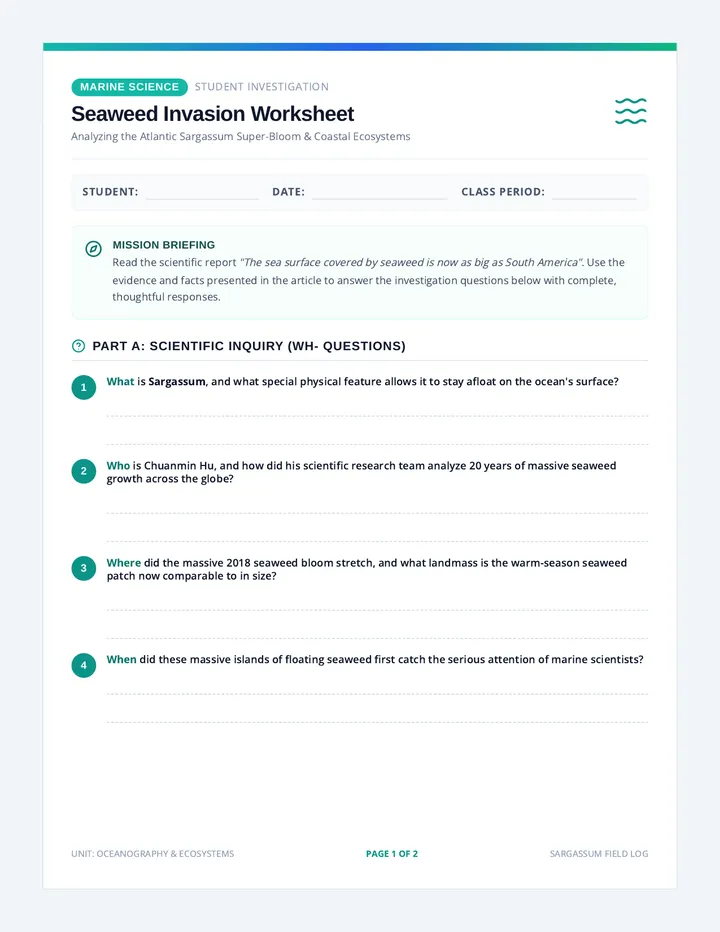
A science lesson investigating the massive Sargassum seaweed bloom stretching across the Atlantic Ocean. Students explore its ecological benefits in the open ocean, the hazards it poses to coastlines, and the human and environmental factors driving its growth.
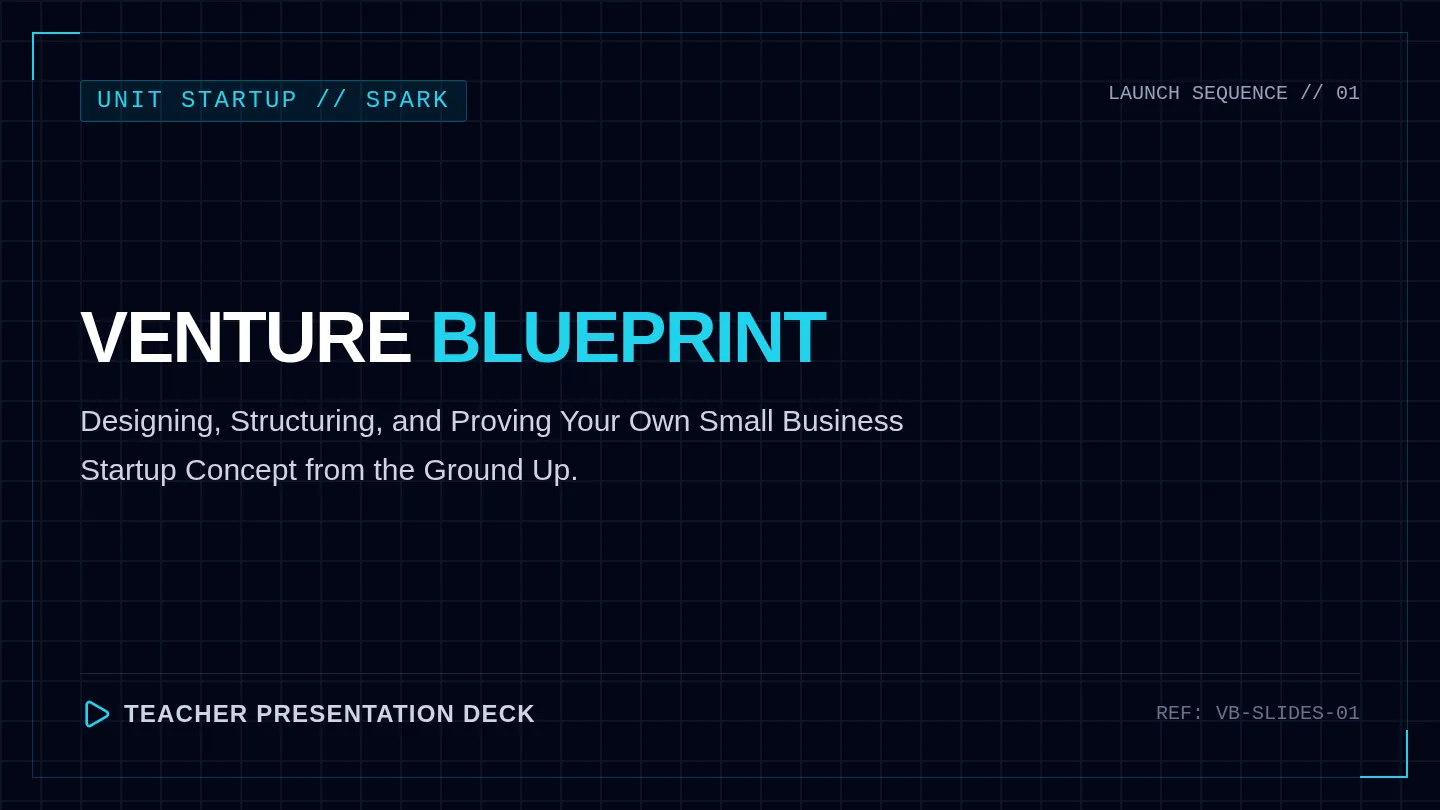
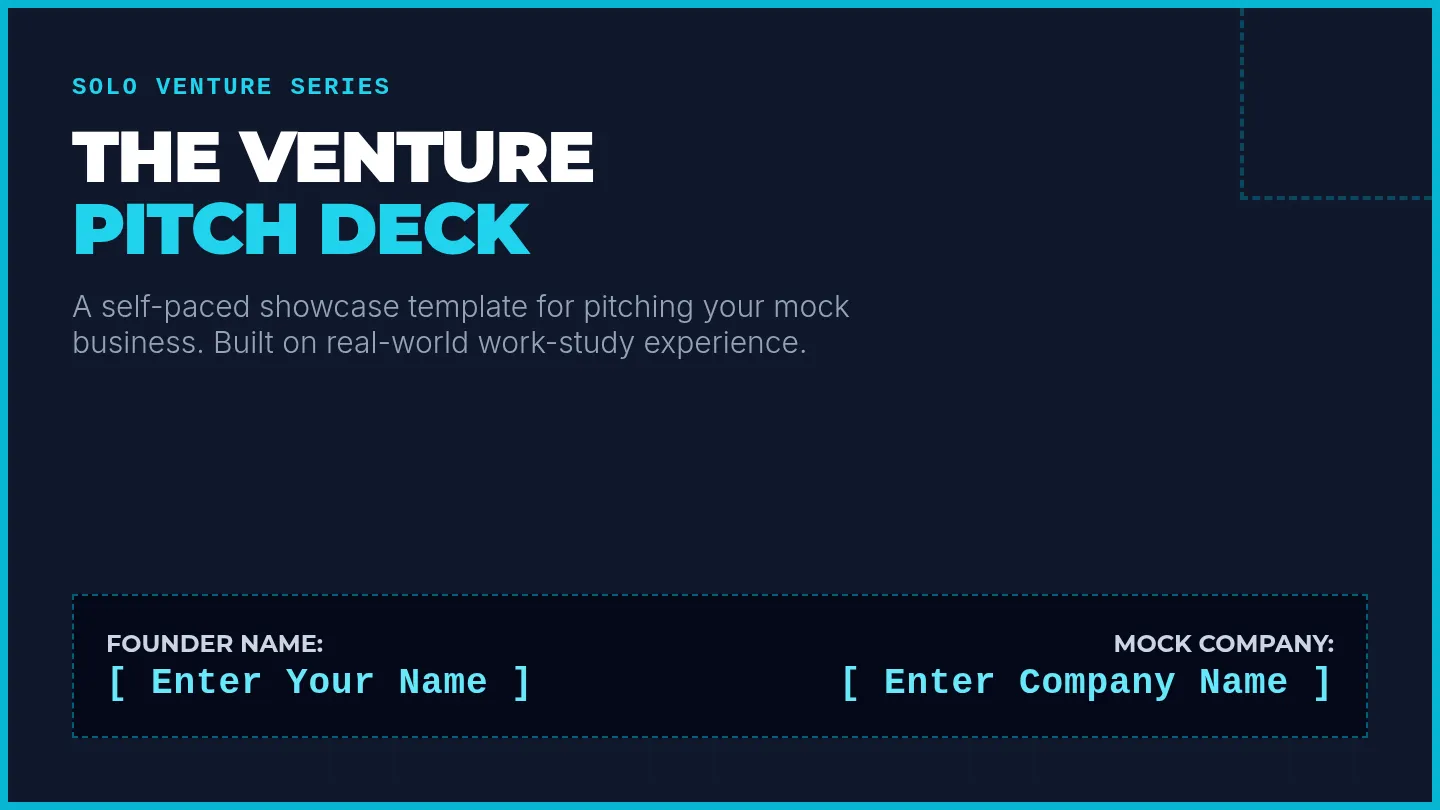
A high-impact, teacher-facing slide deck to introduce students to the Venture Blueprint. This 5-slide deck features big typography, structural blueprint line patterns, and core visual frames detailing startup fundamentals from elevator pitches to unit economics.
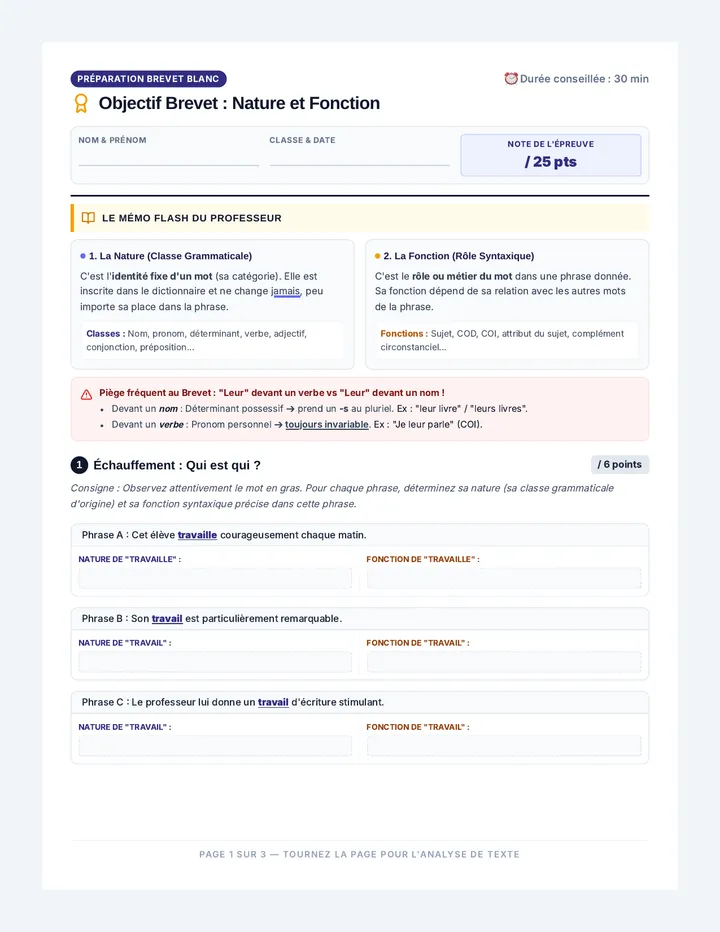
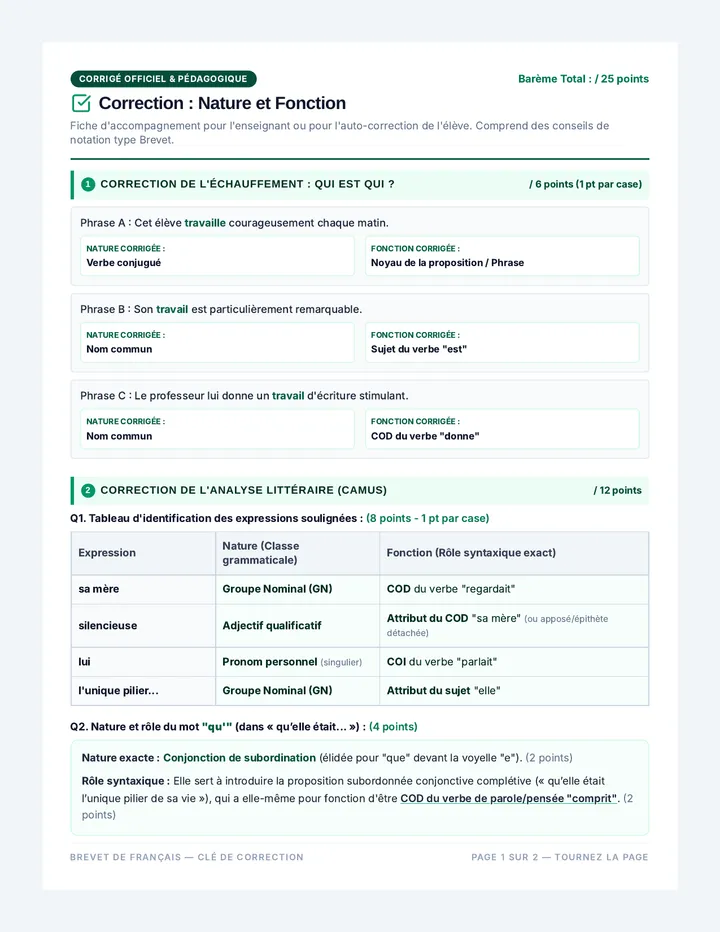
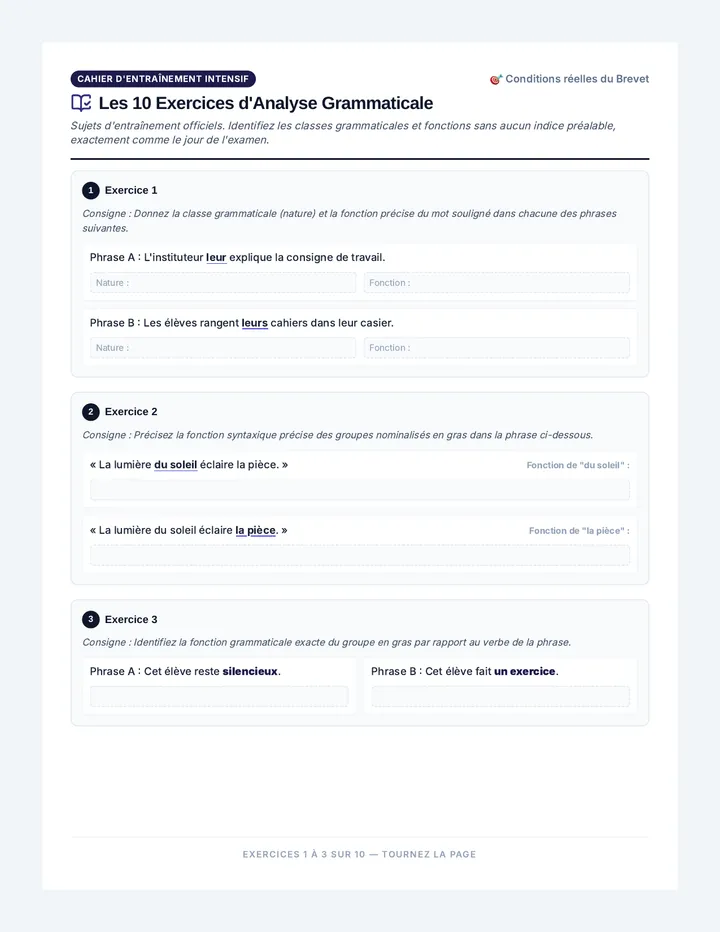
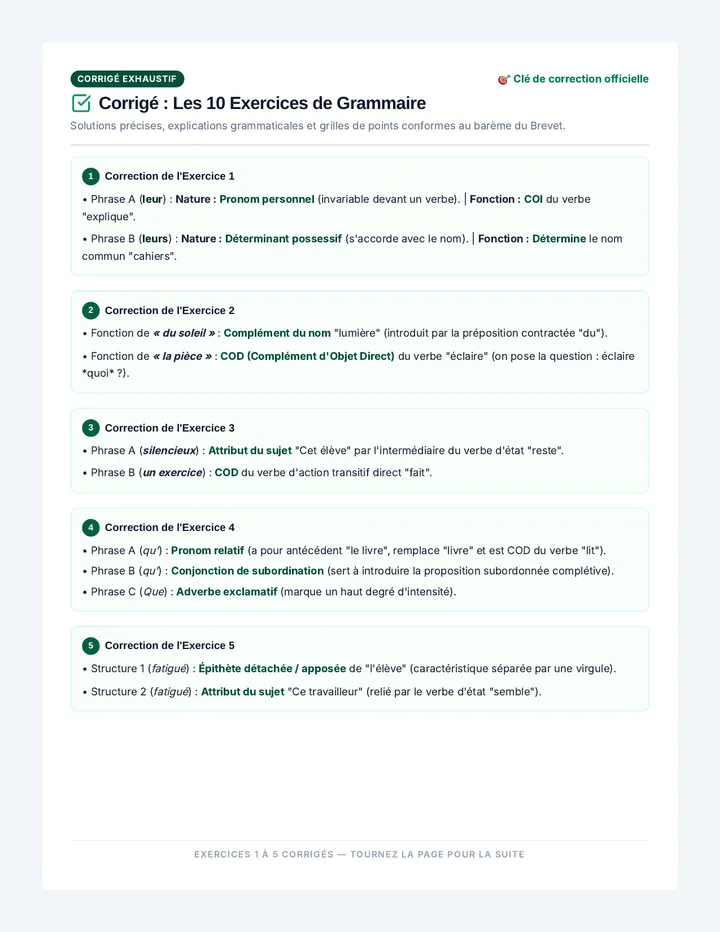
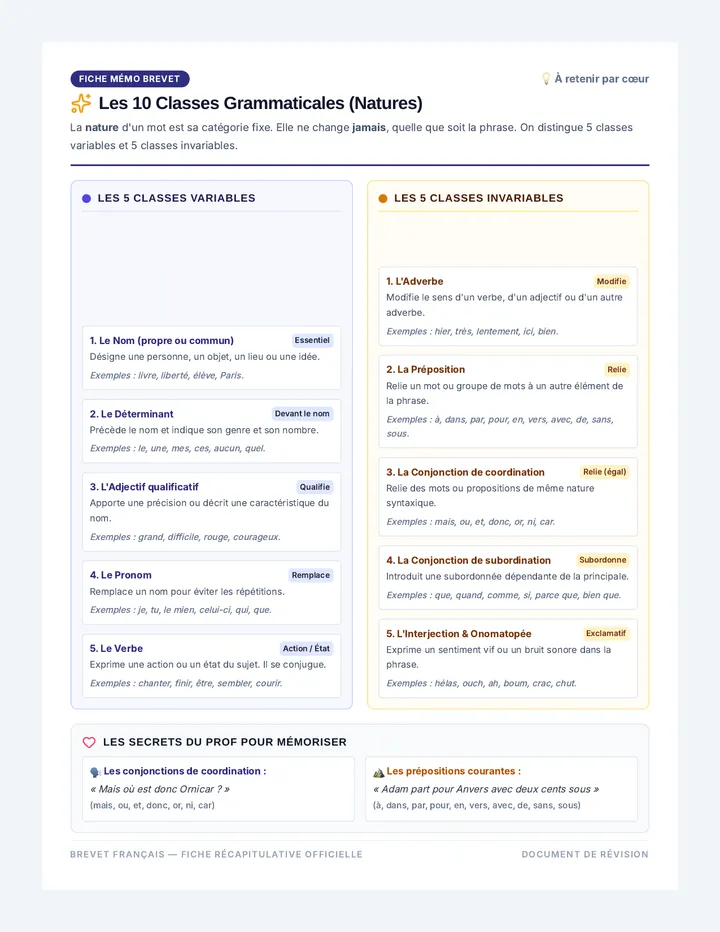
Un programme complet de révision intensive pour le Brevet, regroupant des fiches, exercices et corrigés détaillés en français et en physique-chimie.
A collection of foundational reference sheets, formula grids, and problem-solving templates designed to support Connecticut high school physics students across all NGSS units.
A comprehensive, 3-page student-facing startup planner and guided template. Using a modern blueprint theme, this resource provides scaffolds, questions, and structured writing areas for business profile, market analysis, operations, and financial plans.