Students graph mortality data for different species to generate Type I, II, and III survivorship curves, analyzing the level of parental care and life cycle risks.
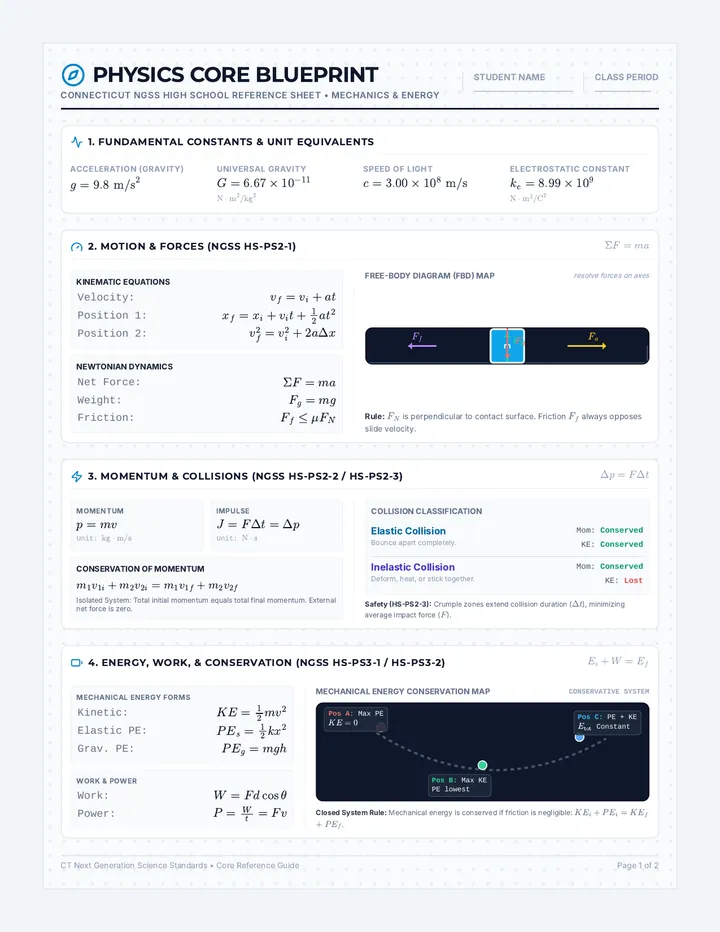
A comprehensive high school physics curriculum sequence aligned with the Connecticut Next Generation Science Standards (CT-NGSS), focusing on core concepts, quantitative problem-solving, and visual models.
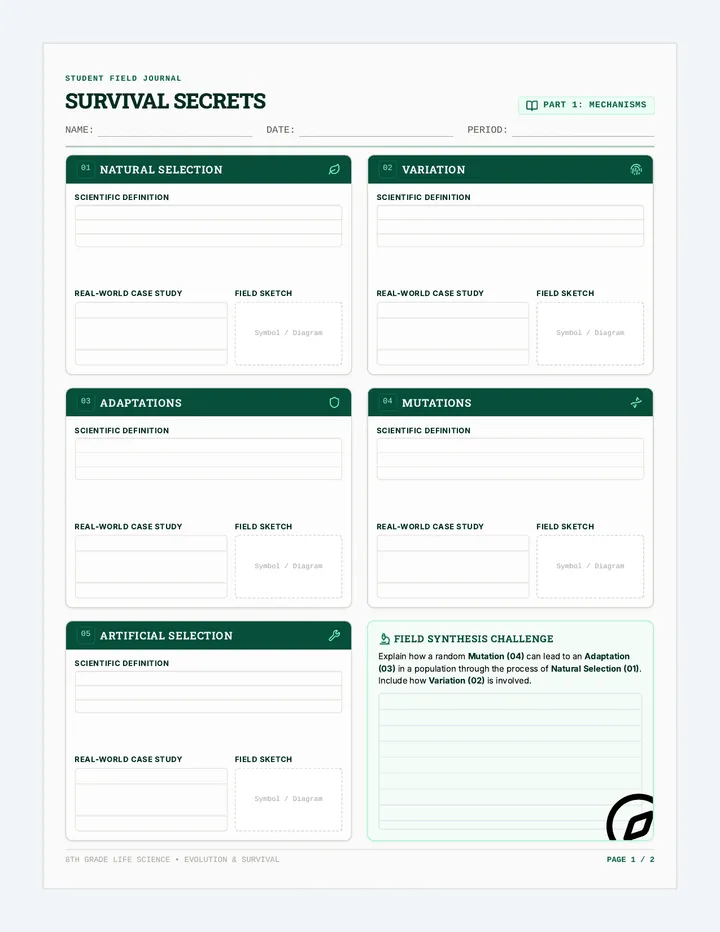
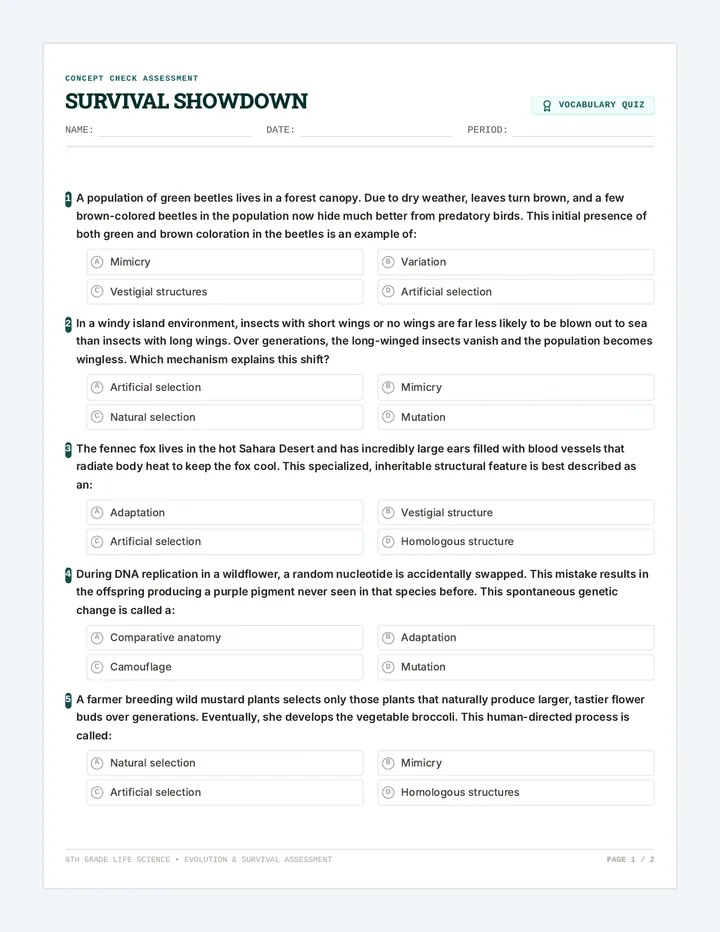
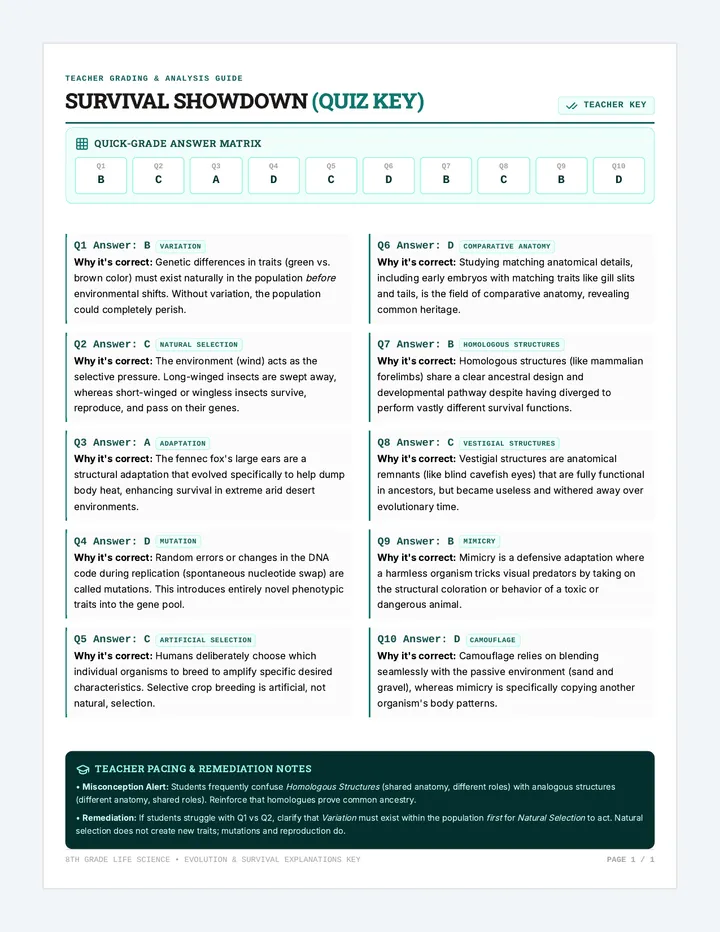
An active-recall study unit on natural selection and evolutionary evidence, featuring graphic organizers, application activities, and a practice quiz.
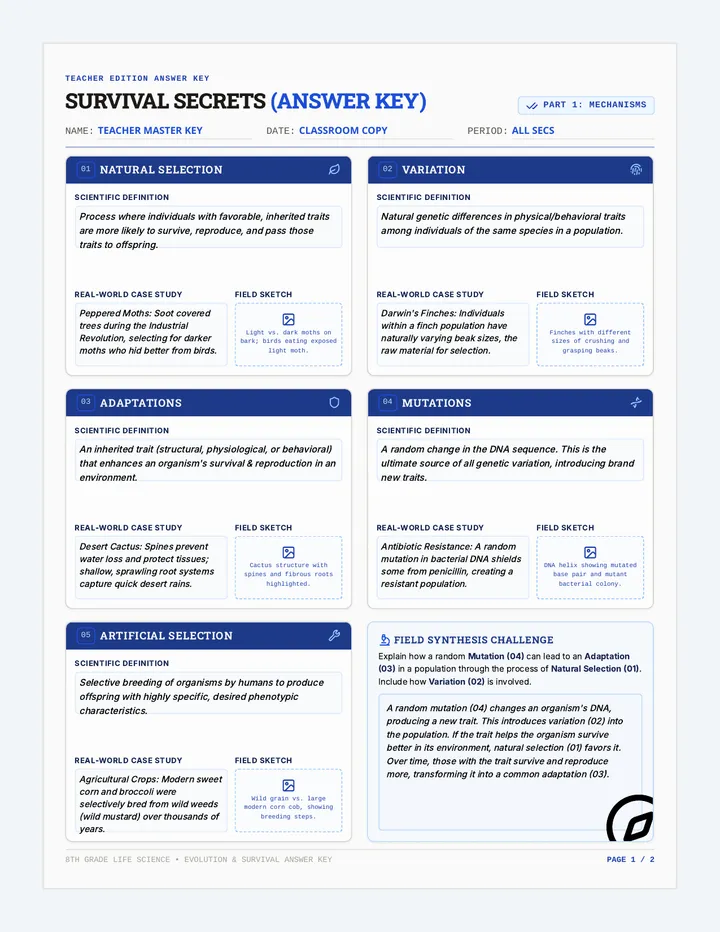
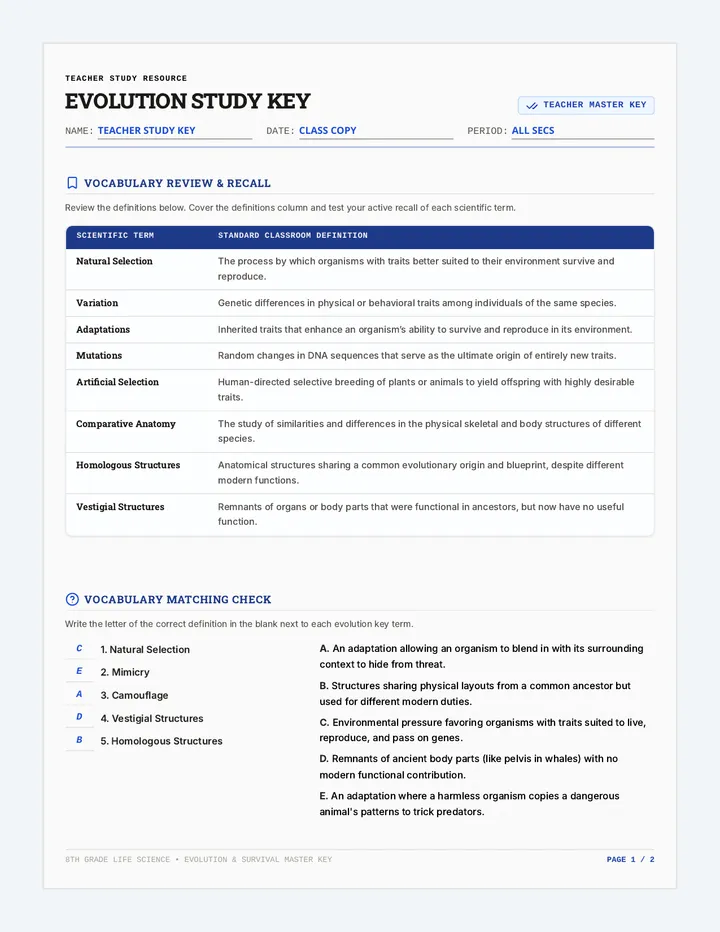
Complete teacher answer key for the Evolution Study Guide, containing completed vocabulary matching and high-quality exemplar written responses styled in blue ink.
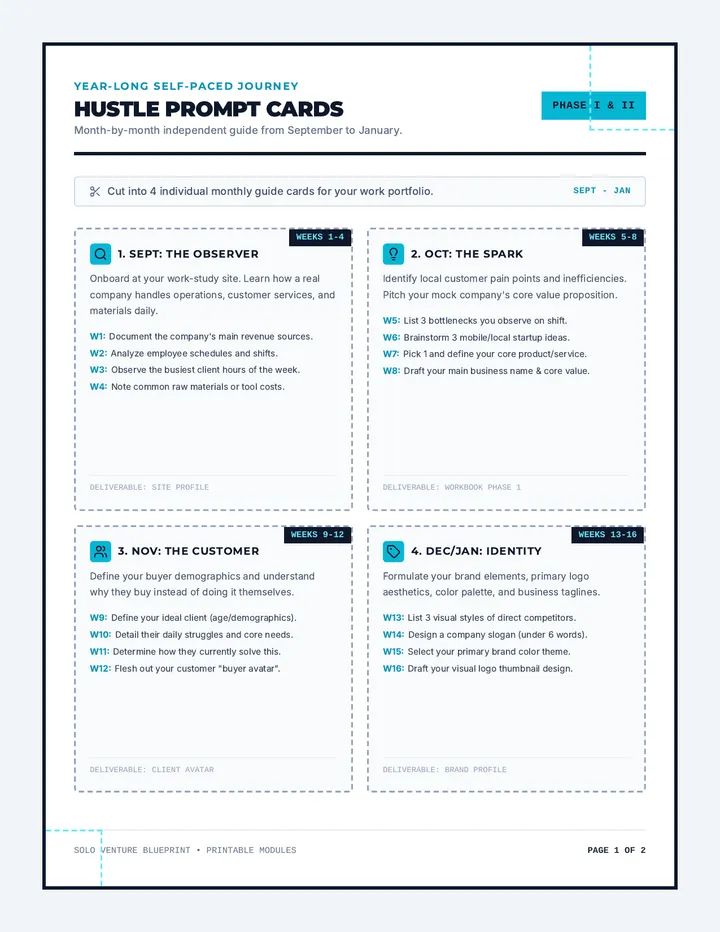
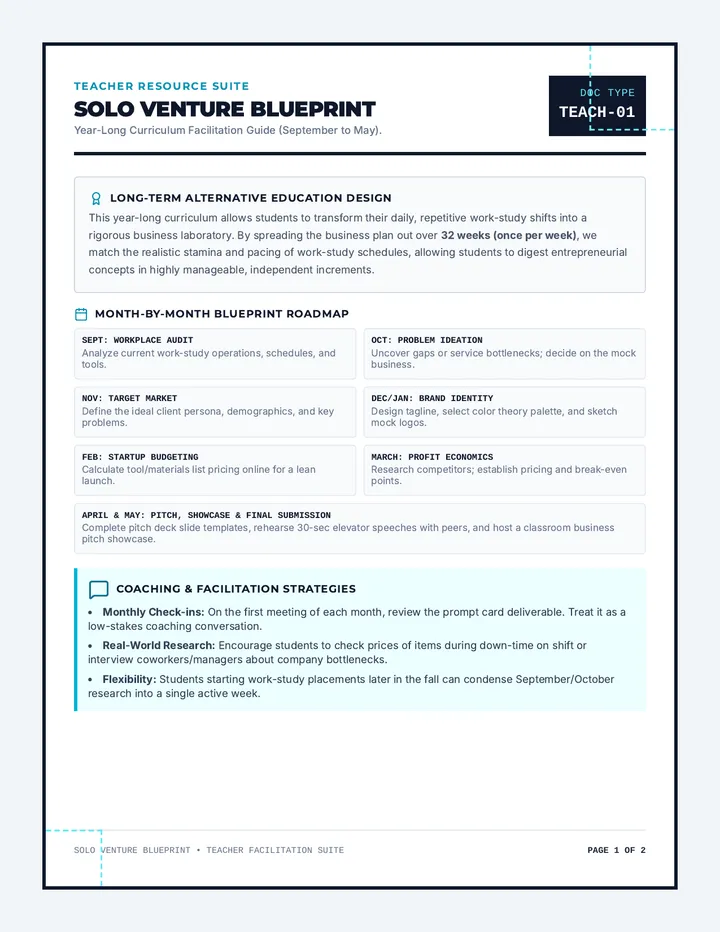
A year-long, self-paced entrepreneurship curriculum spanning September to May for alternative education students in work-study placements. Students transform real-world work experience into a modular business plan and slide presentation.
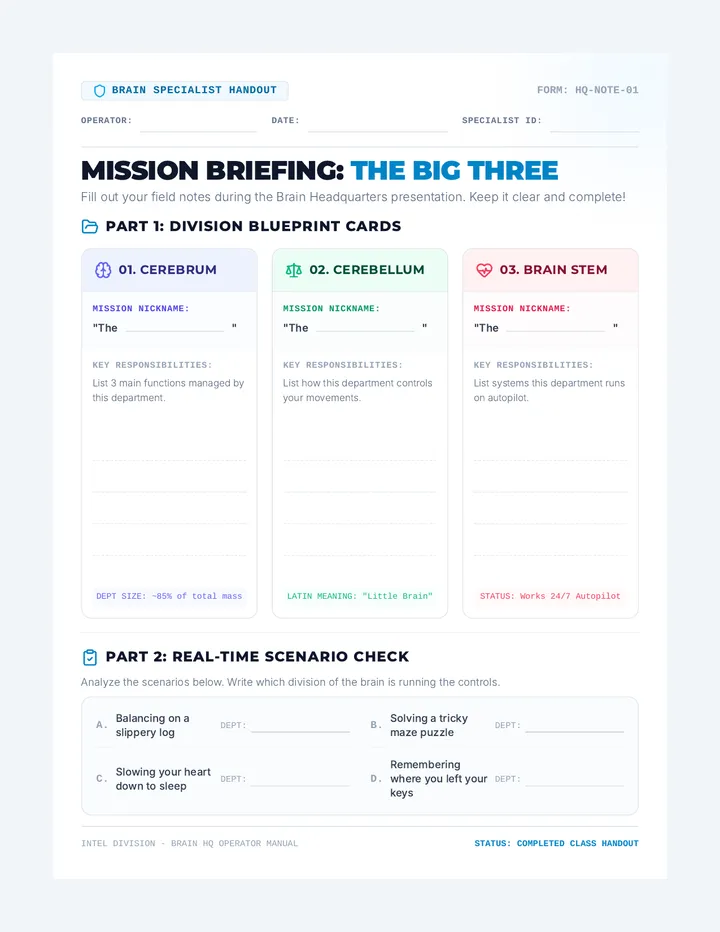
An interactive lesson introducing elementary or middle school students to the three major divisions of the brain: the Cerebrum, Cerebellum, and Brain Stem.
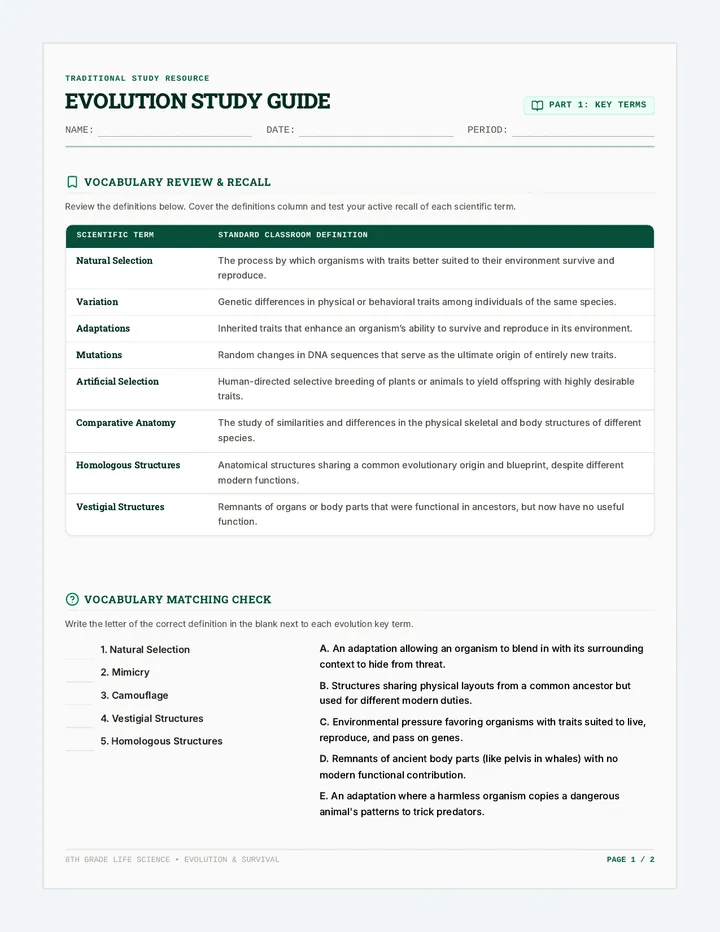
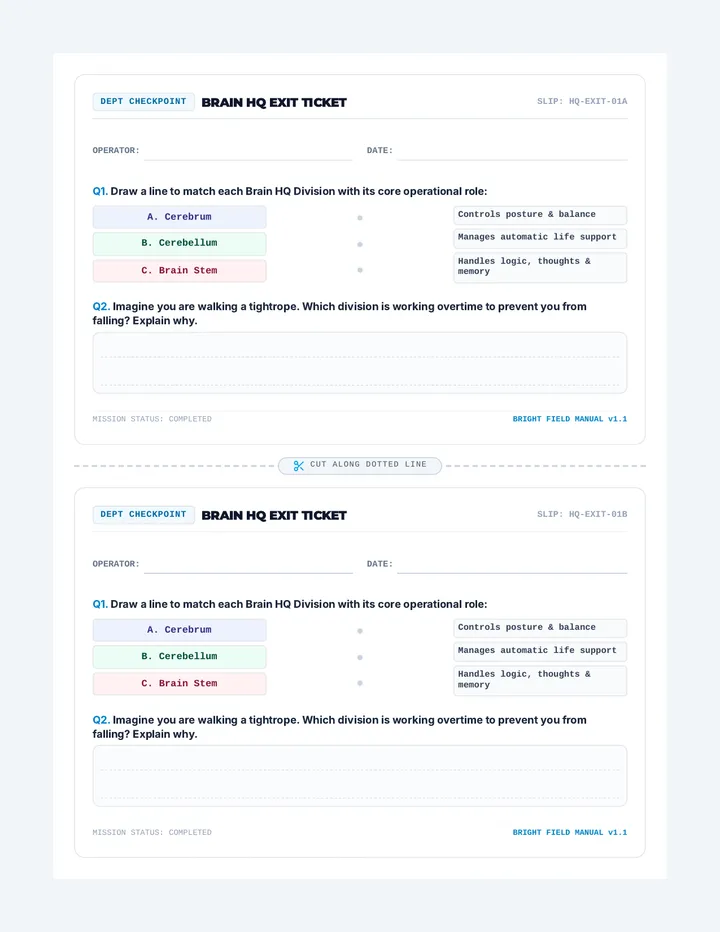
A traditional 2-page print-ready study guide for 8th-grade science, featuring direct definitions, structured vocabulary matching, and four scenario-based short-answer practice questions.
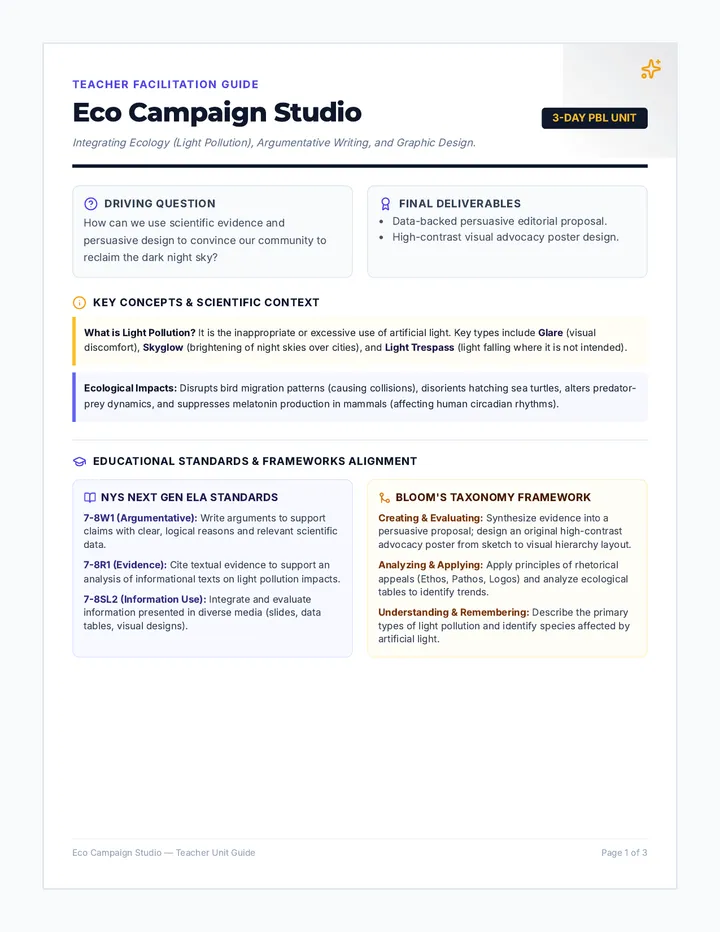
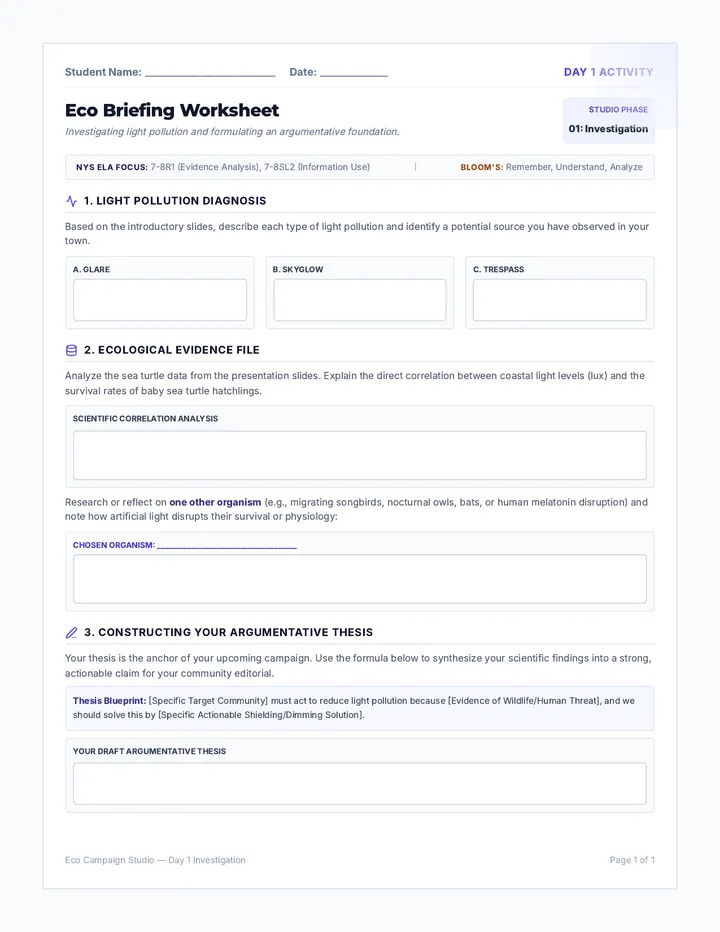
A cross-curricular, 3-day project-based unit combining science, argumentative writing, and graphic design. Students investigate the ecological impacts of light pollution, write a data-driven persuasive proposal, and design a community awareness campaign poster.
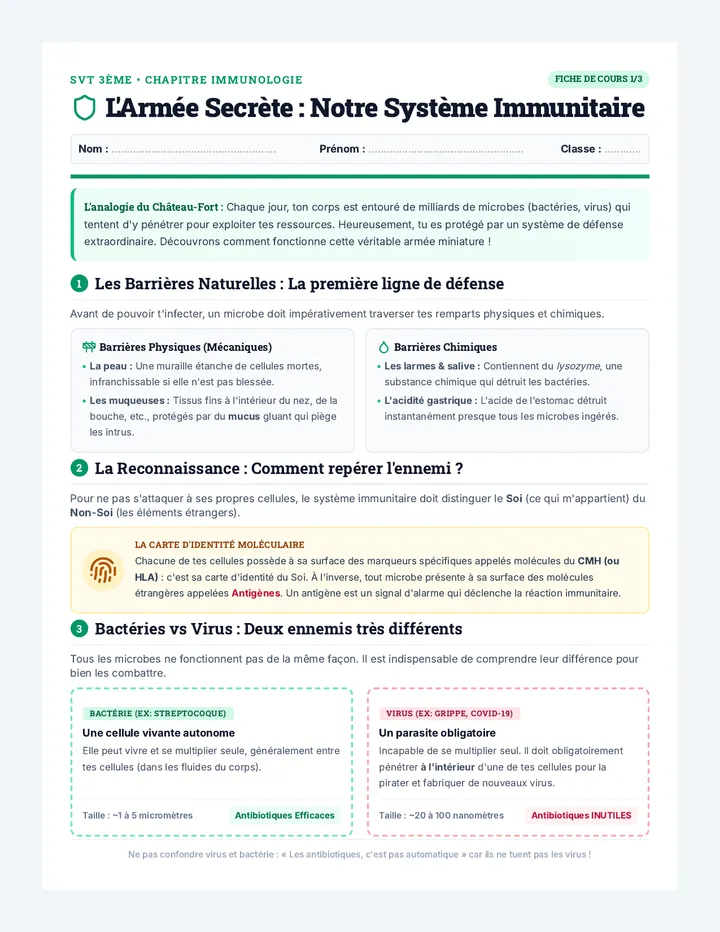
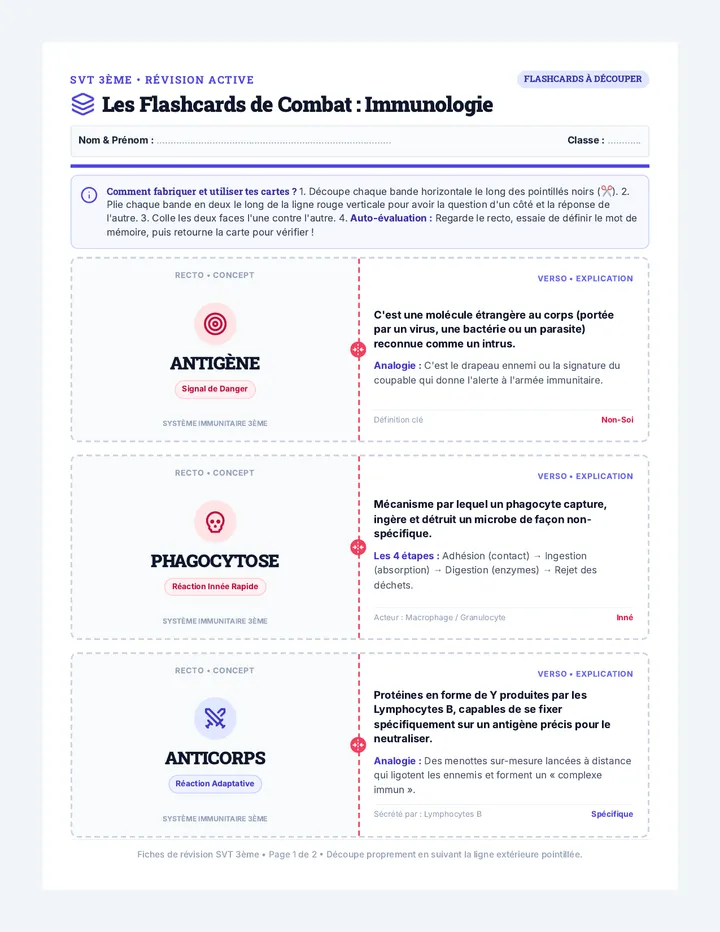
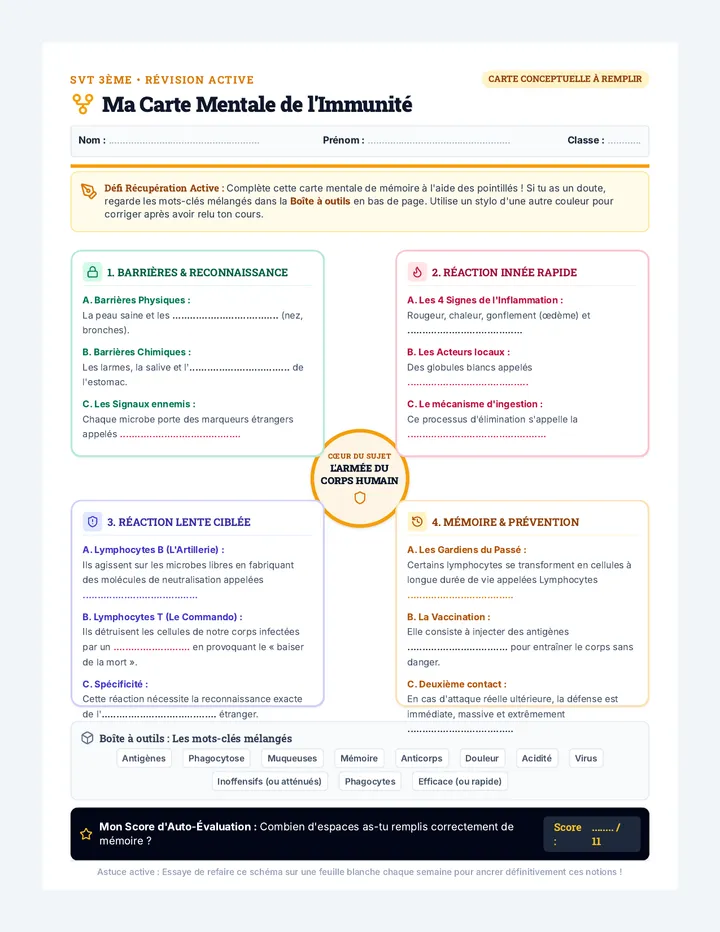
Une leçon complète et ultra-pédagogique de SVT (niveau 3ème) sur le système immunitaire. Conçue avec des analogies percutantes, des schémas structurés et des outils de révision active pour garantir la compréhension et la mémorisation de tous les élèves.
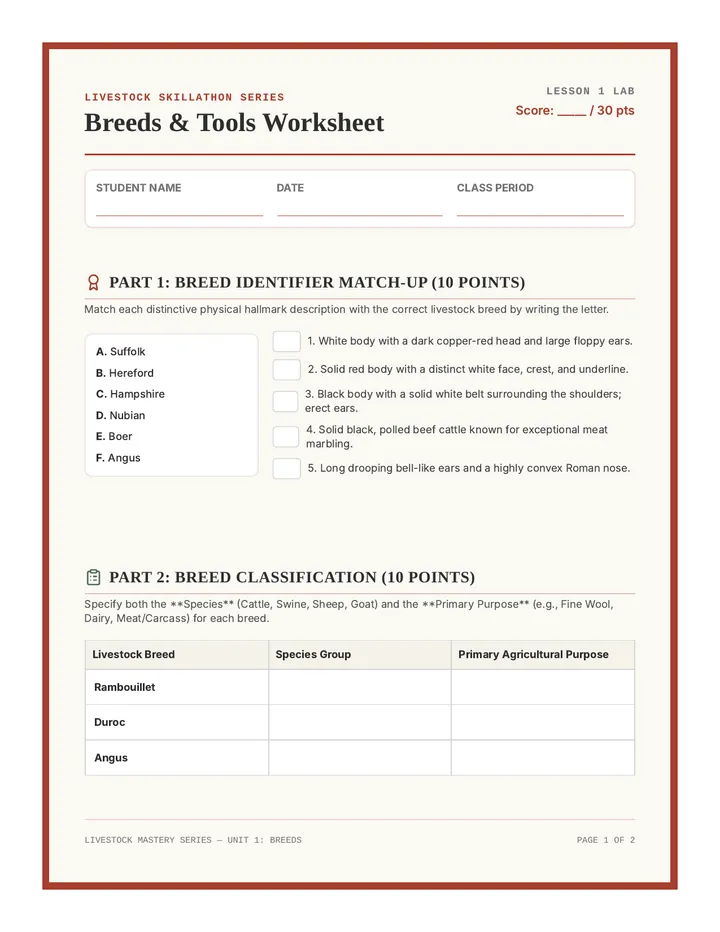
An immersive preparation program that equips agriculture students with the hands-on identification and evaluation skills needed to conquer competitive Livestock Skillathon contests.
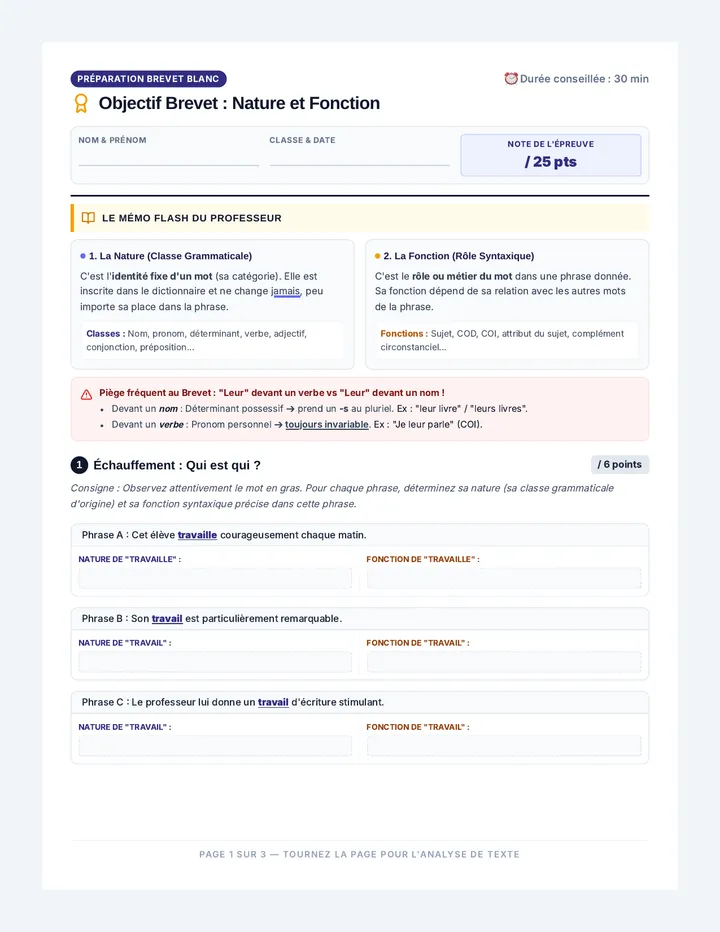
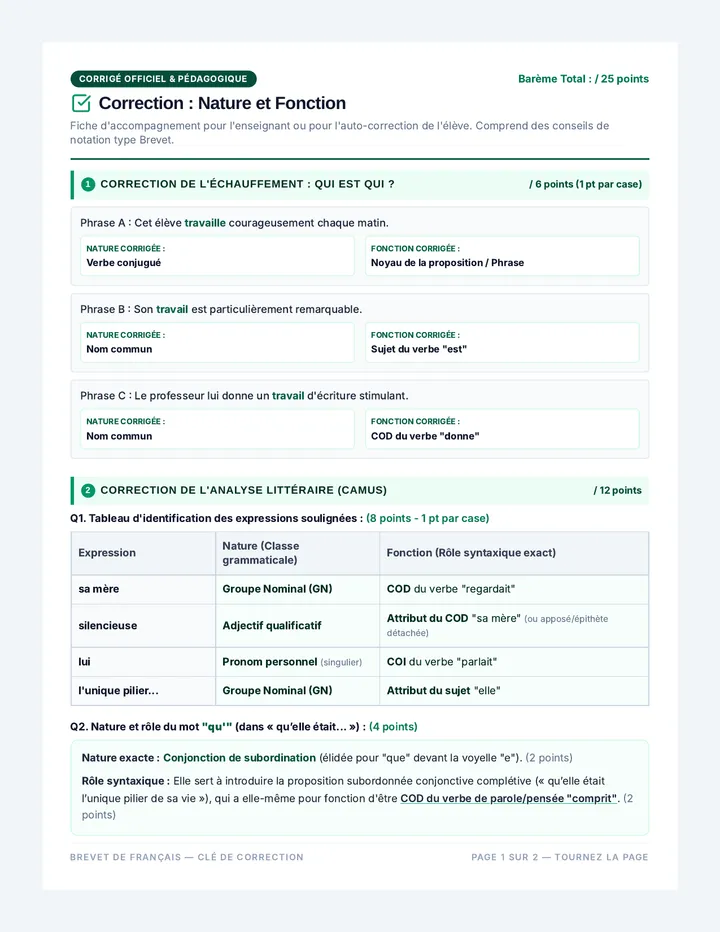
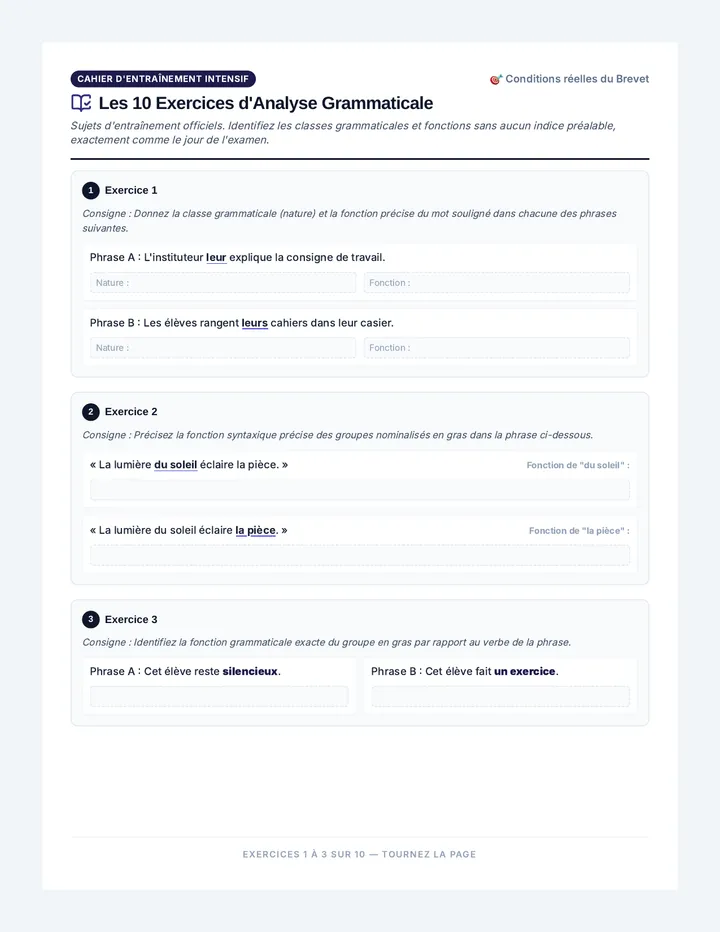
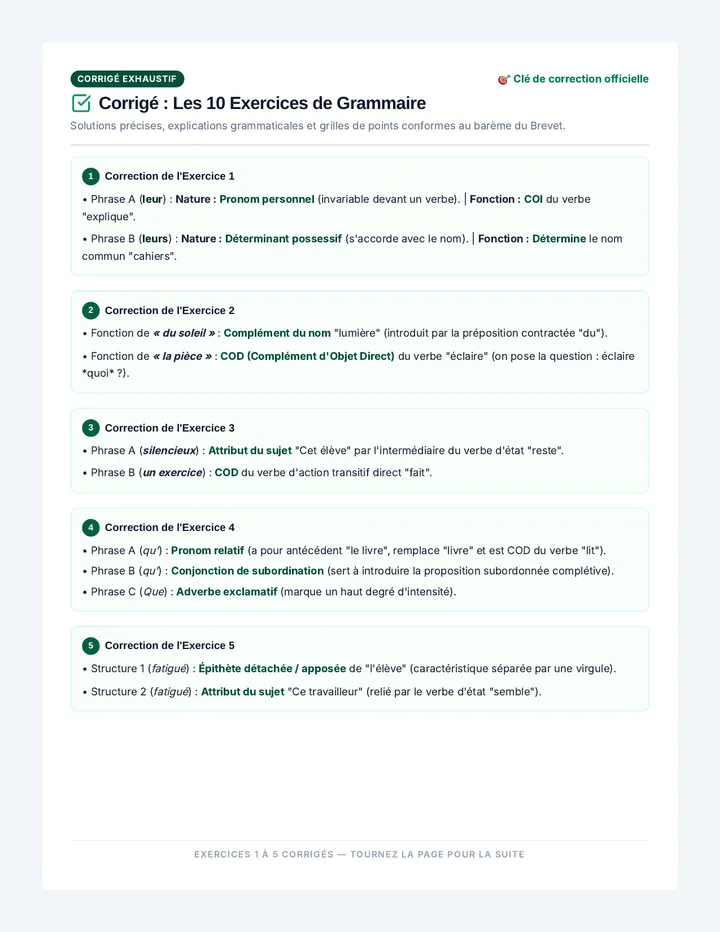
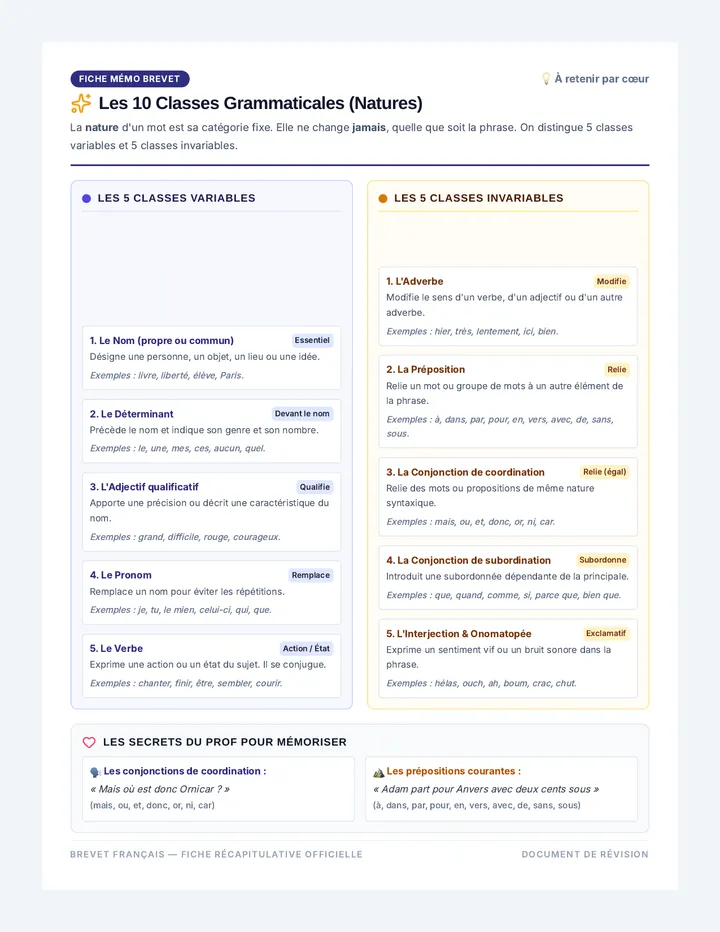
Un programme complet de révision intensive pour le Brevet, regroupant des fiches, exercices et corrigés détaillés en français et en physique-chimie.
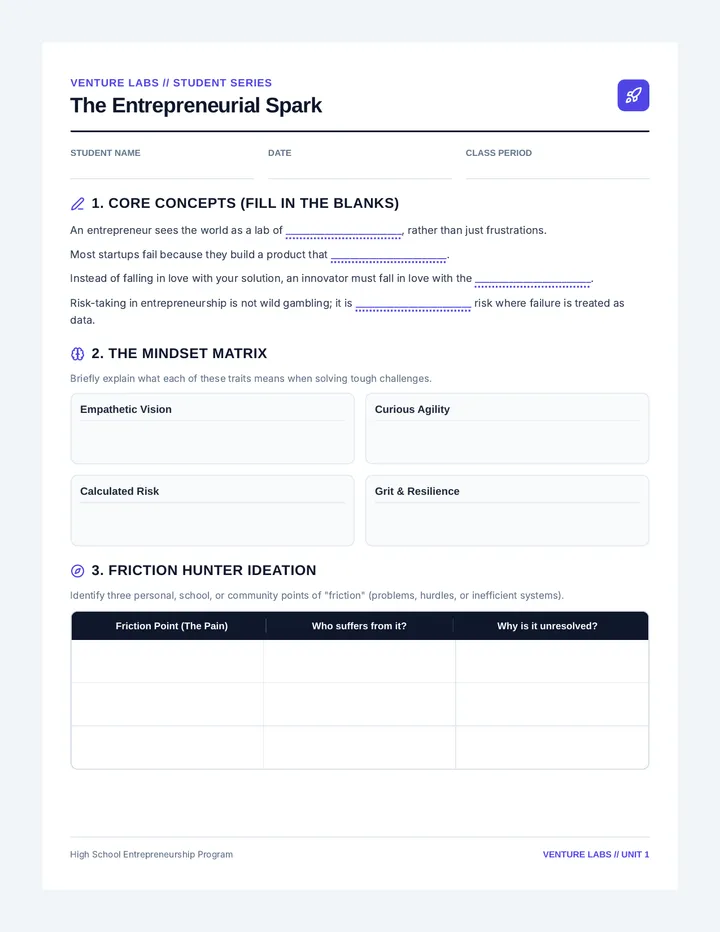
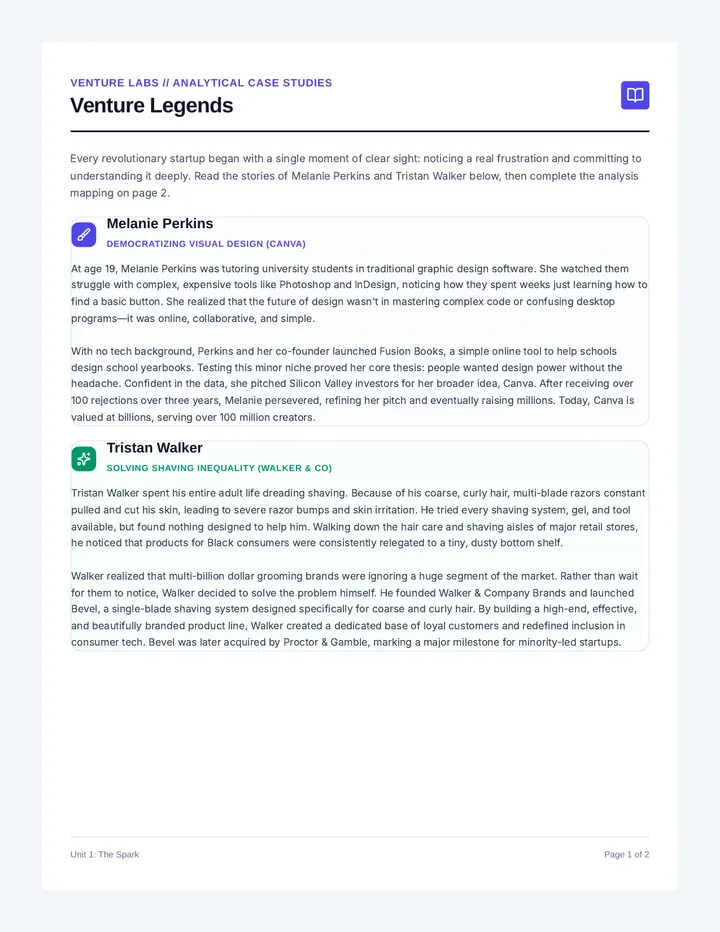
A multi-day entrepreneurship sequence that guides high school students through developing an entrepreneurial mindset, designing a business model, and pitching their own startup concepts.
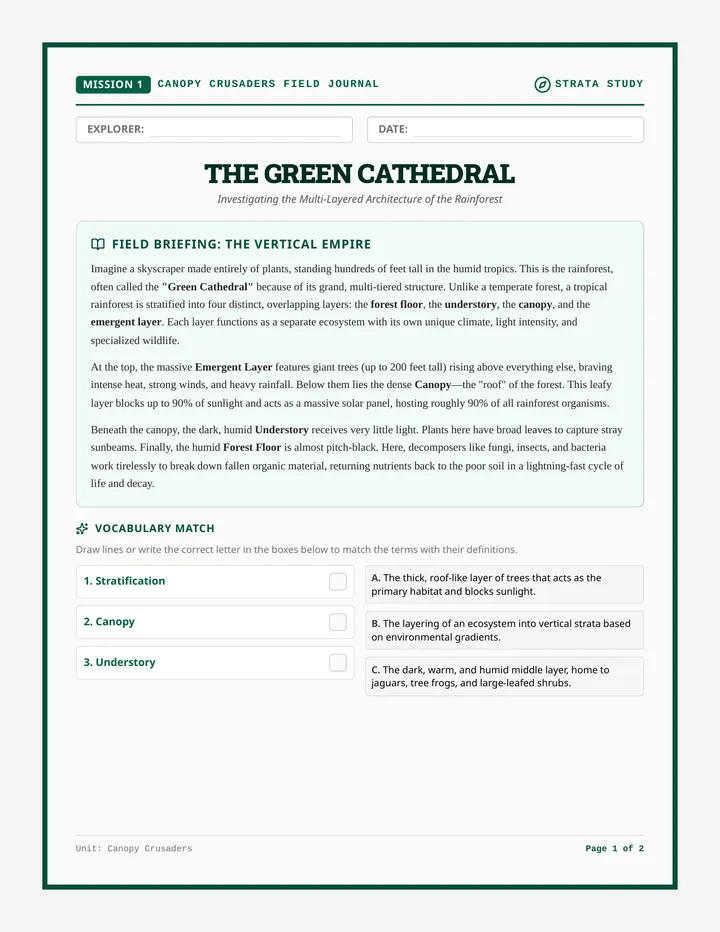
A comprehensive unit on rainforest ecology, climate regulation, and conservation. Students explore the structural layers of the rainforest, their roles as carbon sinks, the threats of deforestation, and collaborative solutions for preservation.