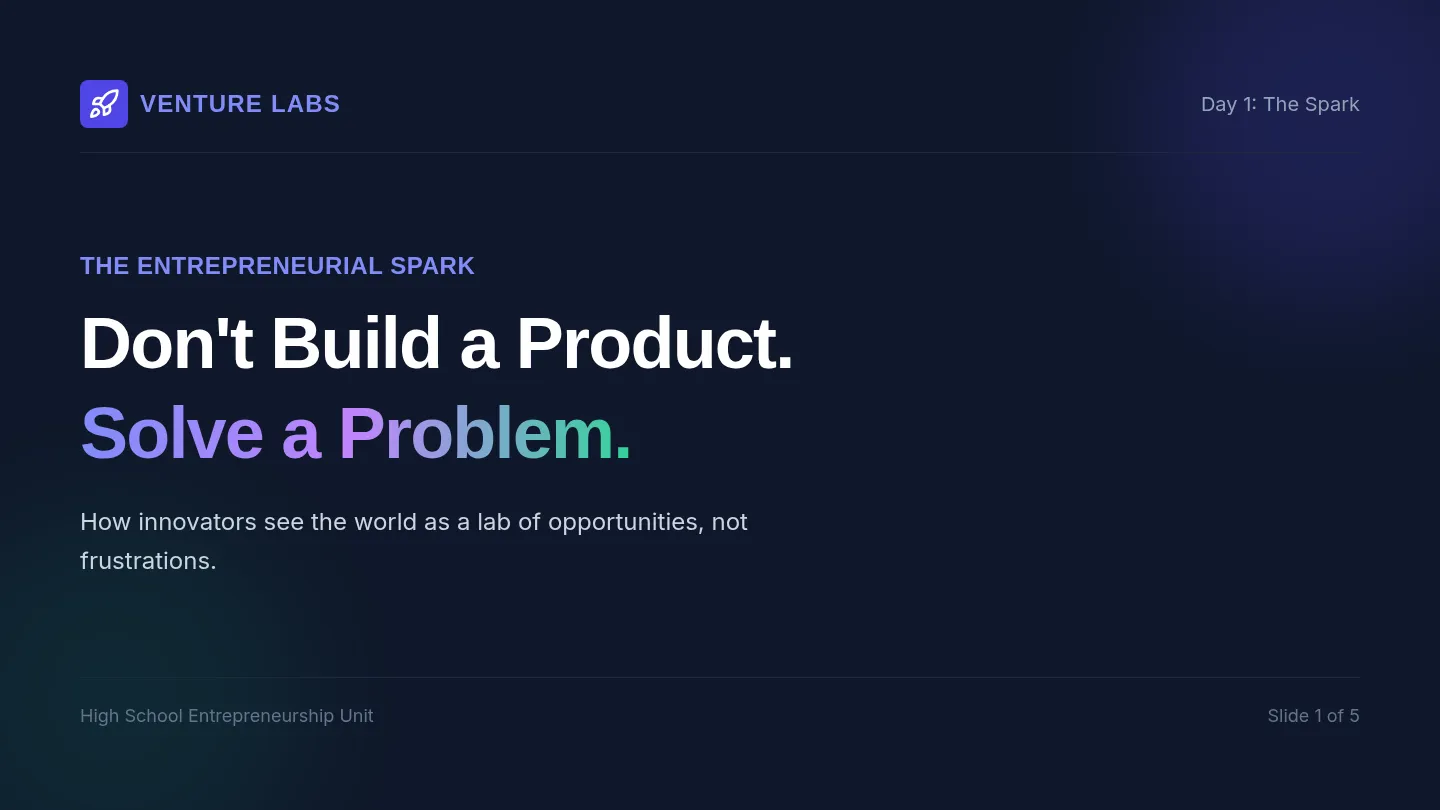
Rule Breakers Slides Lesson 1: Introduction to ML
Rule Breakers
How can we teach computers to make predictions by providing them with examples instead of instructions?
The Impossible Task?
Imagine you have to write a list of instructions (rules) for a computer to tell the difference between:
A Blueberry Muffin
vs
A Chihuahua
What rules would you use? Color? Shape? Texture?
[Image Placeholder: Muffin vs Chihuahua Grid]
Two Ways to Solve Problems
Traditional Programming
IF (ears == "pointy") AND (nose == "wet") THEN "Dog"
Humans provide the Rules and the Data . The computer provides the Answer .
Machine Learning
Humans provide the Answers (Labels) and the Data . The computer figures out the Rules .
Data + Labels
Pattern Discovery
Supervised Learning
Definition
Labeled Data
The computer is shown examples that are already tagged with the correct answer (e.g., "This is a cat").
Training
The algorithm looks for common patterns across all the examples it was shown.
Prediction
When shown a new image, the computer uses its "learned rules" to guess the label.
The ML Workflow
1. Collect Data
2. Label Data
3. Train Model
4. Test Model
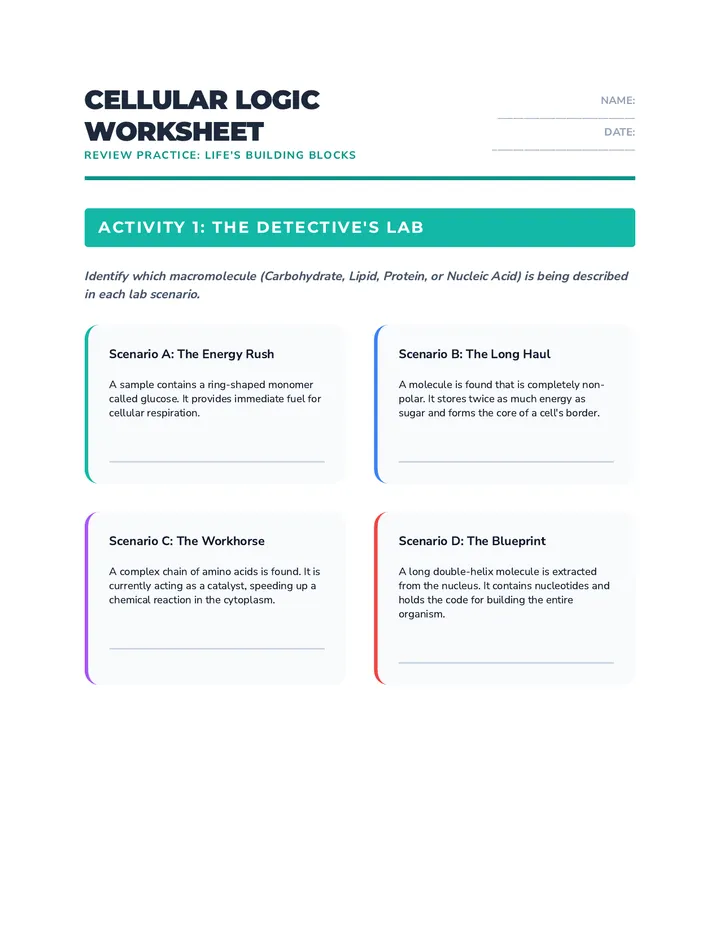
Rules vs Examples Worksheet Rules vs. Examples
Lab Activity: ML Paradigms
Student:
Date:
Part 1: The Rule-Based Approach
You are a software engineer in the year 2005. Machine learning isn't widely used yet. You must write a set of if-then rules to help a computer distinguish between a Blueberry Muffin and a Chihuahua .
Observation Box
Look at the images provided by your teacher. What features do you see?
The Problem
"The spots on the muffin look like eyes. The ears of the dog look like the wrapper. The texture of the fur looks like cake."
Write your Rules:
Part 2: The Machine Learning Approach
Now, instead of rules, you will provide Labels . A computer is shown 1,000 photos of muffins and 1,000 photos of dogs.
Scenario: High Variance
Critical Thinking
If you only show the computer images of Brown Chihuahuas but then ask it to identify a Black Chihuahua , what do you think will happen? Why?
Reflection
Why is it hard to write rules for visual objects like animals?
In your own words, what is the main difference between traditional programming and machine learning?
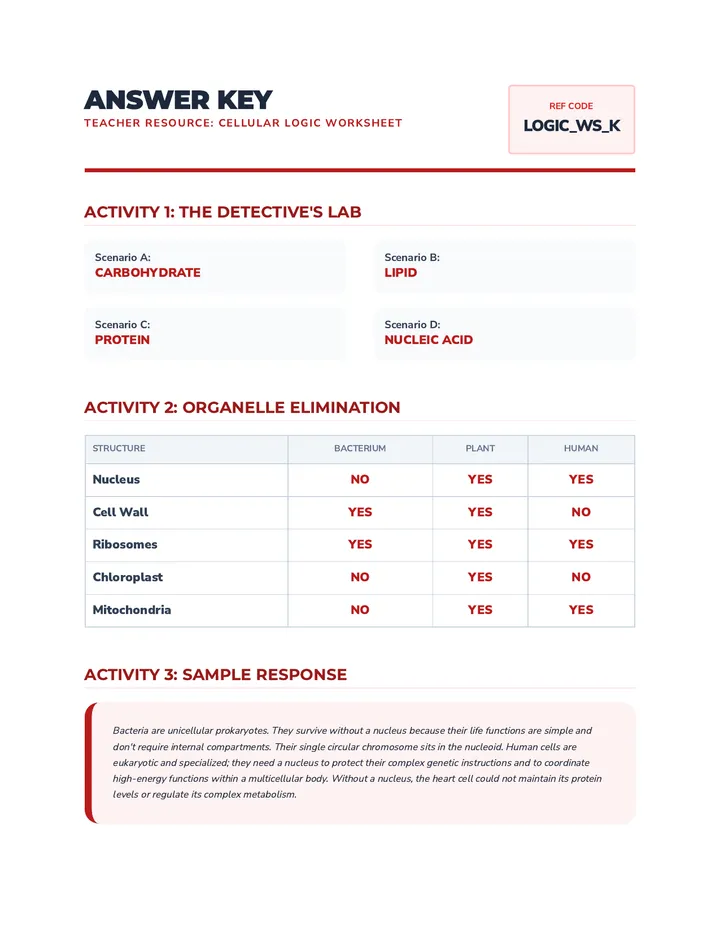
Rule Breakers Teacher Guide Teacher Guide
Lesson 1: Rule Breakers
60 Minute Session
Learning Objectives
Differentiate between rule-based programming and machine learning.
Define "Supervised Learning" and "Labeled Data."
Explain why unstructured data (images, audio) is difficult for traditional programming.
Key Discussion Prompts
"If we can't write a rule for it, how do we know it when we see it?"
Use this to transition from the Chihuahua activity to patterns.
"Is a computer 'thinking' like a human during training?"
Clarify that it is finding mathematical correlations, not "understanding" context.
Preparation
Search "Muffin vs Chihuahua" on Google Images for the hook.
Print "Rules vs Examples" worksheet for each student.
Ensure projector is ready for slide deck.
Misconception Alert
Students often think ML models "search the internet" for answers. Emphasize that the model only knows what is in its training dataset .
Pacing Guide
10 MIN
The Hook
Show the Muffin/Chihuahua image grid. Challenge students to write 3 perfect rules. Show how every rule can be "broken" by a specific image.
20 MIN
Direct Instruction
Deliver the "Rule Breakers" slide deck. Focus on the transition from Rule + Data → Answer to Labels + Data → Rules.
20 MIN
Worksheet Activity
Students complete the Part 1 & 2 of the worksheet. Walk around to help them think about "edge cases" (e.g., a muffin with ears).
10 MIN
Wrap Up
Reflect on the Part 3 questions. Ask: "What happens if our training data is bad?" to seed tomorrow's lesson.
Feature Finder Slides Lesson 2: Data & Features
Feature Finder
Understanding how computers "see" objects through specific, measurable traits.
The Blind Algorithm
An AI doesn't see a "Banana" or an "Apple." It sees numbers and measurements .
How would you describe an apple to someone who has never seen one using ONLY numbers?
• Weight: 150g?
• Color Hex Code: #FF0000?
• Texture Score: 8/10?
I AM DATA DRIVEN
Features vs. Labels
Features
The input . The characteristics or properties of the data we are studying.
Size, Weight, Color, Speed
Labels
The output . The category or result we want the computer to predict.
Apple, Banana, Spam, Not Spam
Garbage In, Garbage Out
Bias
If your data only shows red apples, the model will never learn that green apples exist.
Inconsistency
Measuring weight in grams for some and pounds for others will confuse the model.
Missing Data
Null values or gaps in the dataset make it impossible to find strong patterns.
The model is only as good as the data you give it.
Data Curation Worksheet Data Detective
Lab Activity: Features & Labels
Student:
Part 1: Defining Features
Imagine you are building a machine learning model to categorize Athletic Shoes . What measurable characteristics (Features) would you use to tell them apart?
Weight
Numerical (Grams)
Primary Color
Categorical
Sole Thickness
Numerical (mm)
Add 3 more unique features for shoes:
F4:
F5:
F6:
Part 2: The Dataset Table
Fill out the table below for three different items in your backpack.
Item (Data Point) Feature: Weight (est) Feature: Main Material LABEL (Category)
The Bias Check
If you train an AI to identify "Fruit" but only include Yellow Bananas and Green Grapes in your dataset, what will it predict when shown a Purple Grape ?
Robot Fruit Game Cards Robot Fruit: Data Cards
Activity: Teacher cuts these cards out. One student (the "Data Scientist") reads the Features (numbers) to the "Algorithm" student who must guess the Label (Fruit).
Goal: Can the Algorithm learn the patterns after seeing 3-4 cards?
Training Data #1
Features (Inputs)
Weight: 180g
Shape: Round
Surface: Smooth
Label (Output) APPLE
Training Data #2
Features (Inputs)
Weight: 120g
Shape: Curved / Long
Surface: Leathery
Label (Output) BANANA
Training Data #3
Features (Inputs)
Weight: 5g
Shape: Small / Round
Surface: Smooth / Thin
Label (Output) GRAPE
Test Data #1
Features (Inputs)
Weight: 145g
Shape: Round
Surface: Smooth
Label (Hidden) APPLE?
Print on cardstock for best results
Gesture Guru Slides Lesson 3: Classification Lab
Gesture Guru
Training a real-time visual classifier to master Rock, Paper, Scissors.
Sorting Into Classes
Classification is the process of predicting a discrete label (category) for a piece of data.
Examples:
Spam vs. Not Spam
Cat vs. Dog
Rock vs. Paper vs. Scissors
🪨
📄
✂️
3 Target Classes
Confidence Levels
An AI rarely says "I am 100% sure." Instead, it gives a probability for each possible class.
Rock 92%
Paper 5%
Scissors 3%
If confidence is low, the model might need more variety in the training data.
The Challenge
1
Capture Gestures
Collect 100+ images for each hand gesture (Rock, Paper, Scissors).
2
Train the Brain
Let the computer find the features that distinguish a fist from an open palm.
3
Stress Test
Try to confuse the model. Does it still work in different lighting? With gloves on?
4
Document Accuracy
Record your confidence scores on the Accuracy Tracker worksheet.
Gesture Guru Lab Guide Gesture Guru Lab
Hands-on Classification Lab
Live Classifier
Step 1: Environment Setup
Open Teachable Machine (or the classroom-assigned AI trainer) on your browser. Choose "Image Project" → "Standard model."
Create 3 Classes:
• Class 1: Rock
• Class 2: Paper
• Class 3: Scissors
Lighting Check
Ensure your webcam has good lighting. If the background is too cluttered, the AI might learn the wall behind you instead of your hand !
Step 2: Training (Data Collection)
Variety is Key
Don't just hold your hand still. Move it closer to the camera, farther away, and tilt it slightly. Capture at least 100 images per class.
Background Class (Optional but recommended)
Create a 4th class called "Nothing." Record images of the background without your hand. This helps the AI know when you aren't playing.
Step 3: Test & Debug
Experimenting with inputs
Left Hand?
Does it work for your other hand?
Friend's Hand?
Does it work for a classmate?
Shadows?
Turn off a light. Still works?
Neural Network Lab // Unit 1 // Supervised Learning v1.2
Model Accuracy Tracker Model Accuracy Tracker
Lab 3: Gesture Classification
NAME:
Phase 1: Baseline Testing
Record the confidence score (0-100%) for each gesture in your "normal" lab environment.
Rock
_____%
Confidence Score
Paper
_____%
Confidence Score
Scissors
_____%
Confidence Score
Phase 2: Stress Testing
Test Condition Predicts Correctly? Confidence Score Using your Non-Dominant hand Yes
No
| _______% |
| Hand partially off-screen |
Yes
No
| _______% |
| Wearing Gloves or a sleeve |
Yes
No
| _______% |
| Very low light (lights off) |
Yes
No
| _______% |
Phase 3: Debugging Plan
Which test condition caused your model to fail or have the lowest confidence? Why do you think that happened?
How would you fix it? (e.g., "I would add more images of hands in the dark to my training data")
Price Predictor Slides Lesson 4: Regression Models
Price Predictor
Beyond categories: Using machine learning to predict continuous numerical values.
The Big Split
Classification
Predicting a Category or "Discrete Label."
Is this email spam? Yes/No
Regression
Predicting a Number or "Continuous Value."
What will this house cost? $425,000
Finding the Line
Regression is about finding the mathematical relationship between features and the target number.
Price = (SqFt * 200) + LocationScore
The computer tries millions of combinations until it finds the line that "fits" the data best.
Model Prediction Line
Regression in the Real World
Weather
Predicting tomorrow's high temperature based on pressure and wind speed.
Retail
Estimating how many units of a product will sell based on the current price.
Health
Predicting a patient's recovery time based on age and vital signs.
Regression Challenge Worksheet The Price is Right
Lab Activity: Regression Analysis
Student:
Part 1: Identifying the Task
Determine if each of these ML problems is a Classification or Regression task.
1. Predicting if a bank transaction is "Fraudulent" or "Legitimate"
CLASSIFICATION
REGRESSION
2. Predicting the number of inches of snow tonight
CLASSIFICATION
REGRESSION
3. Predicting a student's final grade percentage (0-100)
CLASSIFICATION
REGRESSION
Part 2: Finding the Trend
A real estate model has found a trend between House Size (Sq Ft) and Sale Price .
The discovered "rule" is: Price = (Sq Ft * 250) + $50,000
Calculate Predictions:
1,000 Sq Ft $________________
2,500 Sq Ft $________________
Predictive Thinking
The model predicted a house would sell for $300,000, but it actually sold for $350,000 because it had a swimming pool .
How would you change the features of the dataset to make the model more accurate next time?
Case Study: Social Media Trends
You are training a model to predict how many "Likes" a post will get. Your current features are Time of Day and Post Length . The model is only 40% accurate.
Identify a New Feature
What is one numerical feature you could add to improve the prediction?
Explain the Logic
Why would this feature help find a stronger trend line?
Model Maker Slides Lesson 5: Capstone Project
Model Maker
Design, train, and deploy your own custom machine learning classifier.
The Mission
You will create an AI model that solves a problem or serves a specific purpose using Image Classification .
1
Identify a use case
2
Curation and Training
3
The "Blindfold" Test
Inspiration Gallery
Recycling Sort
Plastic vs Paper vs Metal
Sign Language
Recognizing ASL letters
Plant Doctor
Healthy vs Diseased leaves
Pet Sitter
Dog vs Cat vs Empty Bowl
"If you can't break it, you didn't test it."
The final part of your project is the Peer Stress Test . You will swap seats and try to make your partner's model fail.
Out of Sample
Show it an object it has never seen before.
Edge Cases
Show it a drawing instead of a photo.
Ambiguity
Show it two labels at the same time.
AI Project Planner AI Project Planner
Capstone: Custom Classifier Design
ENGINEER:
01
The Vision
Project Purpose
What problem are you solving? Or what is the specific goal of your model?
The Target Classes
List the 3+ categories your model will distinguish between.
C1:
C2:
C3:
02
Data Curation
Diversity Plan
To avoid bias and make a strong model, what variations will you include in your training data?
Lighting
Angles/Distance
Backgrounds
03
The Stress Test
Swap projects with a peer. Record one specific input that "broke" their model or caused low confidence.
The "Breaking" Input:
Model Reaction: Model Maker Rubric Project Rubric
Model Maker Capstone
Criteria Exceeds (4) Meets (3) Developing (2) Dataset & Variety 150+ images per class. High variety in lighting, angles, and backgrounds. No obvious bias. 100+ images per class. Some variety in capture conditions. Fewer than 100 images per class. Data is repetitive or has high bias. Classification Accuracy Model maintains 90%+ confidence across all baseline tests and non-dominant hand tests. Model maintains 80%+ confidence in normal conditions. Successful classification. Model frequently confuses classes or has low (<60%) confidence scores. Project Planner Plan is detailed, identifying clear purpose, 3+ unique classes, and thorough data strategy. Plan is complete, identifying purpose and target classes. Plan is missing sections or fails to define clear classes for the model. Stress Testing Actively identifies weaknesses. Proposes specific data-driven solutions to improve accuracy. Participates in peer stress test and records failure points. Limited testing performed. Unable to explain why the model fails.
Total Score: _______ / 16
Comments: __________________________________________________________________
A
B
C