Reaction Time Slides The Physics of Reaction Time
Forensic Motion Analysis: Lesson 01
CASE FILE #101: HUMAN LIMITATIONS
The Invisible Mile
At 60 mph (27 m/s), you travel the length of a football field in roughly 4 seconds.

"I only looked at my phone for a second!"
How much distance did the car cover during that "one second" before your foot even touched the brake?
~27 Meters
Traveled while distracted
Anatomy of a Stop
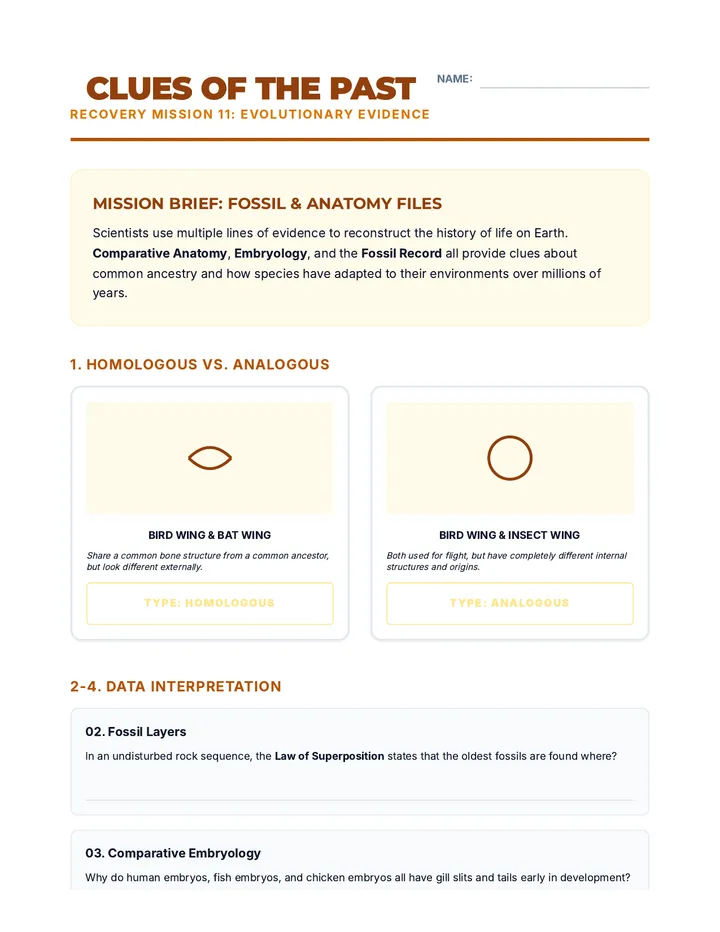
1. Reaction Phase

The time between seeing a hazard and physically moving your foot to the brake pedal.
Motion: Constant Velocity
\( \Delta x = v \cdot t_r \)
2. Braking Phase
The time and distance required for the car's mechanical systems to stop the vehicle.
Motion: Negative Acceleration
\( v_f^2 = v_i^2 + 2a \Delta x \)
Total Stopping Distance = Reaction Distance + Braking Distance
Lab Briefing: Ruler Drop
Objective: Measure \( t_r \) using vertical displacement.
Gravity Constant
9.8 m/s²
1
Partner holds a metric ruler vertically at the 0 cm mark.
2
Student places thumb and forefinger at the bottom of the ruler without touching.
3
Partner drops ruler; student catches it as fast as possible.
The Physics:
Starting velocity is zero (\( v_i = 0 \)).
\( \Delta y = \frac{1}{2} g t_r^2 \)
Solve for \( t_r \):
\( t_r = \sqrt{\frac{2 \Delta y}{g}} \)
Why it matters
If your reaction time is 0.25 seconds, and you are driving at 65 mph (29 m/s), you travel 7.25 meters (24 feet) before you even start to slow down.
Today's Mission:
Determine your personal reaction distance for residential and highway speeds.
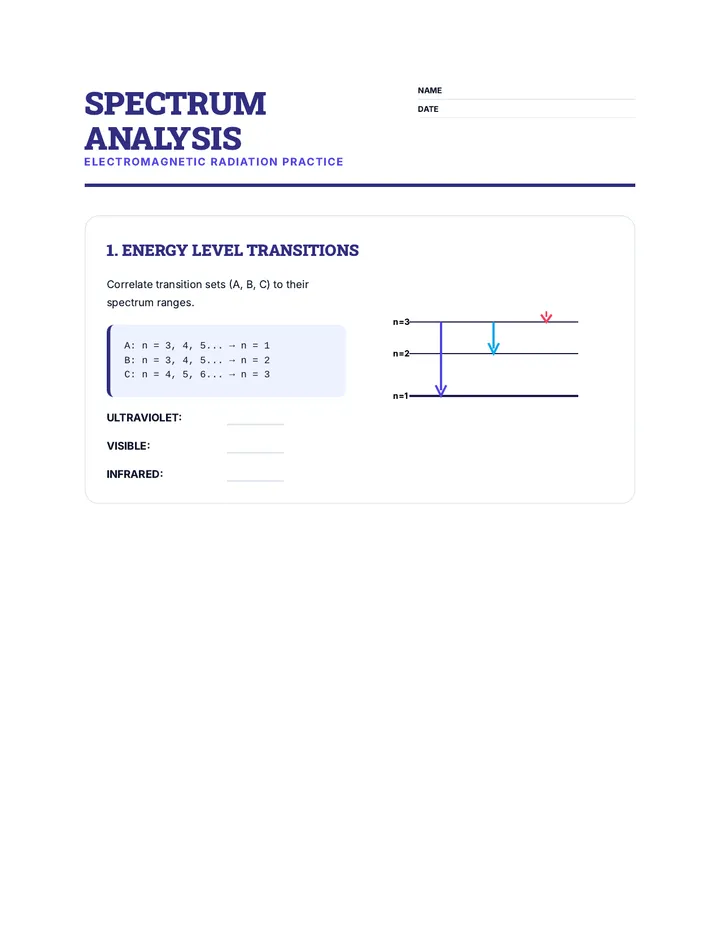
Ruler Drop Lab Activity Ruler Drop Lab
Kinematics Case Study: Measuring Human Reaction Time
Name:
Date:
Objective
To measure human reaction time using the displacement of a free-falling object and calculate the corresponding distance a vehicle would travel during that interval.

Procedure
Student A holds the ruler at the top (30cm mark).
Student B places fingers at the 0cm mark (bottom) without touching.
Student A drops the ruler without warning.
Student B catches it. Record the catch position (\( \Delta y \)) in meters.
Repeat for 5 trials. Calculate the average.
The Calculation
Rearranging the kinematic equation \( \Delta y = \frac{1}{2}gt^2 \):
\( t_r = \sqrt{\frac{2 \Delta y}{9.8}} \)
Note: \(\Delta y\) must be in meters.
Data Collection
Trial # Catch Mark (cm) Displacement (\( \Delta y \), m) Reaction Time (\( t_r \), s) 1 2 3 4 5 Average Reaction Time (\( t_{avg} \)):
Part 2: Forensic Reconstruction
Using your average reaction time , calculate how far your "car" travels at different speeds during the reaction phase (before the brakes are even touched).
Scenario A: Neighborhood Zone
\( v = 11.2 \text{ m/s (25 mph)} \)
Show your work for \( \Delta x = v \cdot t_{avg} \):
Reaction Distance:
meters
Scenario B: Highway Speed
\( v = 29.1 \text{ m/s (65 mph)} \)
Show your work for \( \Delta x = v \cdot t_{avg} \):
Reaction Distance:
meters
Discussion & Error Analysis
1. If you are checking a text (approx. 4 seconds), how many "average reaction lengths" did you travel without looking at the road?
2. Identify two possible sources of error in this lab. How might they affect the calculated reaction time?
Reaction Facilitation Guide Teacher Guide: Reaction Time
Forensic Motion Analysis | Lesson 1 of 5
Lesson Overview
In this lesson, students bridge the gap between "human experience" and "physics calculation." By measuring their own physical limitations, they gain a tangible understanding of why speeding and distracted driving are dangerous. The core physics concept is uniform velocity displacement during the reaction phase.
Essential Questions
How does human biology impact automotive safety?
How can we use vertical displacement to measure time?
Why is constant velocity the correct model for the reaction phase?
Learning Objectives
Measure and calculate reaction time using kinematic equations.
Convert between units (mph to m/s, cm to m).
Synthesize human limitations with physical travel distance.
Instructional Flow
00-10 min
The Hook
Use the slides to demonstrate the "Invisible Mile." Ask: "How many of you think you can react faster than the average person?"
10-30 min
Ruler Drop Lab
Students work in pairs. Circulate and ensure they are starting the ruler at the 0cm mark correctly and converting cm to meters for calculations.
30-45 min
Forensic Reconstruction
Individual work on the back of the lab sheet. Students apply their personal \(t_r\) to vehicle speeds.
45-50 min
Exit Ticket / Debrief
Discussion: "If distractions (phones) double your reaction time, what happens to your reaction distance?"
Pro Tips & Troubleshooting
Common Pitfall: Units
Students often forget to convert 15 cm to 0.15 m before plugging into the formula. This leads to reaction times that are physically impossible. Remind them: Physics loves meters!
Distraction Modification
For an extension, have Student B try to catch the ruler while counting backwards from 100 by 7s. Compare the "focused" vs "distracted" reaction times.
Calculation Reference
# Example Catch: 15 cm (0.15 m)
t = sqrt( 2 * 0.15 / 9.8 ) = 0.175 seconds
# At 65 mph (29.1 m/s):
Distance = 29.1 * 0.175 = 5.09 meters
Note: Typical human reaction time is 0.2s - 0.3s.
Braking Distance Slides Braking Distance
Forensic Motion Analysis: Lesson 02
CASE FILE #102: THE SPEED-DISTANCE TRAP
The Speed Trap
If you double your speed, what happens to your stopping distance?
A: It Doubles
Linear (v)
B: It Quadruples
Quadratic (v²)
"Why 30 mph zones feel slow, but save lives."
The Square Rule
\( 2 \times \text{Speed} \)
\( 4 \times \text{Distance} \)
The Physics of Stopping
The "No-Time" Equation
\( v_f^2 = v_i^2 + 2a \Delta x \)
Goal (\(v_f\))
\( 0 \)
Friction (\(a\))
\( \text{Negative} \)
Result (\(\Delta x\))
\( \Delta x = \frac{-v_i^2}{2a} \)
The Braking Curve
Speed (m/s) Braking Dist. 10 ~7m 20 (2x) ~28m (4x) 40 (4x) ~112m (16x)
This isn't just a straight line. It's a Parabola.
Small increases in speed lead to massive increases in the energy the brakes must dissipate and the distance needed to stop.
Forensic Insight:
In a 30 mph zone, a car can stop in 13m. At 40 mph, that same car is still doing 27 mph when it reaches that 13m mark.
Quadratic Analysis
We will now calculate the exact deceleration (\(a\)) required to stop vehicles under different road conditions and map the "Safety Zone."
Enter Workshop Mode
Braking Curve Workshop Activity The Braking Curve
Analysis of Quadratic Stopping Relationships
Physics Unit
Kinematics
The Forensic Problem
A vehicle is traveling at a speed of \(v_i\). The driver slams on the brakes, creating a constant deceleration of \(a = -7.0 \text{ m/s}^2\) (typical for dry asphalt). We need to model how the stopping distance changes as speed increases.
Base Equation
\( v_f^2 = v_i^2 + 2a \Delta x \)
Simplified for Stopping (\(v_f=0\))
\( \Delta x = \frac{-v_i^2}{2a} \)
Part 1: The Data Set
Calculate the braking distance for each speed assuming \(a = -7.0 \text{ m/s}^2\). Show one sample calculation below the table.
Initial Speed (\(v_i\)) Speed Squared (\(v_i^2\)) Braking Distance (\(\Delta x\)) 10 m/s (~22 mph) 100 20 m/s (~45 mph) 400 30 m/s (~67 mph) 900 40 m/s (~90 mph) 1600
Sample Calculation Area
Part 2: Visualizing the Relationship
Sketch the relationship between Initial Speed (\(v_i\)) and Braking Distance (\(\Delta x\)) . Label your axes.
Braking Distance (m)
Initial Speed (m/s)
Observation
Is this relationship linear or non-linear ? Explain why based on the equation.
Safety Engineering
If road conditions change (wet ice), \(a\) drops to \(-1.5 \text{ m/s}^2\). How does this affect the slope of your graph?
The 20% Rule
A 20% increase in speed (e.g., from 50 mph to 60 mph) results in a 44% increase in braking distance. Based on your math today, why is "just 5 mph over the limit" significantly more dangerous in a school zone?
Dilemma Zone Slides The Dilemma Zone
Intersection Engineering & Critical Decisions
SYSTEM STATUS: YELLOW LIGHT ANALYSIS
The Split-Second Trap
You are 40 meters from an intersection at 45 mph. The light turns YELLOW.
Option A: Stop
Are you close enough to brake safely without ending up in the middle of the intersection?
Option B: Go
Are you close enough to clear the line before the light turns RED?
Dilemma Zone
A region where neither option works.
Mapping the Zones
Stopping Distance (\(x_s\))
Minimum distance required to stop comfortably.
\( x_s = v_i t_r + \frac{v_i^2}{-2a} \)
Includes reaction time + braking distance.
Clearing Distance (\(x_c\))
Maximum distance from which you can clear the intersection.
\( x_c = v_i t_y - w \)
\(t_y\) = yellow time; \(w\) = width of intersection.
If \(x_s > x_c\), a DILEMMA ZONE exists.
City Traffic Engineer
The Project
Local residents complain that the yellow light at Main & 5th is too short, causing "panic stops" or "red-light running."
Technical Goal:
Calculate the minimum yellow light time (\(t_y\)) required to eliminate the dilemma zone for a 45 mph speed limit.
"Good engineering saves lives. Bad physics causes lawsuits."
Variable Impact
If the road is wet (lower \(a\)), does the Dilemma Zone get larger or smaller?
Larger
Smaller
Traffic Engineer Report Activity Technical Engineering Report
Department of Transportation | Traffic Safety Division
Project ID
TR-402-DZ
Situation Summary
Site analysis at Intersection 45 (Main & Broadway) indicates a high frequency of "Rear-End Collisions" and "T-Bone Impacts." Preliminary data suggests the existing yellow light timing of 3.0 seconds is insufficient for the 45 mph (20.1 m/s) speed limit.
Incident Report: "Driver 1 stated they were too close to stop safely when the light turned yellow, but were struck by cross-traffic before clearing the 15-meter wide intersection."
System Constants
Speed Limit (\(v\)) 20.1 m/s
Decel. (\(a\)) -6.5 m/s²
Reaction (\(t_r\)) 1.0 s
Width (\(w\)) 15.0 m
1. Calculate Stopping Distance (\(x_s\))
How far back must a car be to stop safely before the line?
Reaction Dist (\(v \cdot t_r\))
Braking Dist (\(\frac{-v^2}{2a}\))
Total \(x_s\):
meters
2. Calculate Clearing Distance (\(x_c\))
With the CURRENT yellow time of 3.0s, how far away can a car be and still make it across?
Work Space (\(x_c = v \cdot t_y - w\))
Current \(x_c\):
meters
Forensic Finding: Is there a Dilemma Zone?
Compare your results: Does \(x_s > x_c\)?
Min. Dist to Stop (\(x_s\))
______ m
Max. Dist to Clear (\(x_c\))
______ m
If \(x_s\) is greater than \(x_c\), explain what happens to a driver caught between those two distances.
Final Engineering Recommendation
Calculate the Minimum Yellow Time (\(t_{min}\)) required to eliminate the Dilemma Zone (so that \(x_c = x_s\)).
Hint: Set \(x_s = v \cdot t_y - w\) and solve for \(t_y\).
Proposed Yellow Time:
seconds
Skid Mark Analysis Slides Skid Mark Analysis
Forensic Motion Analysis: Lesson 04
ACCIDENT RECONSTRUCTION SPECIALIST
The Physical Evidence
"The driver claims they were doing the speed limit (35 mph). The skid marks measure 18 meters."
Evidence Type: Skid
When brakes lock, kinetic friction converts motion into heat and leaves rubber on the road. This length represents the Braking Phase (\(\Delta x\)).
Reconstructing Velocity
Reverse Engineering Motion
We know the final velocity (\(v_f = 0\)) and the distance (\(d\)). We need the initial velocity (\(v_i\)).
The Derivation:
\( 0^2 = v_i^2 + 2ad \)
\( v_i = \sqrt{-2ad} \)
Friction Coefficient (\(\mu\))
In forensics, acceleration is often given by the road's friction: \(a = -\mu g\).
\( v_i = \sqrt{2 \mu g d} \)
Standard Forensic Speed Formula
Case Study: The Midnight Crash
Classified
<table class="w-full text-xl border-collapse"><tbody><tr class="border-b-2 border-slate-200"><td class="py-4 font-bold text-slate-500 uppercase text-sm">Location</td><td class="py-4 font-bold">Industrial Way</td></tr><tr class="border-b-2 border-slate-200"><td class="py-4 font-bold text-slate-500 uppercase text-sm">Speed Limit</td><td class="py-4 font-bold">45 mph (20.1 m/s)</td></tr><tr class="border-b-2 border-slate-200"><td class="py-4 font-bold text-slate-500 uppercase text-sm">Skid Length</td><td class="py-4 font-bold text-blue-600">32.4 meters</td></tr><tr class="border-b-2 border-slate-200"><td class="py-4 font-bold text-slate-500 uppercase text-sm">Road Surface</td><td class="py-4 font-bold">Dry Concrete (\(\mu = 0.8\))</td></tr></tbody></table>
The Question:
Was the driver speeding? By how much? Support your claim with a full kinematic proof.
Expert Testimony
You are about to receive the full Forensic Case File. Your calculations will be the basis for the legal verdict. Precision is mandatory.
Open Case File #402
Accident Reconstruction Case File Accident
Reconstruction
Evidence Grade A
Case File: #2026-IND-402
Subject: Industrial Way Collision | Forensic Analysis
Officer's Statement
"On the night of Jan 16, a black sedan struck a stationary concrete barrier. The driver, Subject X , claimed they were traveling at or below the posted speed limit of 45 mph (20.1 m/s) . Subject X stated that a 'mechanical failure' caused the car to accelerate, and they applied the brakes immediately. Upon arrival, my team measured four distinct skid marks leading directly to the impact point."
Evidence Summary
Avg. Skid Length (\(d\))
32.4 meters
Road Surface
Dry Asphalt
Friction Coeff. (\(\mu\))
0.75
Analysis Task 1: Deceleration (\(a\))
Calculate the constant deceleration of the vehicle using the friction coefficient. (\(a = -\mu g\), where \(g = 9.8 \text{ m/s}^2\)).
Calculated \(a\):
m/s²
Analysis Task 2: Initial Velocity (\(v_i\))
Use the "No-Time" kinematic equation to solve for the speed of the car at the moment the brakes locked. (\(v_f^2 = v_i^2 + 2ad\)). Note: \(v_f = 0\).
Impact Speed (\(v_i\)):
m/s
Final Expert Testimony
Finding A: Comparison to Speed Limit
The speed limit was 45 mph (20.1 m/s). Was the driver speeding? If so, by what percentage?
Finding B: Reliability Analysis
The driver claims they hit the brakes "immediately." Does your calculation account for the Reaction Phase ? If we included a 1.0s reaction time, would the calculated speed be higher or lower than what you just found?
The Verdict
In your professional opinion, is the driver's statement ("I was doing the speed limit") consistent with the physical evidence? Use data to justify your answer.
Signature of Forensic Lead
End of Record #2026-IND-402
Case Analysis Answer Key Answer Key: Case #402
Classified Technical Reference
Task 1: Deceleration (\(a\))
\( a = -\mu g \)
\( a = -(0.75)(9.8 \text{ m/s}^2) \)
\( a = -7.35 \text{ m/s}^2 \)
Task 2: Initial Velocity (\(v_i\))
\( v_f^2 = v_i^2 + 2ad \)
\( 0 = v_i^2 + 2(-7.35)(32.4) \)
\( v_i^2 = 476.28 \)
\( v_i = \sqrt{476.28} \)
\( v_i = 21.82 \text{ m/s} \)
Conversion: \( 21.82 \text{ m/s} \times 2.237 \approx \mathbf{48.8 \text{ mph}} \)
Expert Verdict Reasoning
Speed Comparison:
Calculated speed (21.82 m/s) is higher than the speed limit (20.1 m/s). The driver was traveling approximately 3.8 mph over the limit at the moment the brakes locked.
The Reaction Phase Impact:
The skid marks only show the braking phase. If we account for a 1.0s reaction time, the car would have been traveling at its initial speed for an extra 21.8 meters BEFORE the skid began. The true initial speed would be even higher if we had to calculate it from a point further back, or the total stopping distance would be significantly longer than the evidence shows.
Final Verdict:
The driver's statement is Inconsistent with the evidence. The minimum speed required to leave 32.4m of skid marks on this surface is 48.8 mph, which exceeds the 45 mph limit.
Safety Proposal Slides Safety Proposal
Final Capstone: Forensic Motion Analysis
PUBLIC SAFETY ADVISORY BOARD
From Analyst to Engineer
You have mastered the physics of stopping. Now, use it to save lives.
The Directive
Identify a local intersection, school zone, or highway stretch that feels "dangerous." Use kinematic data to propose a specific, physics-backed change.
Synthesize Data
Calculate Limits
Identify Sites
Pitch Solution
Your Project Requirements
1. Problem Identification
Detailed description of the site and why the current kinematic parameters (speed, light timing) fail.
2. Math Defense
You must provide calculations for Total Stopping Distance (Reaction + Braking) at current vs. proposed speeds.
3. Technical Brief
A professional proposal including a diagram and a "Safety Margin" analysis.
Engineering Toolbox
What can you change to improve safety?
Speed Limit Reduction
Decreasing speed has a quadratic effect on safety. Dropping from 40 to 30 mph reduces braking distance by nearly half.
Yellow Time Adjustment
Increasing yellow duration to eliminate the dilemma zone at specific speed limits.
Surface Refacing
Applying high-friction asphalt treatments to critical braking zones (near schools/crosswalks) to increase \(a\).
Visibility & Signs
Reducing reaction time (\(t_r\)) by making hazards more visible earlier.
The City Council
Next class, you will present your brief to the Council. You must be prepared to defend your numbers against "budget hawks" (your peers) who want to know exactly why these changes are necessary.
Begin Drafting
Safety Improvement Brief Template Road Safety Improvement Brief
Official Technical Proposal | Municipal Safety Board
1. Site Location & Profile
Intersection / Road Name
Existing Speed Limit
Primary Safety Hazard
(e.g., Dilemma zone, short sightlines, high pedestrian traffic)
Site Map / Diagram Area
Sketch the current road layout, indicating problem areas, traffic lights, or crosswalks.
2. The Physics Argument
Show how current motion parameters create a safety risk. Include reaction time (1.0s) and deceleration (\(a = -6.5 \text{ m/s}^2\)).
Current Safety Distance
Calculate Total Stopping Distance at CURRENT speed limit:
Total Dist:
Proposed Safety Distance
Calculate Total Stopping Distance at PROPOSED speed limit:
Total Dist:
3. Proposed Solution
Key Recommendation
Reduce Speed Limit
Increase Yellow Time
Surface Friction Treatment
Impact Statement
By implementing this change, the stopping distance is reduced by _______ meters . Explain why this specific distance matters for the safety of this site (e.g., "This allows a car to stop before the crosswalk instead of inside it").
Prepared By:
Safety Reconstruction Specialist
Filing Date:
2026-01-17