Analysis of probability distribution graphs to understand temperature as an average energy. Revised with 24px+ font sizes and high-impact visuals.
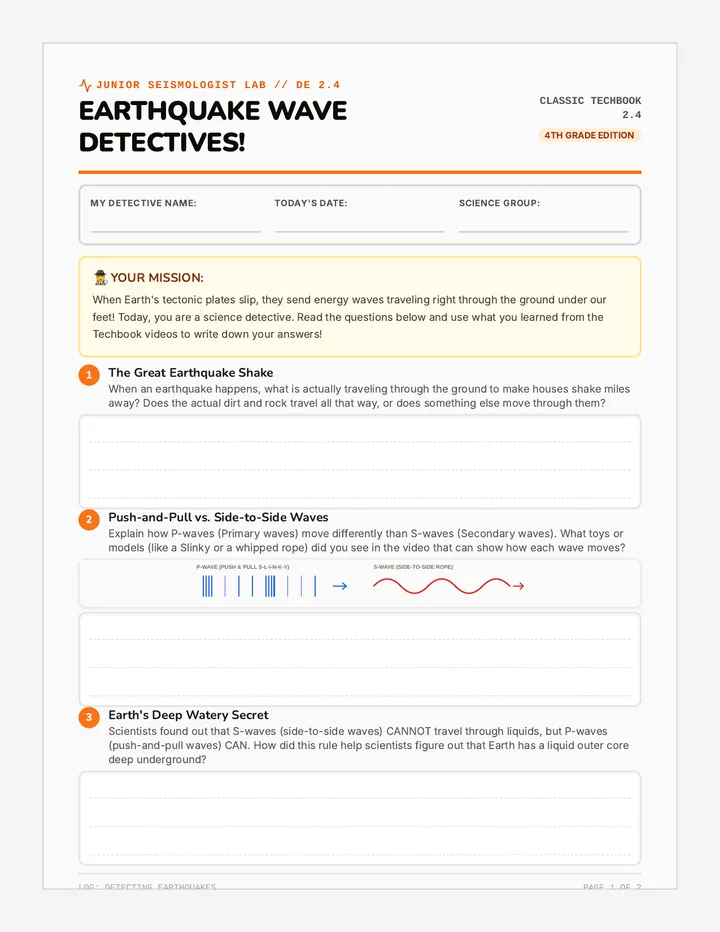
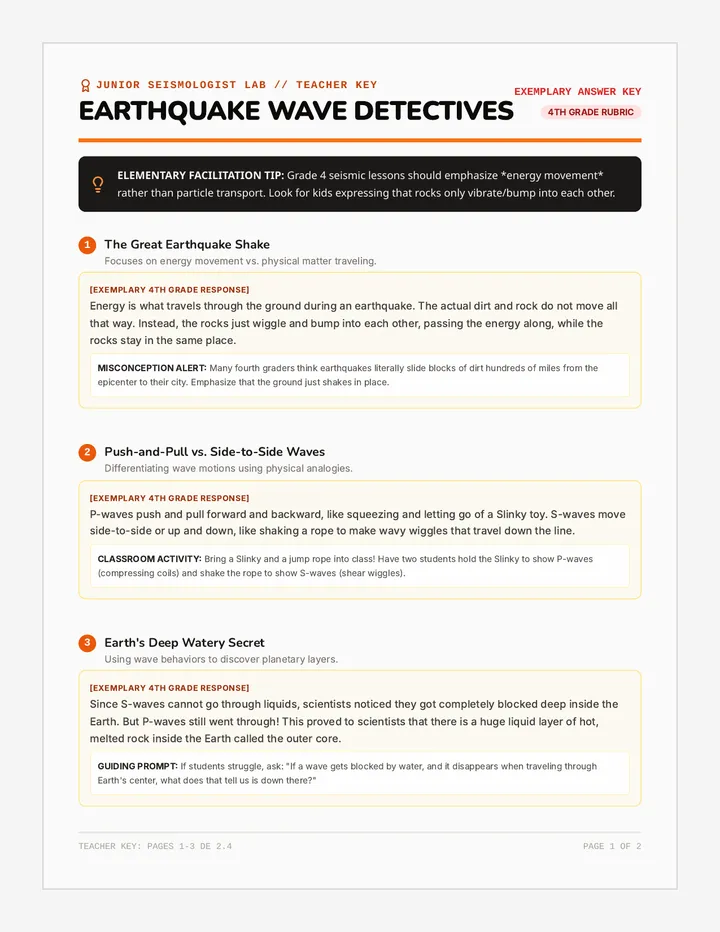
An earth and space science curriculum unit covering dynamic earth processes, earthquake wave mechanics, atmospheric pressure systems, and weather prediction techniques.
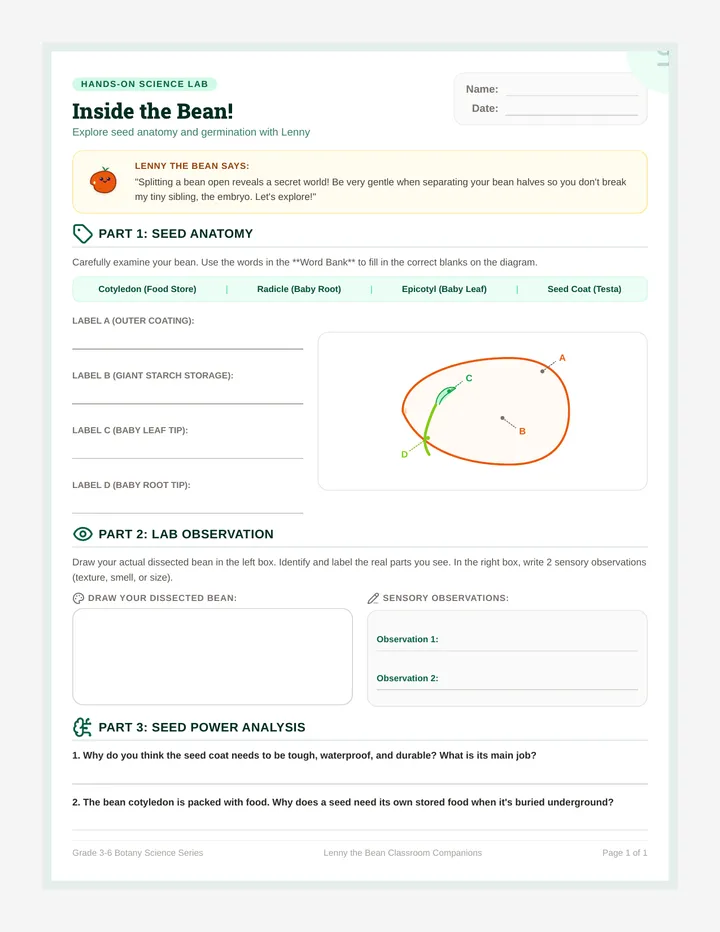
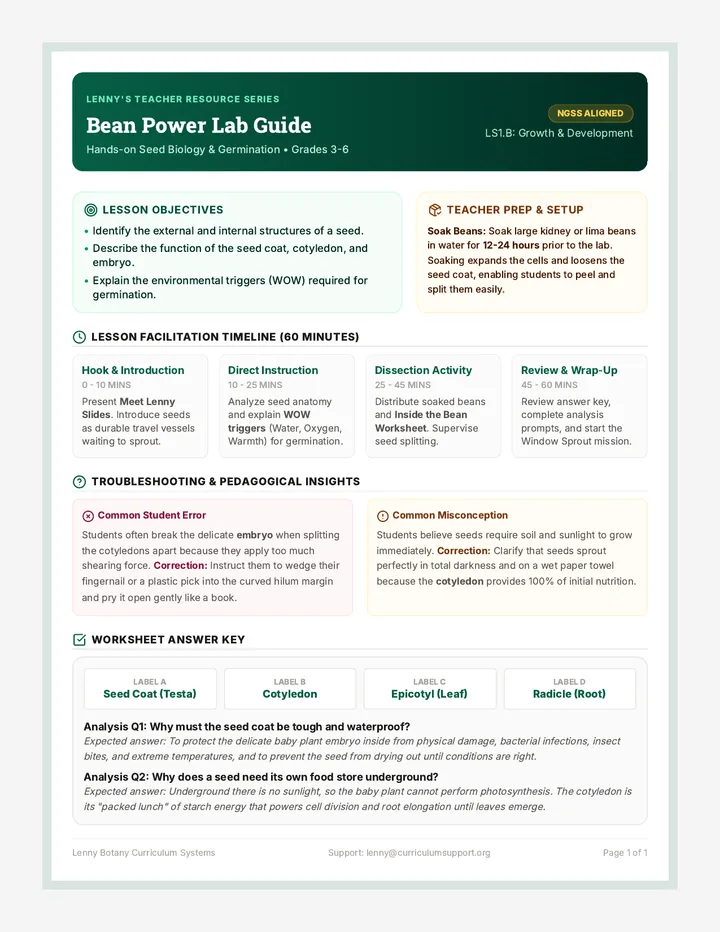
Explore the fascinating biology of seeds and germination guided by Lenny the Bean! Students will dissect a bean, identify its parts, and understand how a tiny seed contains everything needed to start a new life.
A comprehensive facilitation and answer guide for teachers using the Bean Power lesson. It features alignment with standards, a lesson timeline, lab safety/setup instructions, and a completed answer key for the student worksheet.
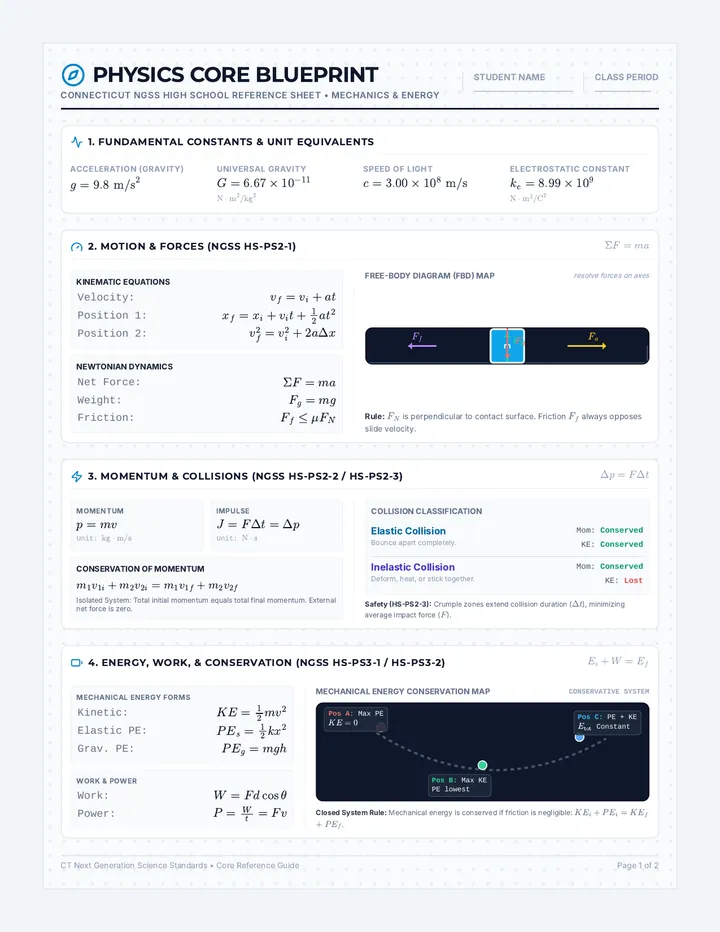
A comprehensive high school physics curriculum sequence aligned with the Connecticut Next Generation Science Standards (CT-NGSS), focusing on core concepts, quantitative problem-solving, and visual models.
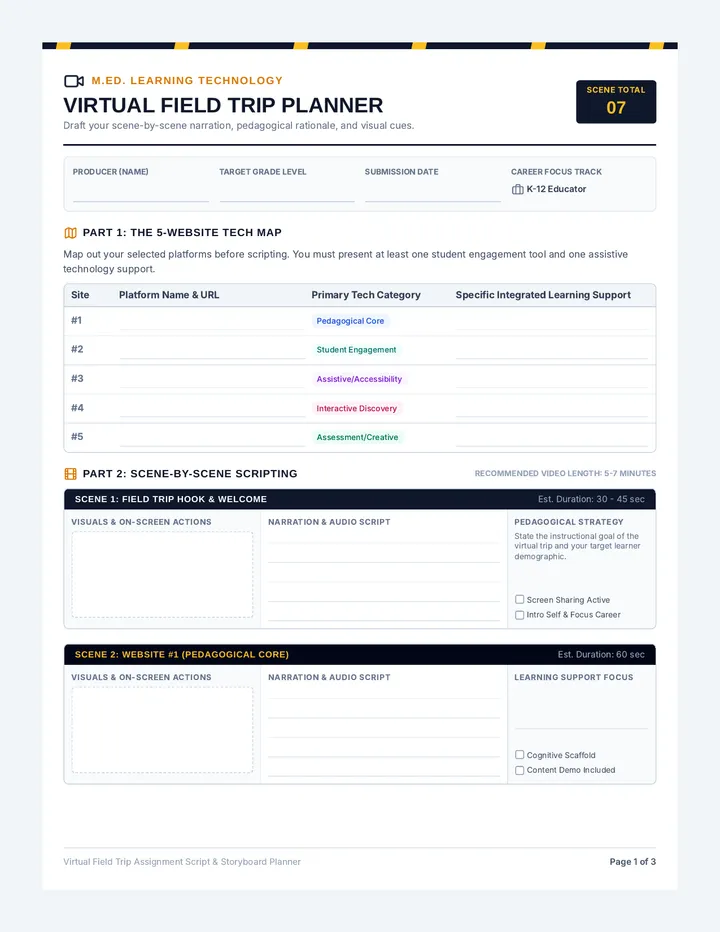
A master-level course module focusing on educational technology integration. Students design and record an online field trip showcasing five pedagogically sound websites, their integrated learning supports, and future career applications.
A printable student worksheet for the bean dissection activity. It features labeling exercises, space for hand-drawing observations, and comprehension questions, all guided by Lenny the Bean.
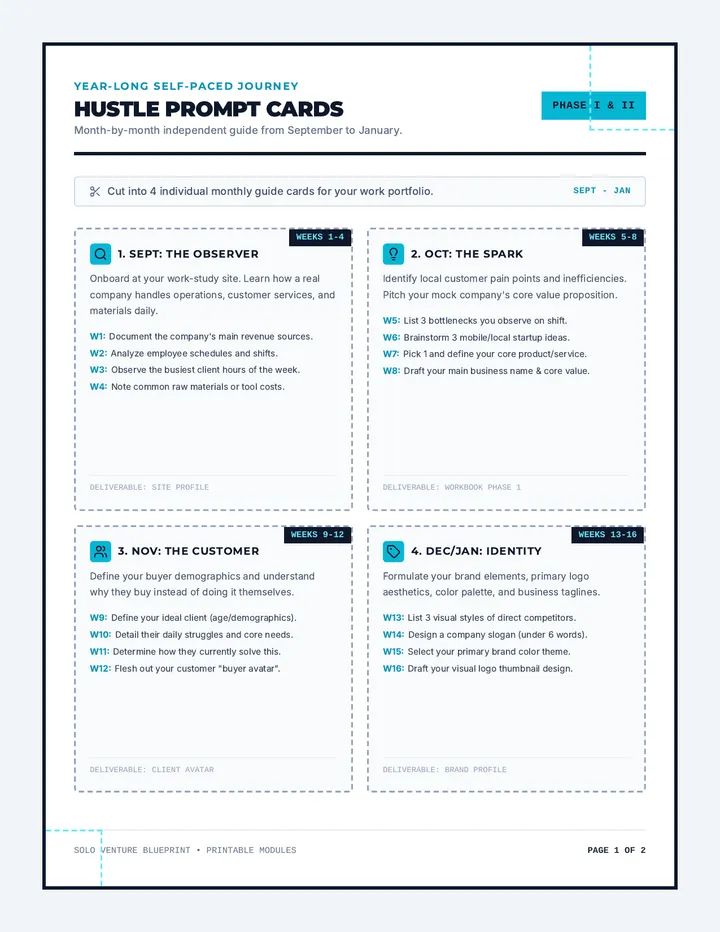
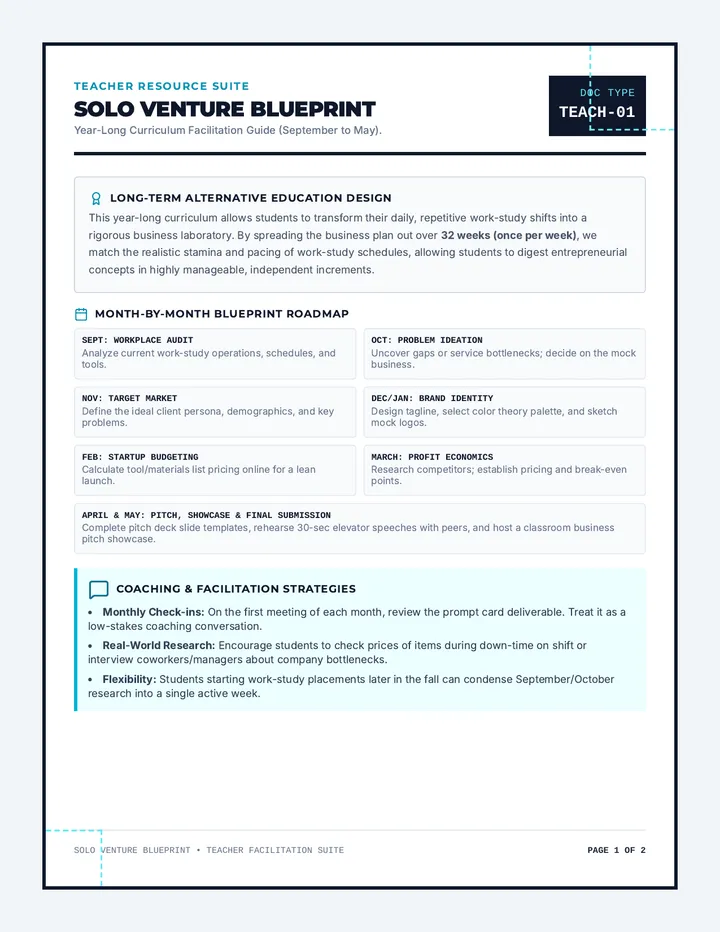
A year-long, self-paced entrepreneurship curriculum spanning September to May for alternative education students in work-study placements. Students transform real-world work experience into a modular business plan and slide presentation.
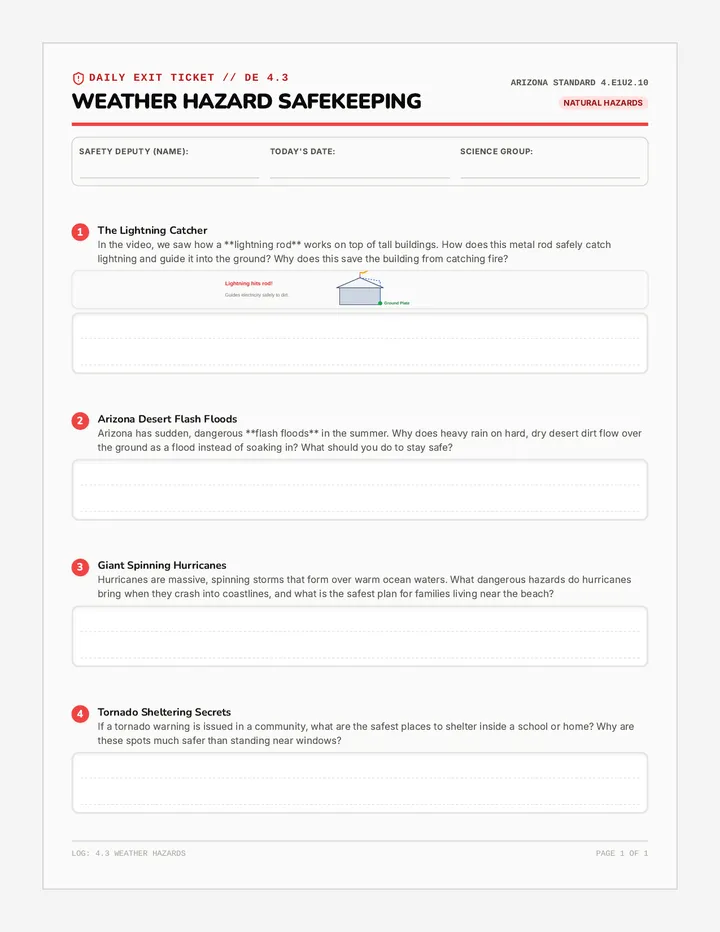
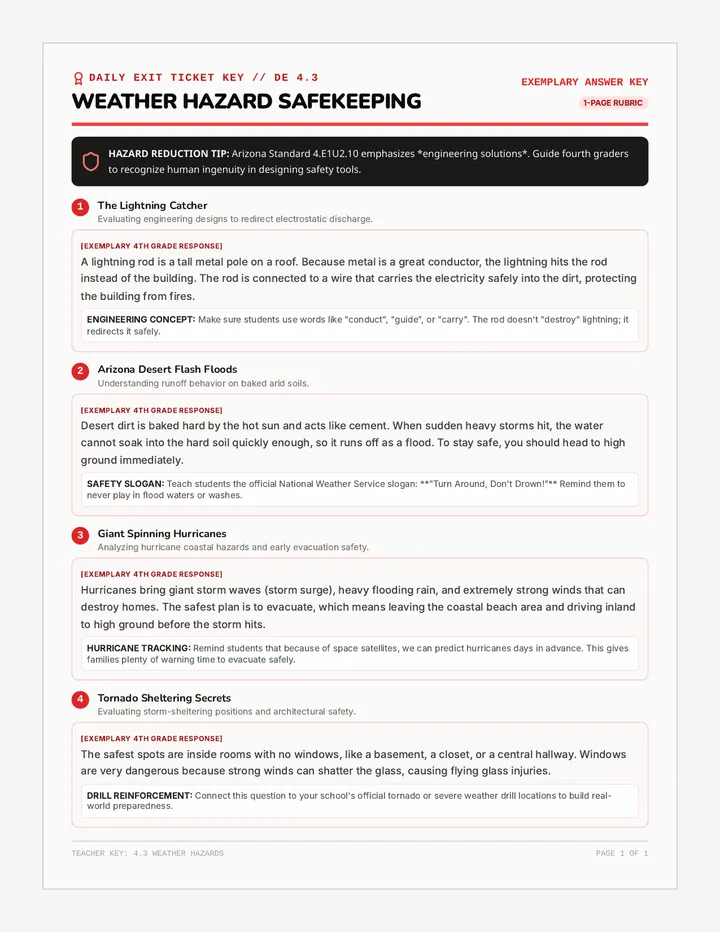
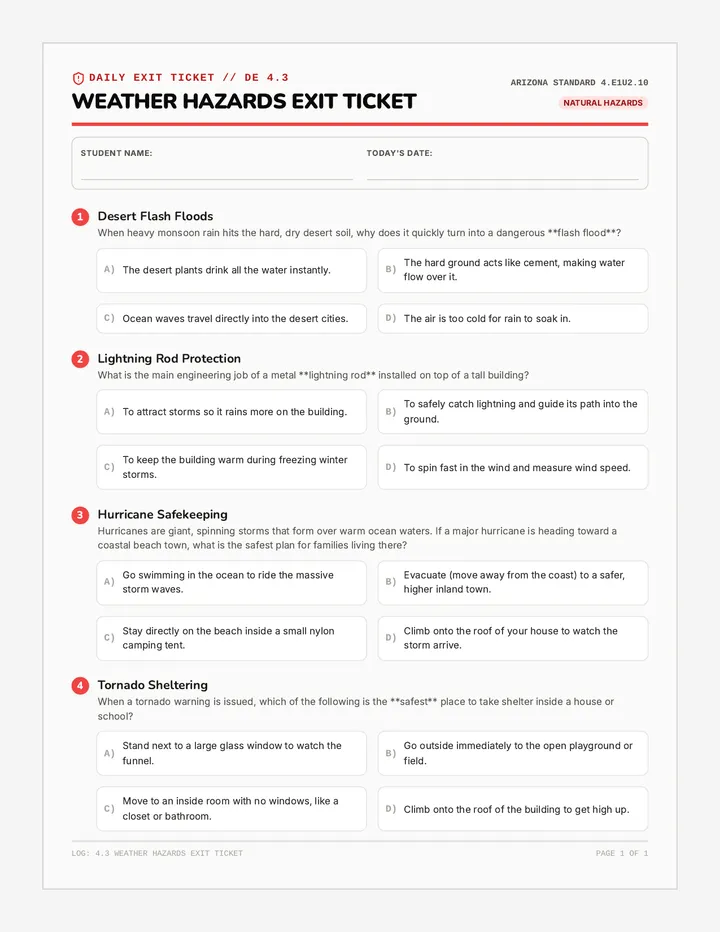
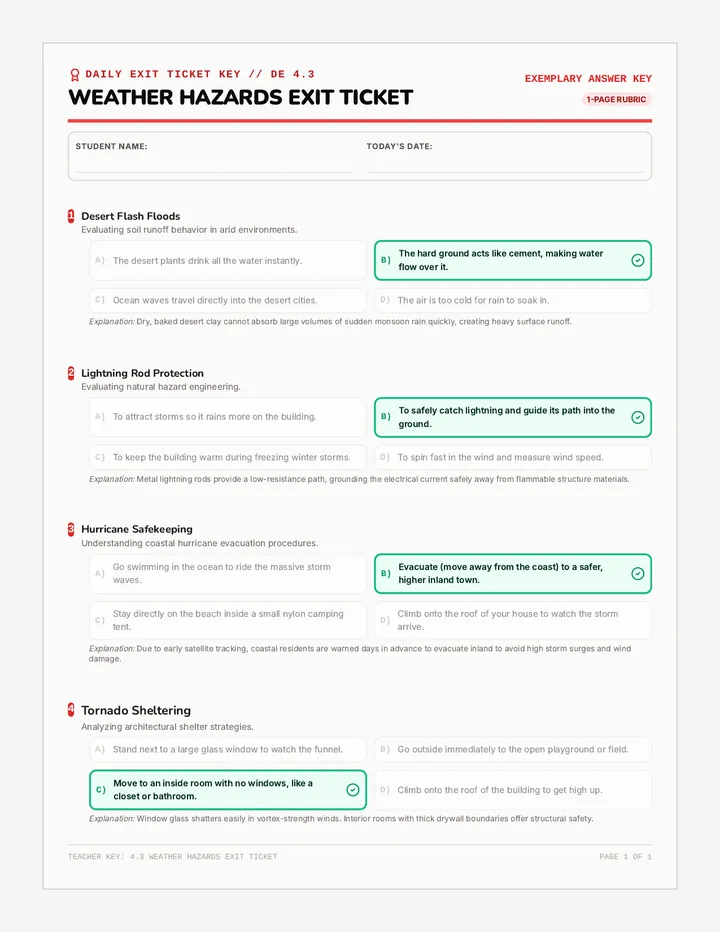
Students identify different types of severe weather hazards (like lightning, tornadoes, flash floods, and dust storms) and explore engineering solutions designed to keep communities safe.
A visually stunning, interactive slide deck featuring Lenny the Bean. This presentation teaches seed anatomy, germination, and guides students through a hands-on bean dissection with a fun, engaging science narrative.
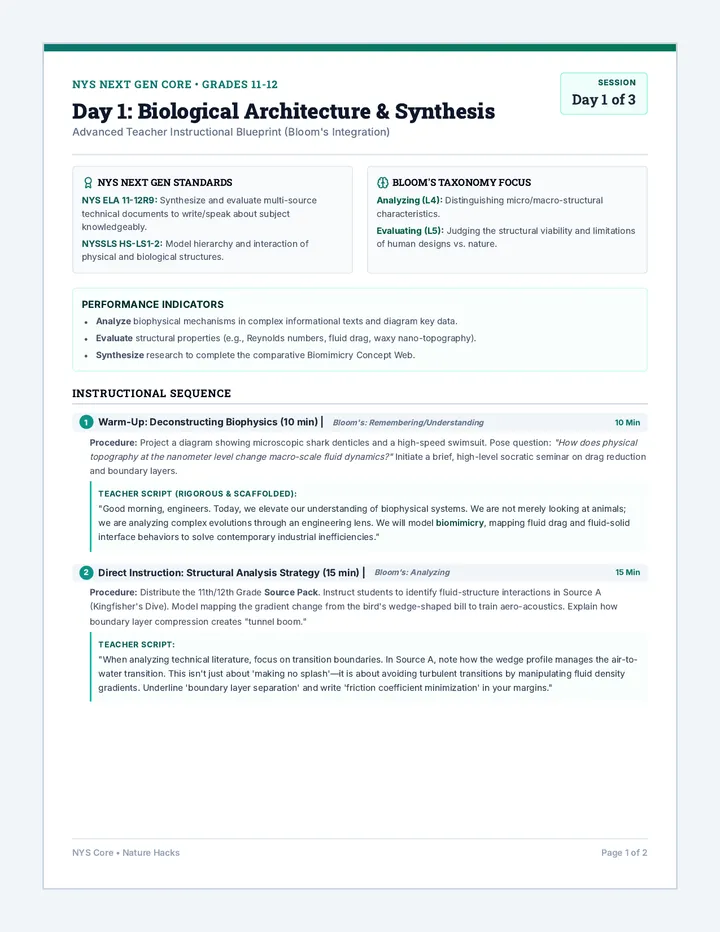
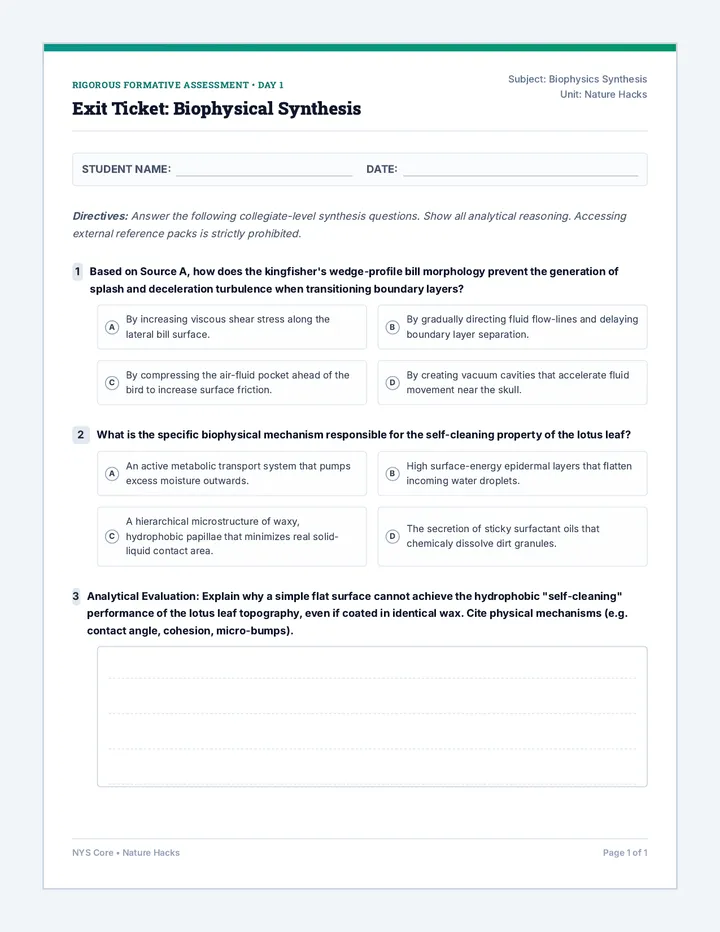
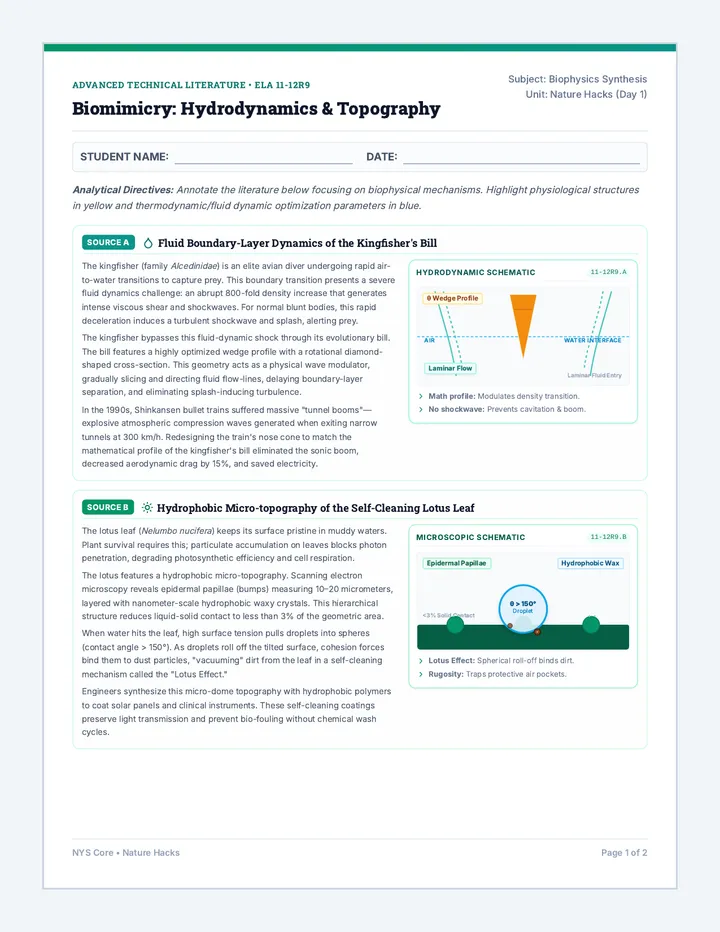
A 3-day cross-curricular STEAM unit where students research biological adaptations, design biomimetic engineering solutions, perform scale calculations, and write a synthesized informational article.
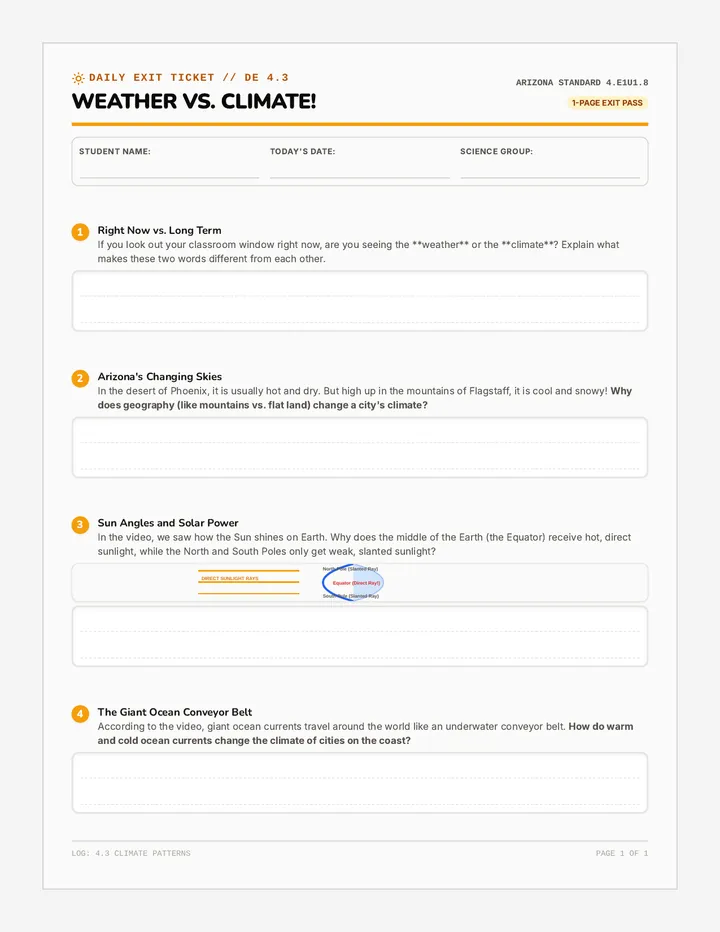
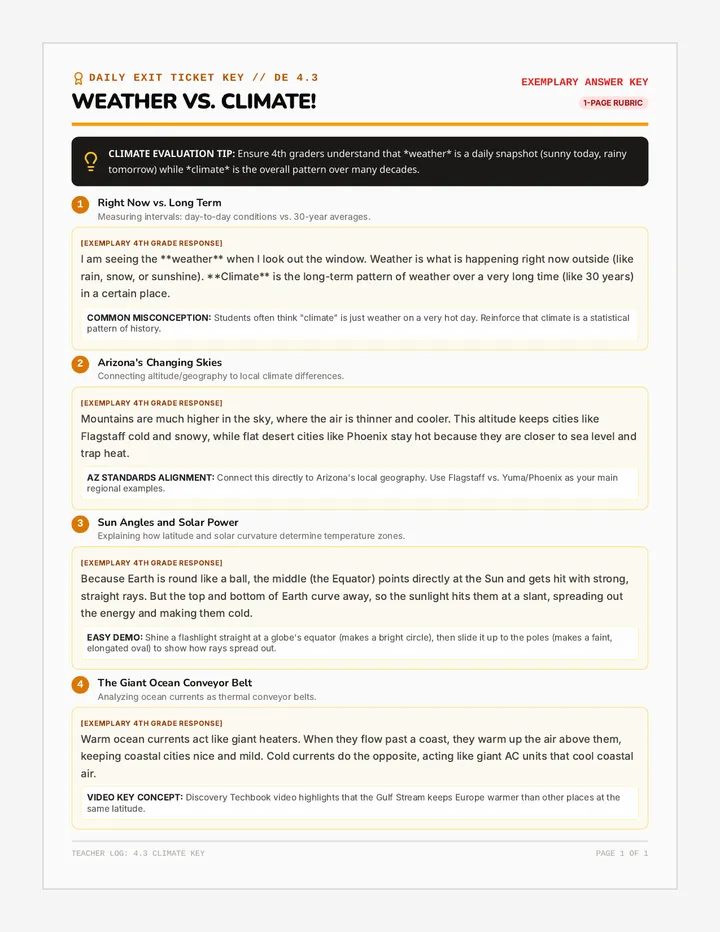
Students explore the key differences between weather and climate patterns, analyzing temperature, precipitation, and regional zones over time using global climate models.
A stunning, highly professional 6-slide presentation guiding Master's students through the pedagogical requirements, website categories, and submission expectations for their Virtual Field Trip video project.