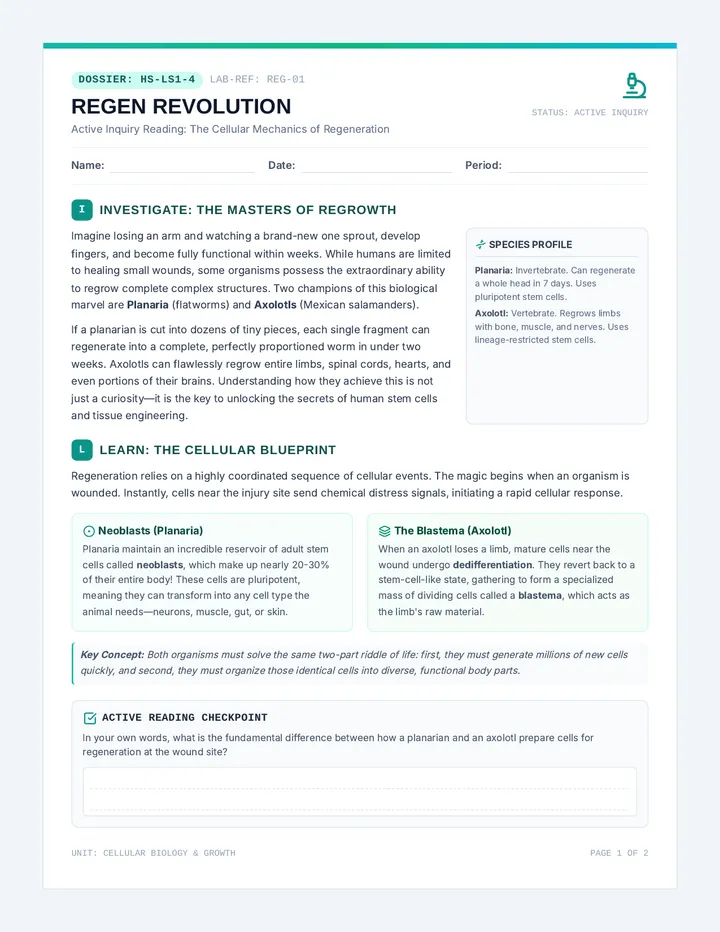
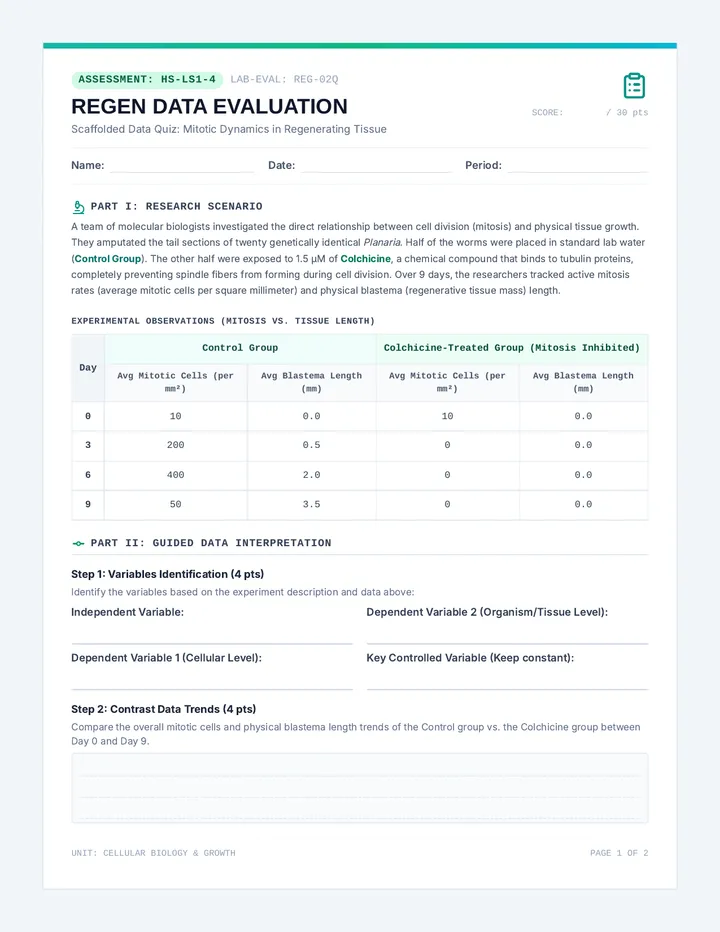
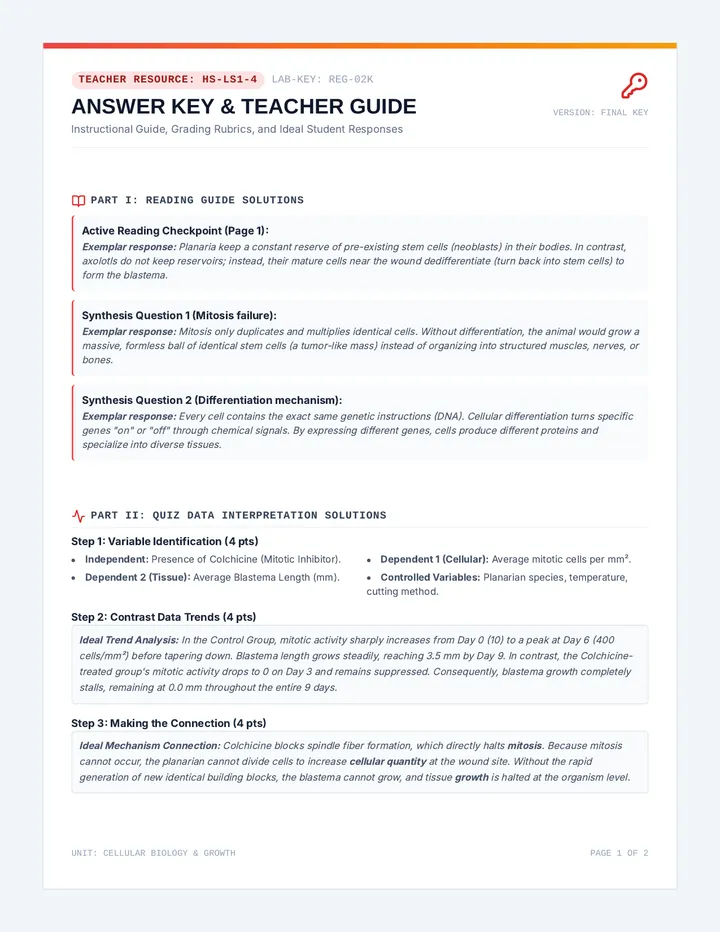
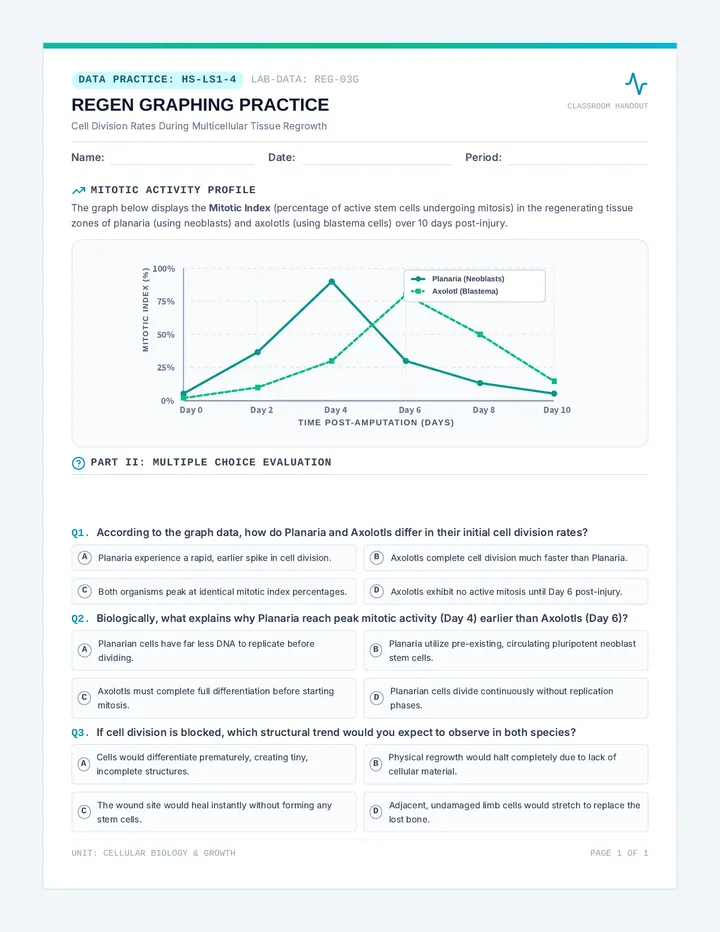
Tectonic Tempests Slides Tectonic
Tempests
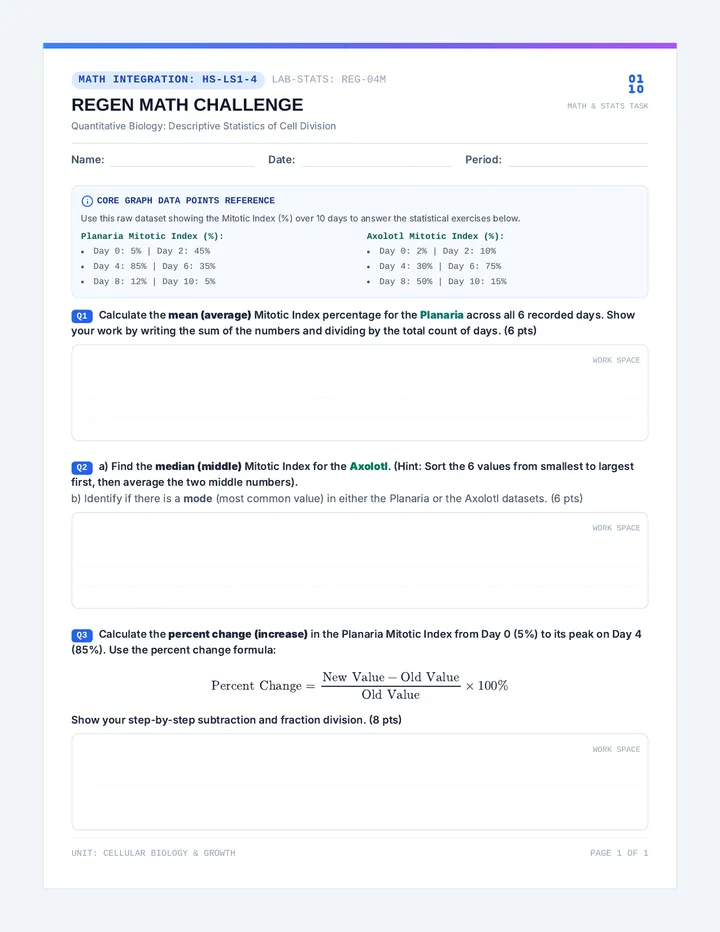
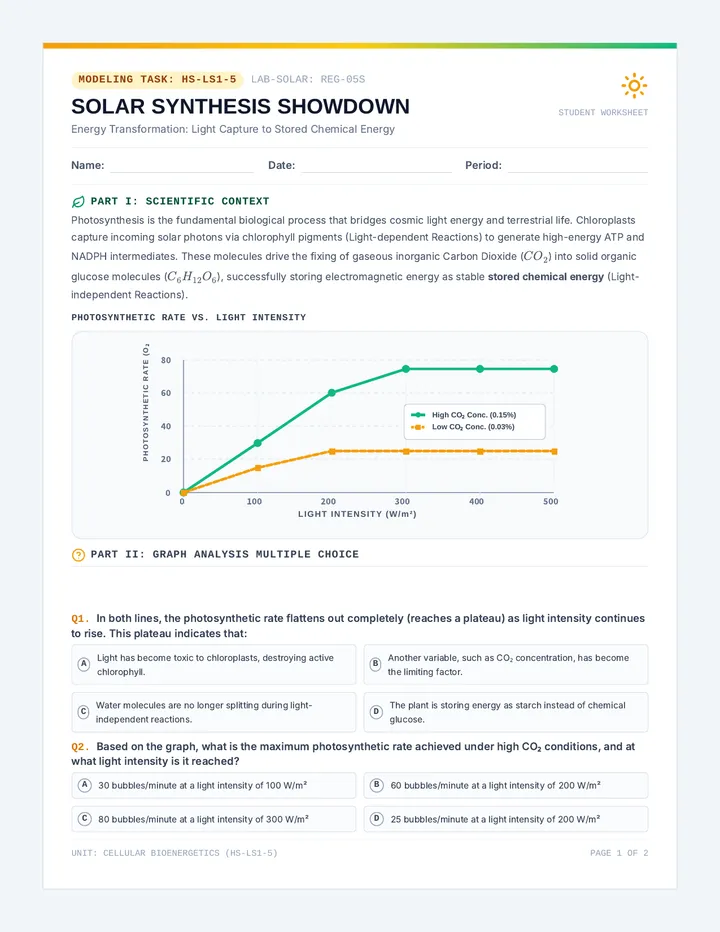
GED Science: Data & Mapping
Today's Mission
Interpreting Evidence
GED Science isn't just about facts—it's about interpreting data . Today we will:
Read complex tectonic maps and legends.
Identify P-wave and S-wave patterns.
Calculate Richter Scale magnitude differences.
"Patterns exist even in the ground beneath your feet."
Decoding the Map
Legend
Volcano
Quake > 7.0
Convergent
GED Strategy
Activity often follows the lines of a boundary. Focus there!
Seismic Waves: Speed vs. Arrival
P-Waves (Primary)
Fastest Waves
The "First Response." These arrive first at a station. They travel through solid and liquid.
S-Waves (Secondary)
Slower Waves
The "Second String." These arrive later. They travel only through solids.
The Lag Time
The further away the quake, the larger the gap between P and S arrival times.
The Power of 10
The Richter Scale is logarithmic . This means each whole number increase represents a 10x increase in wave amplitude.
Critical Thinking:
How much more amplitude does a Magnitude 8 have than a Magnitude 5?
Magnitude Amplitude Gain 5 Baseline (1x) 6 10x 7 100x 8 1,000x
Count the zeros: 3 Steps = 1,000x
Ready to Investigate?
Open your Seismic Sleuth Notes and Quake Data Activity . We're going to put these map-reading and wave-analyzing skills to the test!
1. Wave Data
2. Map Reading
3. Magnitude Math
Seismic Sleuth Notes Seismic Sleuth Notes
Field Observation & Data Log
Name: ________________________________
Date: ________________________________
I. The Mission
Today, I am learning to interpret evidence from ____________________ and ____________________.
Skill 1
Read complex map
____________________.
Skill 2
Compare P-Wave and
____________________ speed.
Skill 3
Calculate Richter Scale
____________________.
II. Seismic Waves
P-Waves
Arrival: ______________ at station.
Speed: ____________________.
Medium: Travels through solid and ____________________.
S-Waves
Arrival: ______________ at station.
Speed: ____________________.
Medium: Travels through ____________________ only.
Lag Time: The further away the epicenter, the ____________________ the gap between wave arrivals.
III. Magnitude Math
The 10x Logarithmic Rule
Each whole number increase on the Richter scale represents a __________ times increase in wave amplitude (ground motion).
Mag 5 to 6
10x
Mag 5 to 7
__________
Mag 5 to 8
__________
GED Challenge:
An earthquake moves from a Magnitude 3 to a Magnitude 6. How many times stronger is the wave amplitude?
Answer: ____________________ times stronger.
Variables Refresher
The independent variable is usually found on the __________ axis.
Map Refresher
Most volcanic activity occurs near tectonic plate ____________________.
V. Field Reflection
Why is monitoring gas emissions (SO2) critical for predicting eruptions? Explain the relationship between magma movement and gas levels.
Quake Data Activity Quake Data Activity
GED Practice: Interpreting Evidence & Data
NAME: __________________
DATE: __________________
PART 1
Wave Arrival Analysis
Researchers at three stations recorded arrival times for the same earthquake. Use the data to answer the questions.
Station P-Wave Arrival S-Wave Arrival Lag Time Station A 10:04:15 AM 10:04:27 AM 12 sec Station B 10:04:45 AM 10:05:35 AM 50 sec Station C 10:04:25 AM 10:04:45 AM __________
Q1. Data Entry
Calculate the missing Lag Time for Station C above.
Q2. Interpretation
Which station is FURTHEST from the epicenter?
Reasoning Lab
"Explain why Lag Time helps scientists determine distance. Use 'Station B' in your answer."
PART 2
Magnitude Showdown
Magnitude Comparison
Earthquake 1: Magnitude 4.0
Earthquake 2: Magnitude 7.0
3. How much more ground motion does Earthquake 2 have than Earthquake 1?
3 times
30 times
1,000 times
10,000 times
GED Critical Thinking
Quake A is Mag 4. Quake B is Mag 5. A resident says Quake B was "twice as bad." Why is this scientifically an understatement ?
PART 3
Tectonic Legend
Legend Card
Volcano
Quake Site
Boundary
4. According to the legend above, what does the red triangle represent?
5. Predict where the next "Quake Site" (Star) is most likely to appear:
Tectonic Tempests Teacher Guide Teacher Guide
Tectonic Tempests | GED Science
Subject: Earth Science
Target: Data Interpretation
Instructional Focus
This lesson targets high-frequency GED Science skills: interpreting map legends, identifying scientific variables, and extracting information from data tables. The lesson now includes a focused section on seismic wave speeds and the logarithmic Richter scale to build quantitative literacy.
Learning Objectives
Interpret P-wave and S-wave arrival data to determine distance.
Read and interpret a tectonic map legend to predict hazards.
Calculate relative earthquake strength using the logarithmic Richter scale .
GED Standards
SEP.1: Interpreting Data
SEP.3: Reason with Evidence
ESS.2: Earth's Systems & Plate Tectonics
Estimated Time:
75 - 90 Minutes
Lesson Flow
15 Min
Introduction & Maps (Slides 1-3)
Establish the "Sleuth" persona. Focus on decoding legends. Hand out Seismic Sleuth Notes .
25 Min
Seismic Waves & Richter (Slides 4-5)
Explain P/S wave arrival. Emphasize that the Lag Time is the key data point. Model the 10x Richter math.
35 Min
Independent Lab (Activity)
Students work through the Quake Data Activity . Check Station B reasoning specifically.
15 Min
Review & Debrief
Go over the answer key. Reiterate that logarithmic scales (Richter) grow much faster than linear scales.
Support Tips
Scaffolding:
For Richter math, tell students to "count the zeros." Moving from 3 to 6 is 3 steps, so add 3 zeros to the number 1 (1,000).
Visualization:
Act out P-waves (push/pull) and S-waves (side-to-side) to help students remember which travels through solids only.
Materials Checklist
Tectonic Tempests Slide Deck
Seismic Sleuth Notes (1 per student)
Quake Data Activity (1 per student)
Timers or Analog Clocks (visual aids)
Tempest Answer Key Answer Key
Tectonic Tempests Material Set
Teacher Reference Only
I. Seismic Sleuth Notes
The Mission: 1. Legends | 2. Wave Speed | 3. Richter Math.
Seismic Waves:
• P-Waves: Fast, arrive first, travel through solids & liquids.
• S-Waves: Slower, arrive second, travel through solids ONLY.
• Lag Time: Gap Increases as distance from epicenter increases.
Richter Math:
• 5 to 7 = 100x | 5 to 8 = 1,000x | Challenge: 3 to 6 = 1,000x (10x10x10).
Recap: Independent Variable (X-axis). Activity near Plate Boundaries.
II. Quake Data Activity
1. Station C Lag Time:
20 seconds
(S: 10:04:45 - P: 10:04:25)
2. Furthest Station:
Station B
Rationale: Longest lag time (50s). Waves fall further apart the longer they travel.
3. Magnitude Comparison:
1,000 times stronger
(3 steps = 10 x 10 x 10)
4. Feature Prediction:
Volcano
Critical Thinking (Understatement):
Magnitude 5 is not "twice" as bad as Magnitude 4. It is 10 times stronger in wave amplitude. A factor of 2 underestimates the seismic power by a massive margin.
5. Next Quake Site:
Along the black boundary lines or near existing clusters.
Tectonic Tempests | Educator Master Key