An analysis of the tempo of evolution through time, testing the hypothesis of punctuated equilibrium against phyletic gradualism. Students apply statistical models to differentiate between random walks and directional selection.
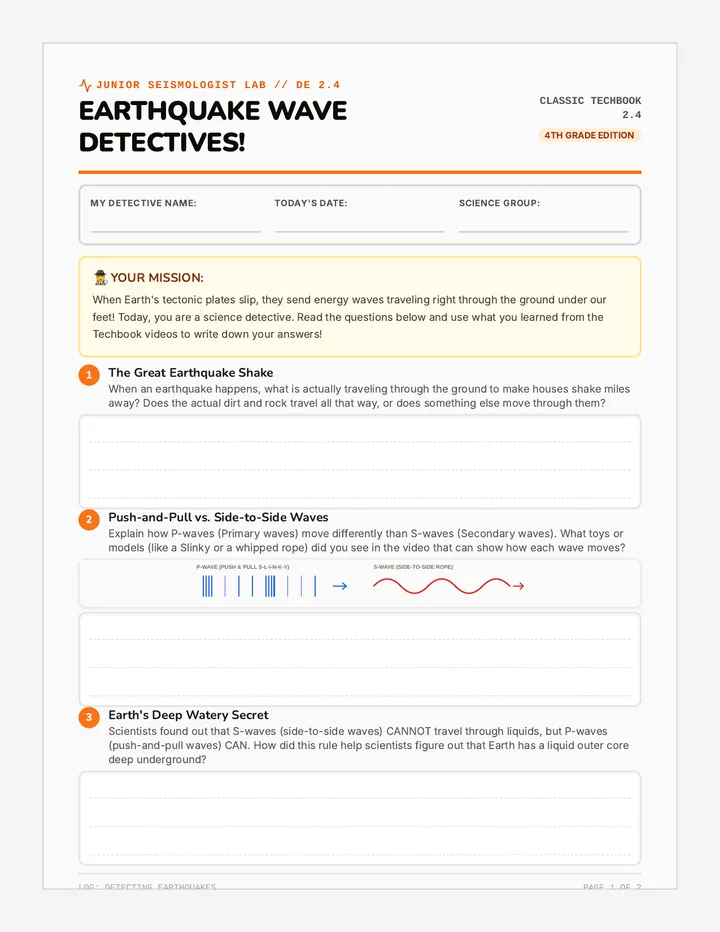
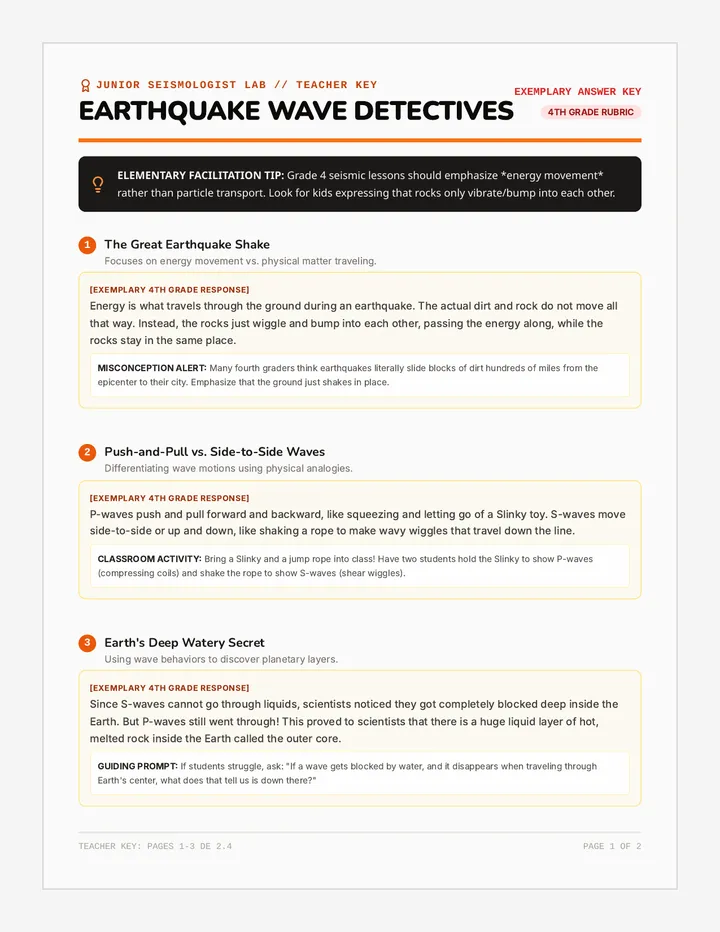
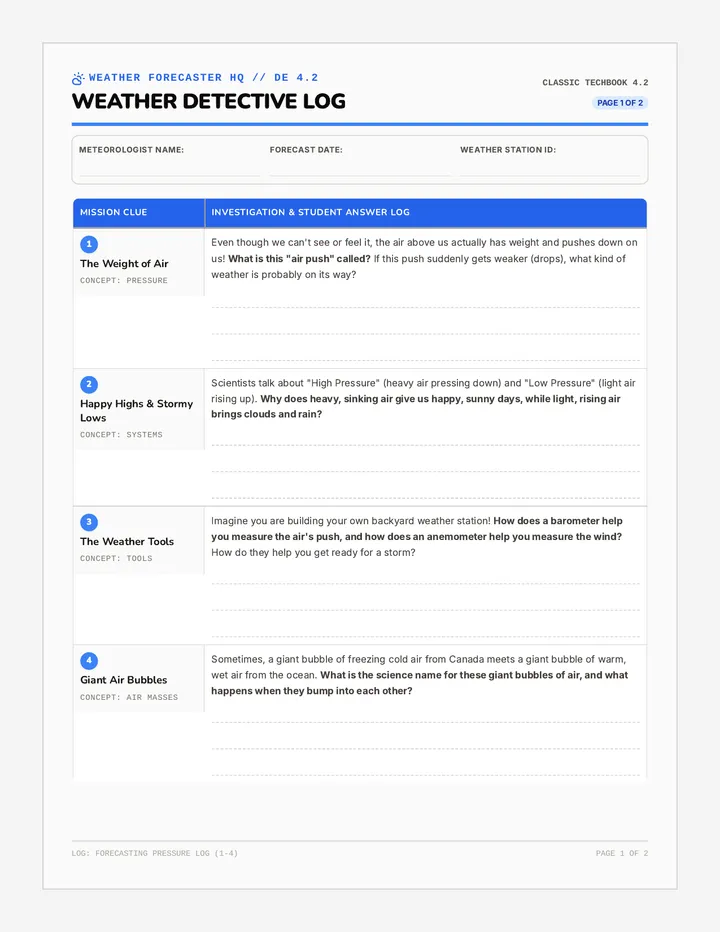
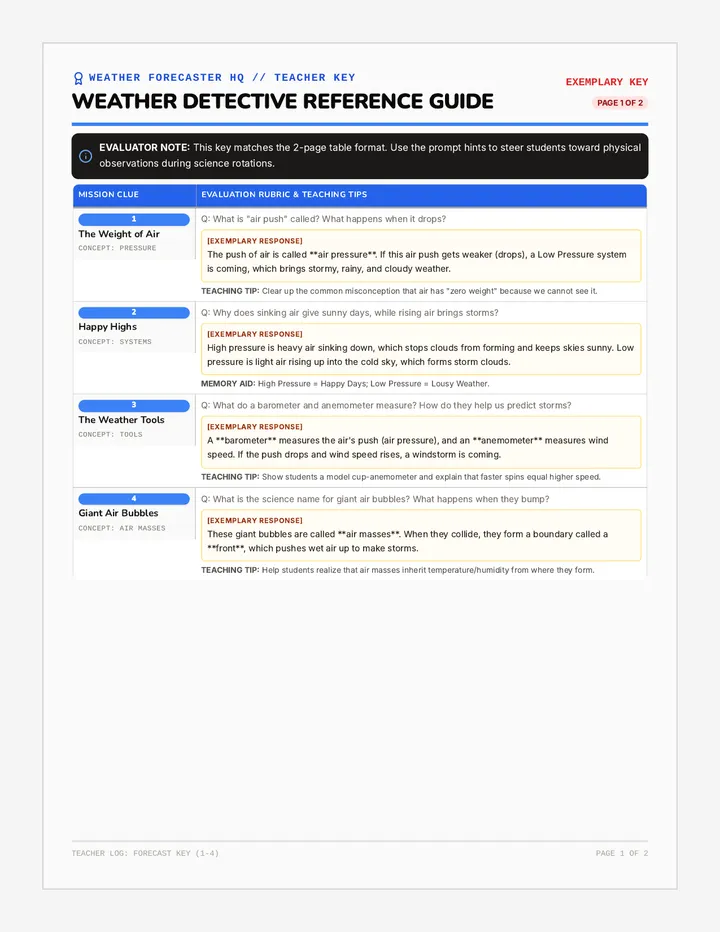
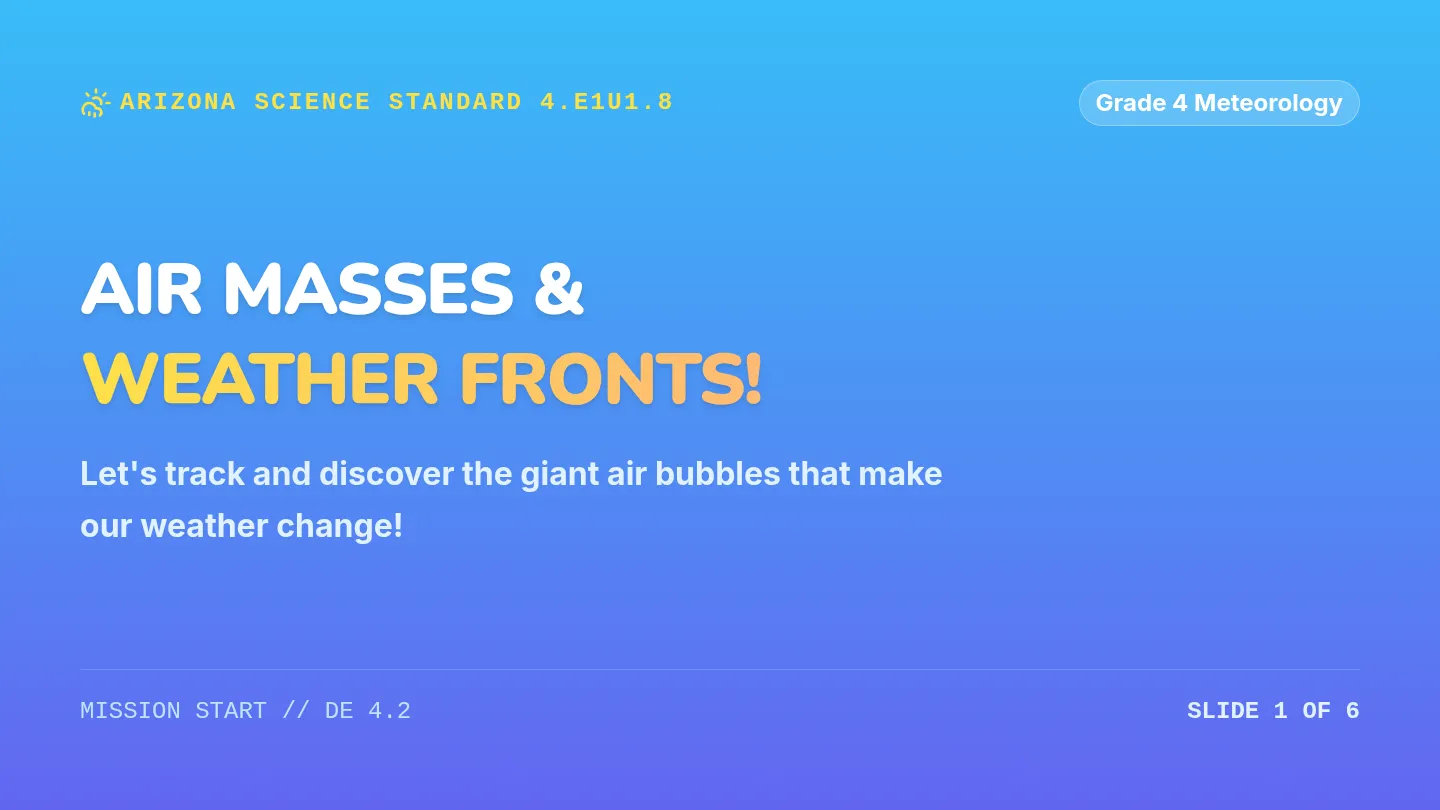
An earth and space science curriculum unit covering dynamic earth processes, earthquake wave mechanics, atmospheric pressure systems, and weather prediction techniques.
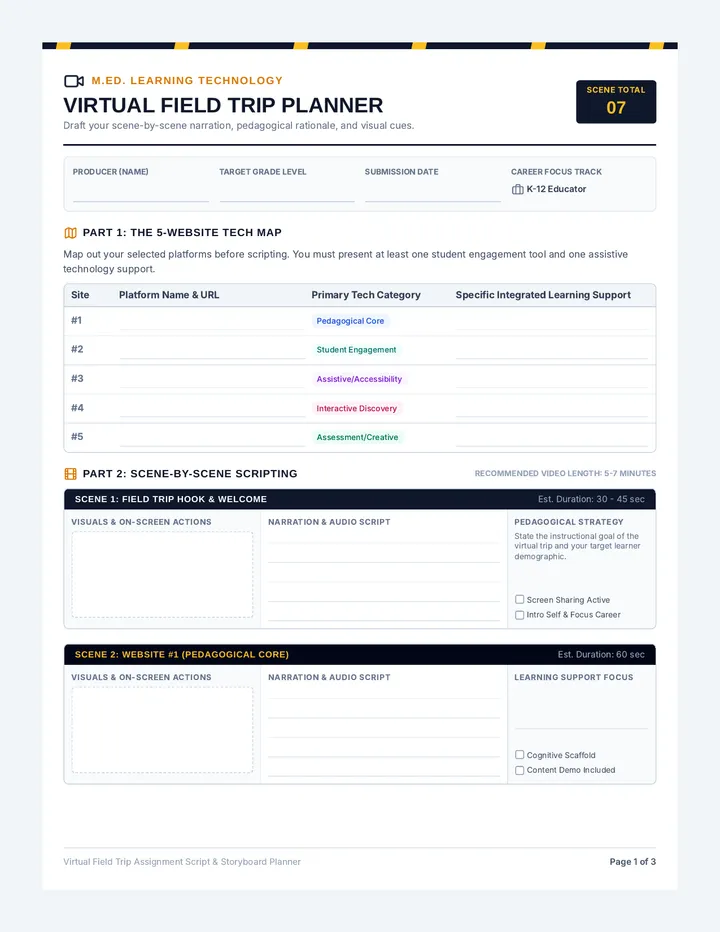
A master-level course module focusing on educational technology integration. Students design and record an online field trip showcasing five pedagogically sound websites, their integrated learning supports, and future career applications.
A stunning, highly professional 6-slide presentation guiding Master's students through the pedagogical requirements, website categories, and submission expectations for their Virtual Field Trip video project.
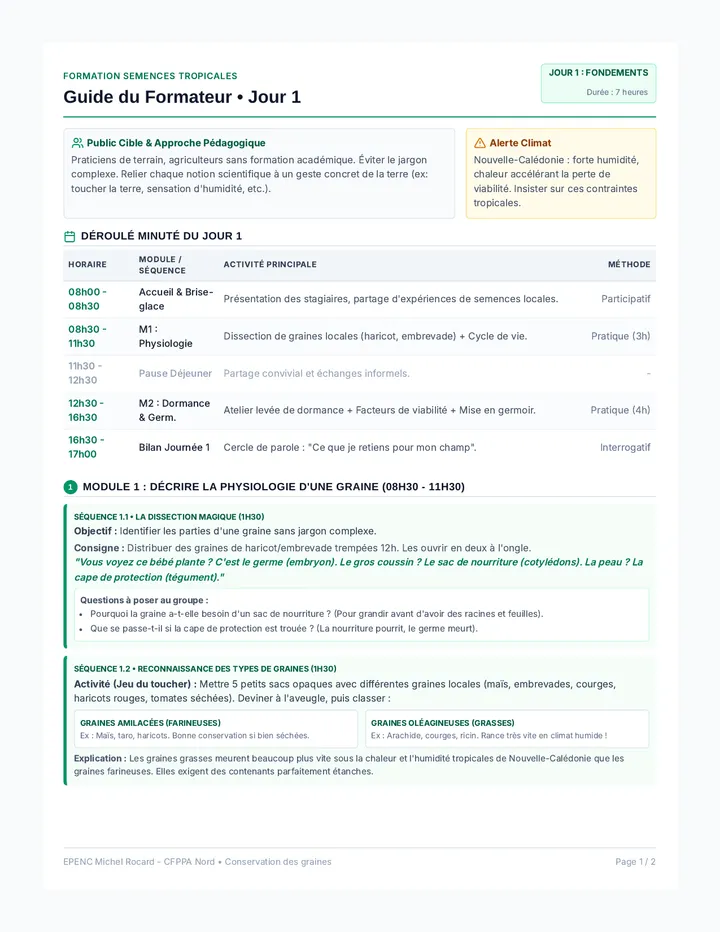
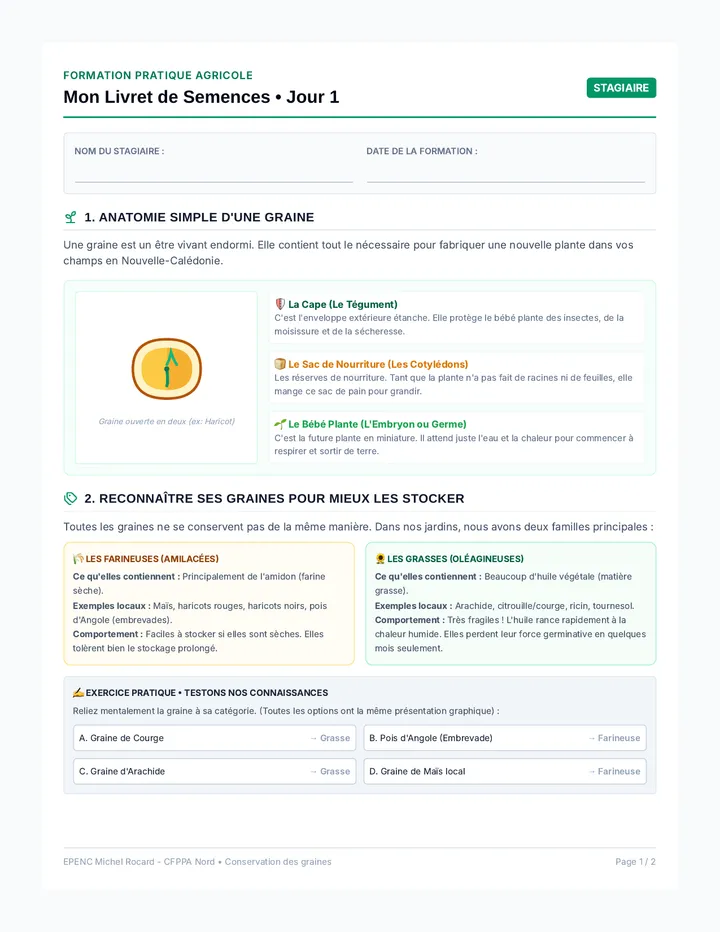
Cette séquence de formation de 14 heures sur 2 jours est conçue spécifiquement pour les praticiens de terrain en Nouvelle-Calédonie (milieu tropical). Elle couvre la physiologie des graines, la germination, les techniques de conservation à court et long terme (séchage, conditionnement) et intègre un module spécialisé sur la conservation des semences de tubercules locaux (igname, patate douce, manioc, taro).
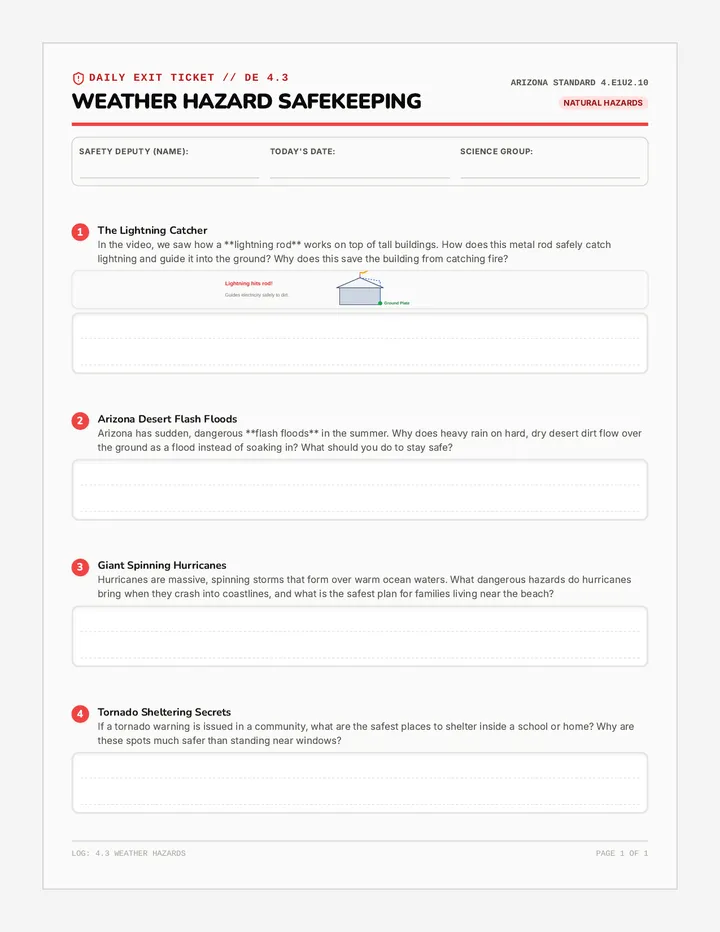
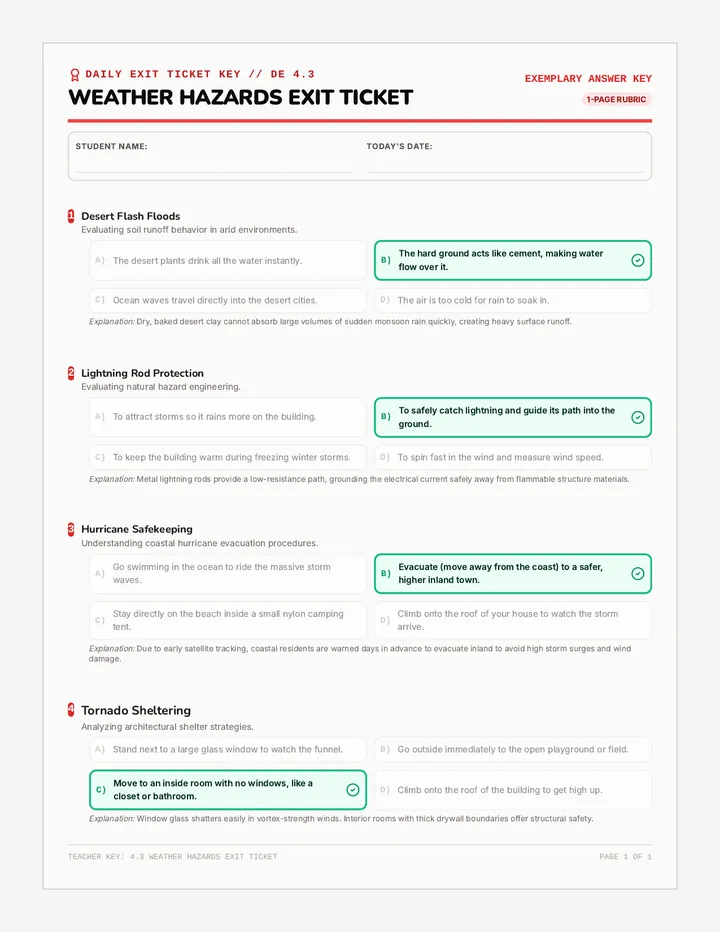
Students identify different types of severe weather hazards (like lightning, tornadoes, flash floods, and dust storms) and explore engineering solutions designed to keep communities safe.
A comprehensive, high-quality 3-page storyboard and script planner designed for M.Ed. students to map out their virtual field trip video, showcasing pedagogical websites, student engagement platforms, and assistive technologies.
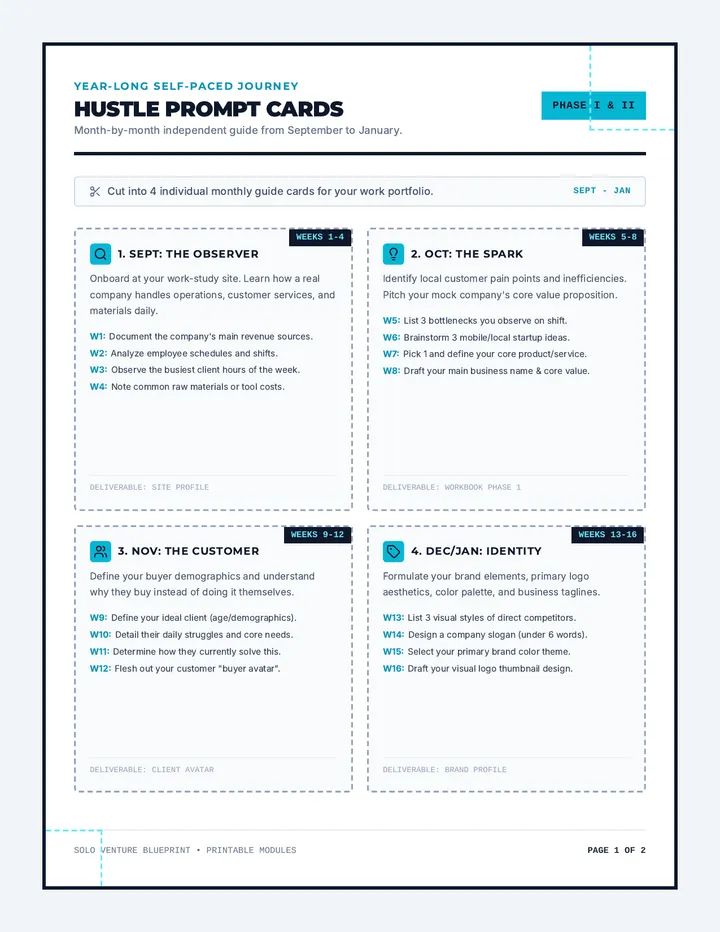
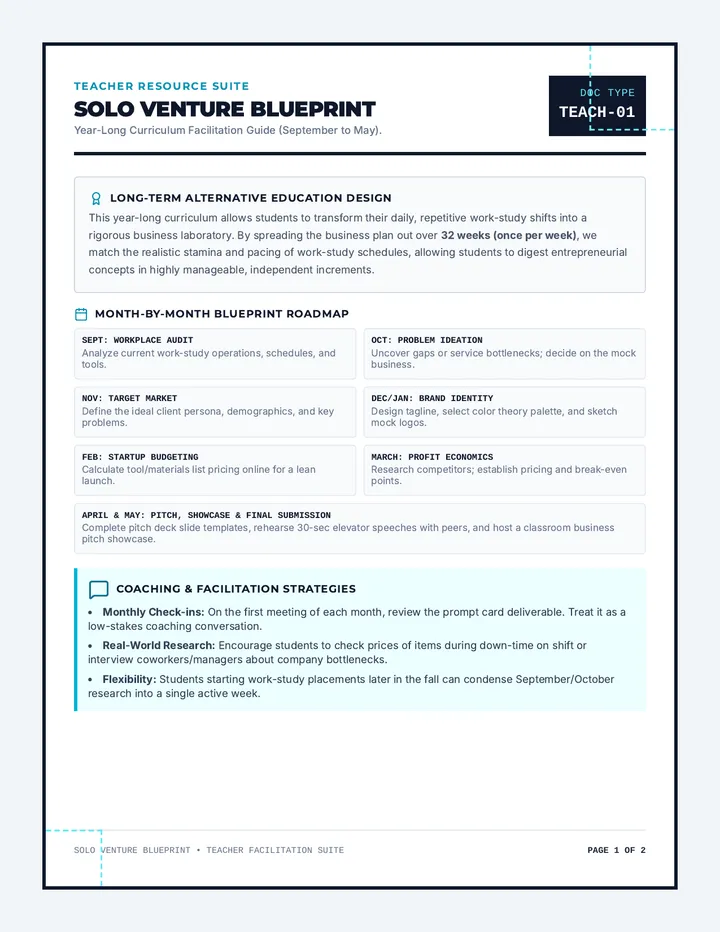
A year-long, self-paced entrepreneurship curriculum spanning September to May for alternative education students in work-study placements. Students transform real-world work experience into a modular business plan and slide presentation.
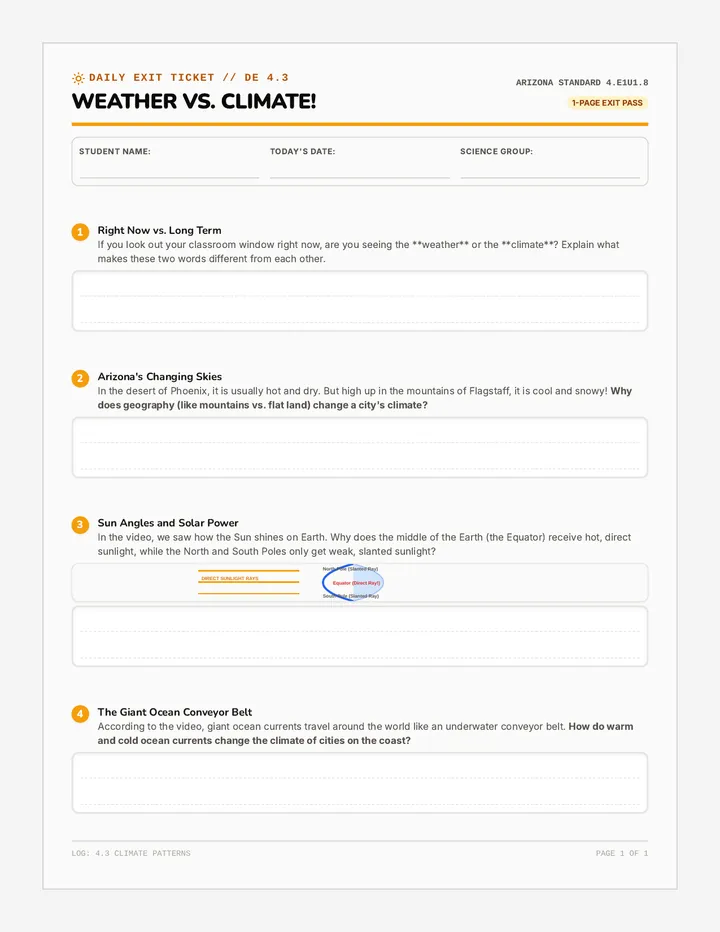
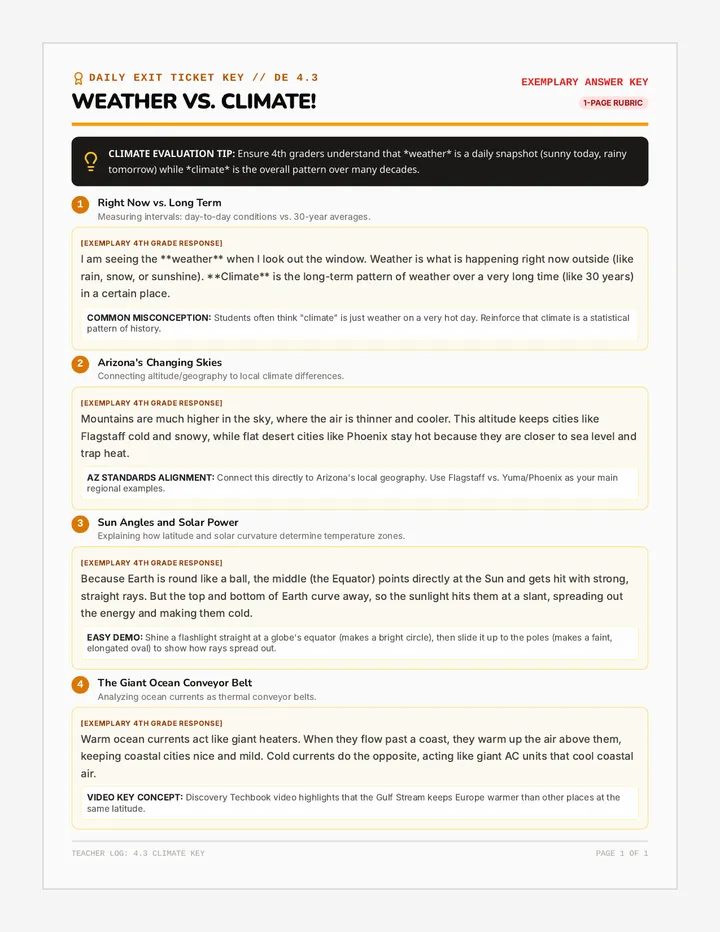
Students explore the key differences between weather and climate patterns, analyzing temperature, precipitation, and regional zones over time using global climate models.
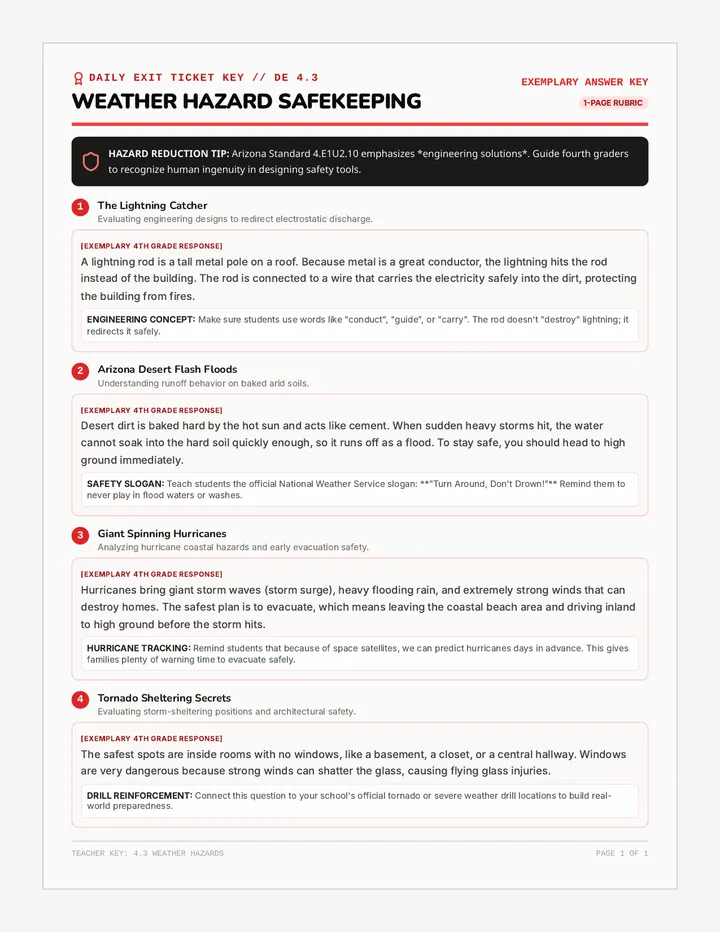
A comprehensive teacher answer key and scoring guide for the 4th-grade Weather Hazards Multiple Choice Quiz, clearly identifying correct choices and explanations.
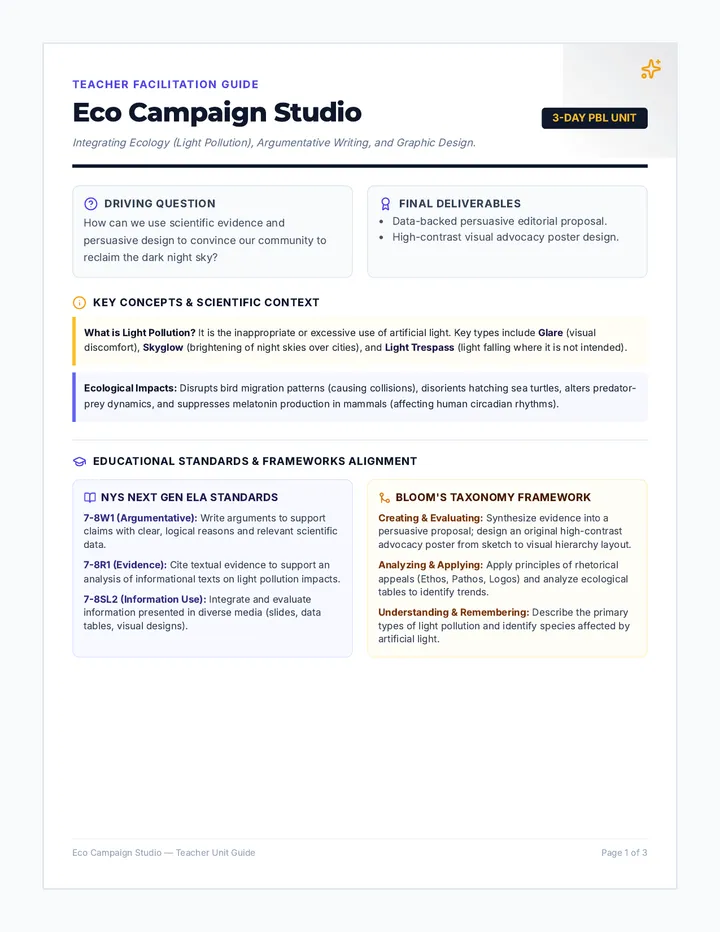
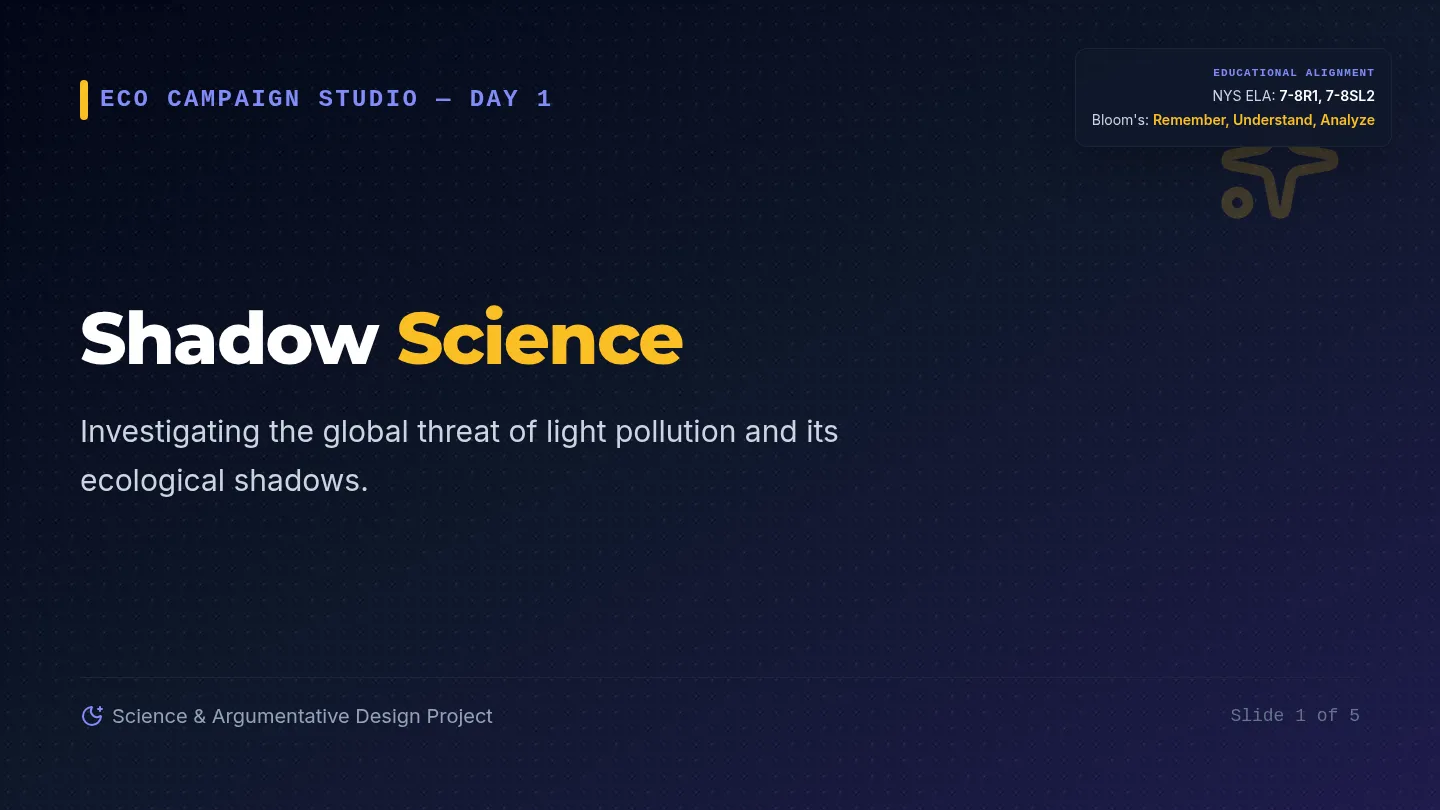
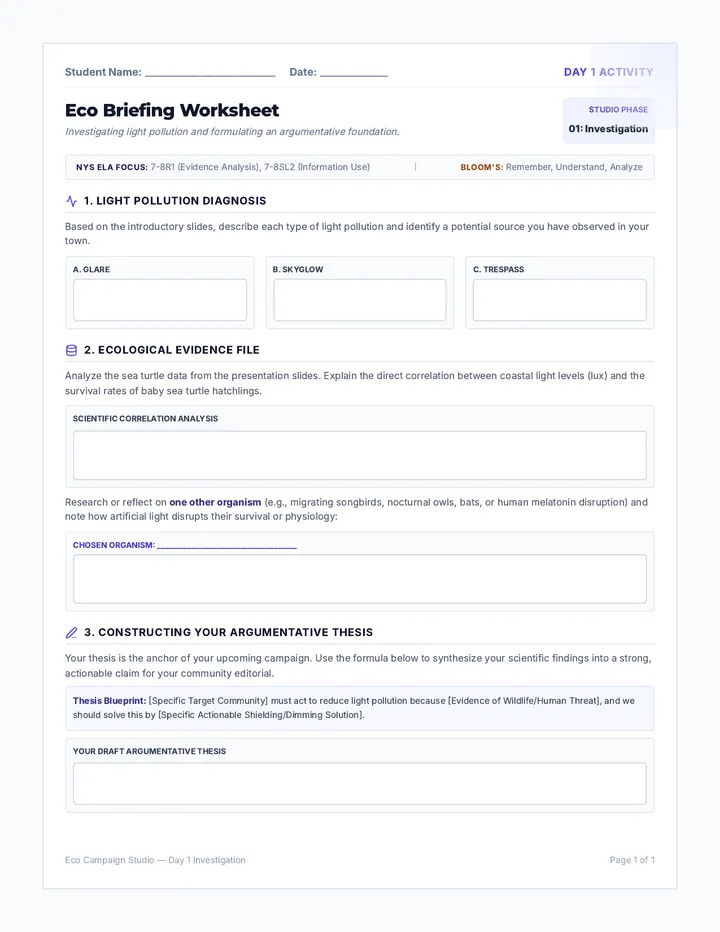
A cross-curricular, 3-day project-based unit combining science, argumentative writing, and graphic design. Students investigate the ecological impacts of light pollution, write a data-driven persuasive proposal, and design a community awareness campaign poster.
This lesson covers weather prediction techniques, atmospheric pressure systems, warm and cold fronts, and how meteorologists analyze satellite and radar data to forecast storms.
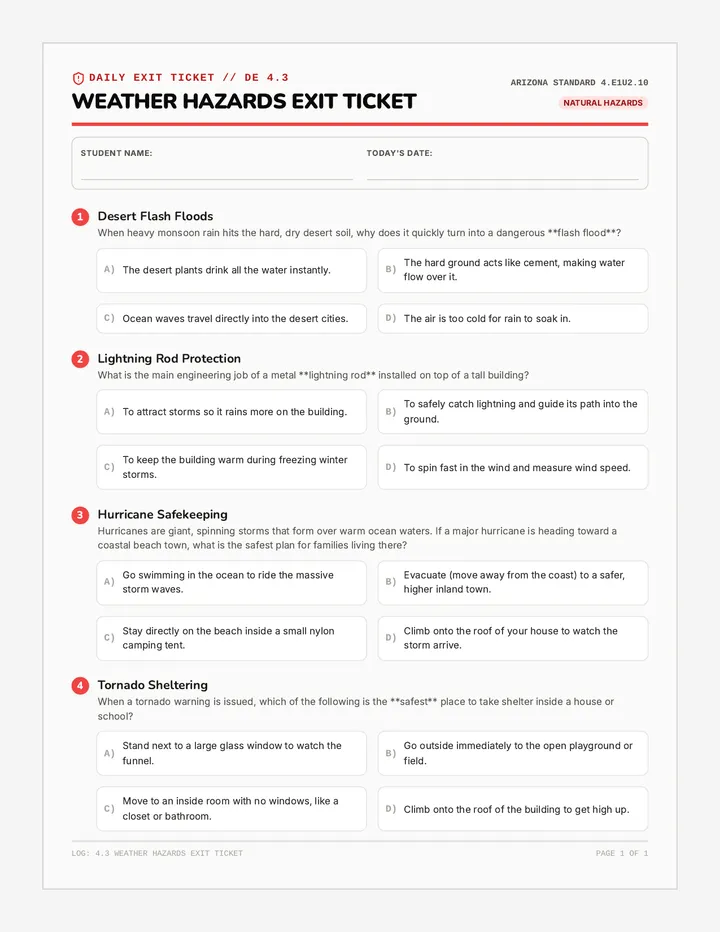
A single-page 4th-grade student multiple choice worksheet featuring 4 conceptual questions on severe storm hazards, flash floods, hurricanes, and engineering protection, styled with identical options.