A conceptual physics assessment focusing on the density of matter through water displacement and the analysis of real-world traffic data to identify scientific patterns and anomalies.
A comprehensive high school biology unit investigating the structure, function, and hierarchical organization of living systems, aligned to NGSS standards.
An inquiry-based biology lesson investigating the structural hierarchy and interactions of multicellular organ systems during physiological demands (NGSS HS-LS1-2).
A highly engaging slide deck for HS-LS1-2 introducing the hierarchical organization of multicellular systems. Includes an interactive nested block diagram of levels of organization, a detailed analysis of cardio-pulmonary system interactions, and a beautiful custom-rendered CSS graph comparing heart rate and respiratory demand.
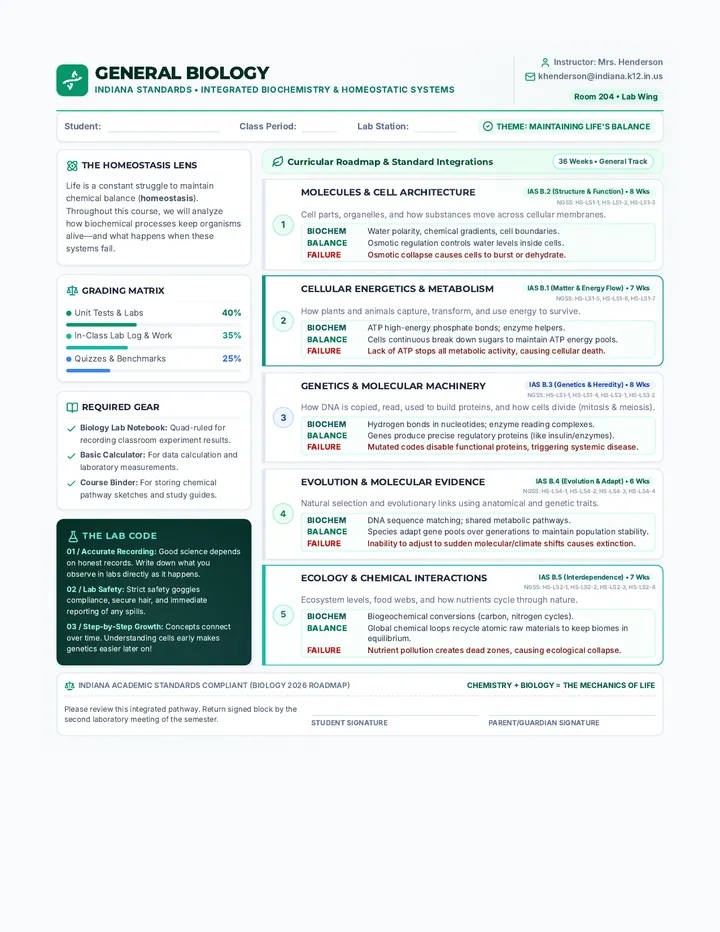
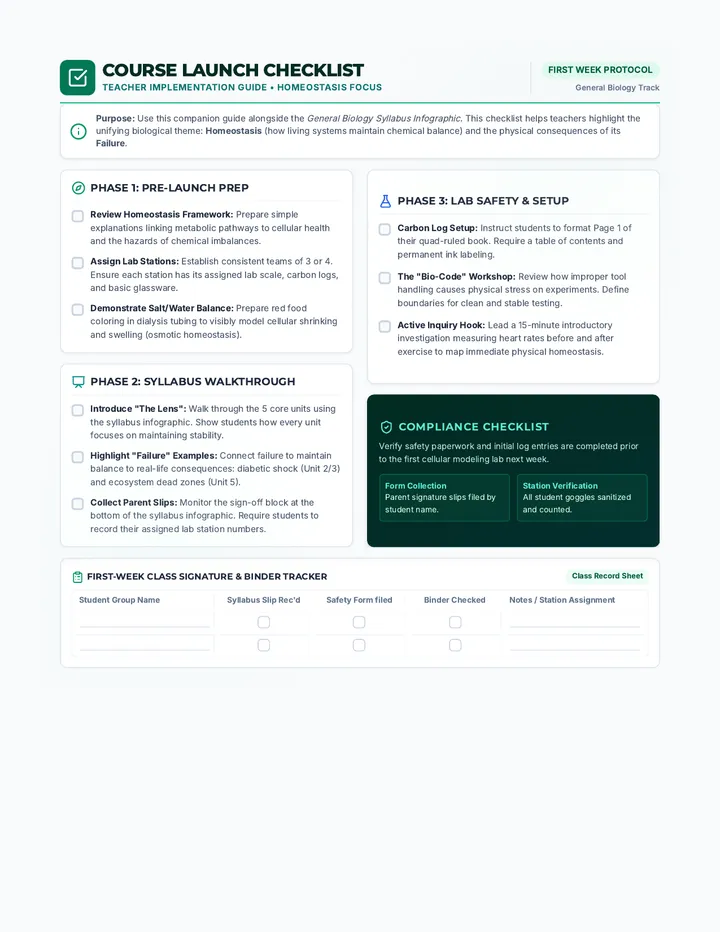
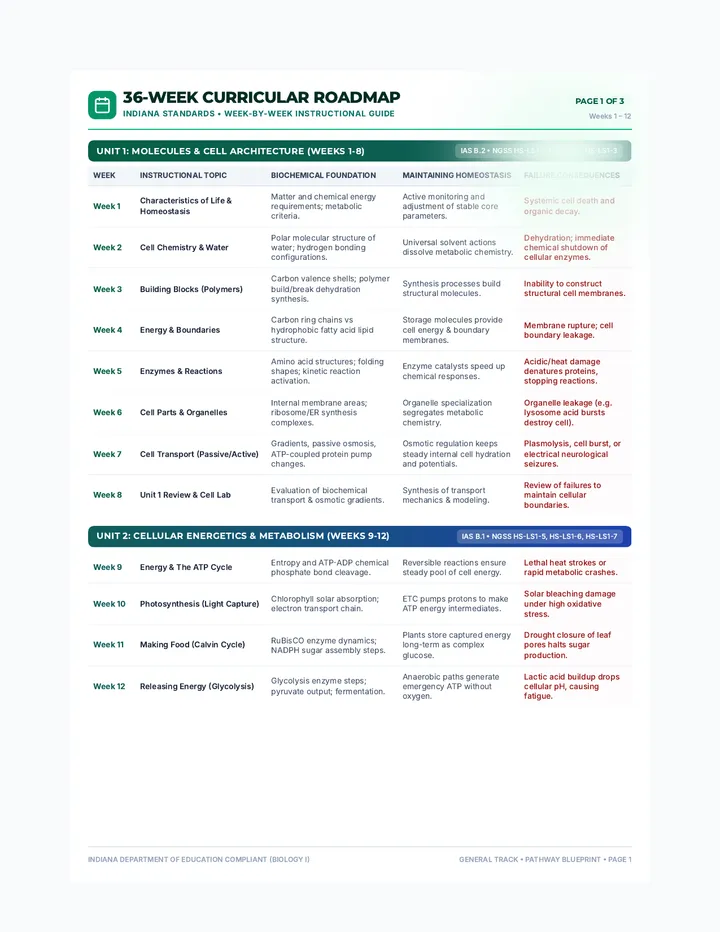
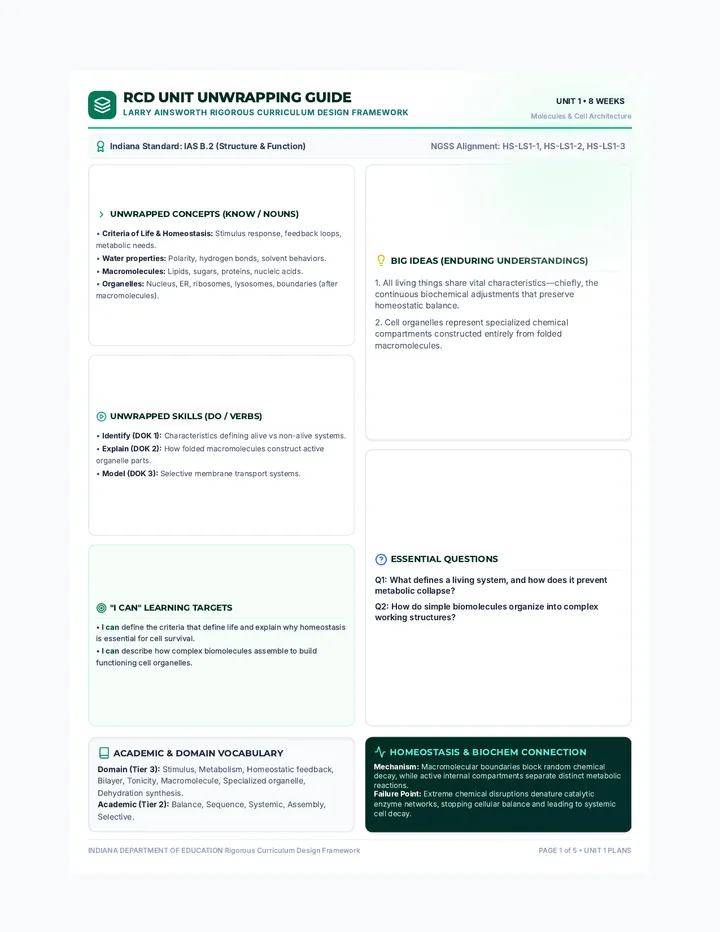
A comprehensive, 36-week General Biology curriculum aligned with Indiana Academic Standards, emphasizing the integration of biochemical foundations and metabolic homeostasis across all units.
A standard-aligned biology lesson focused on how DNA structure determines protein shape, function, and cell specialization (NGSS HS-LS1-1).
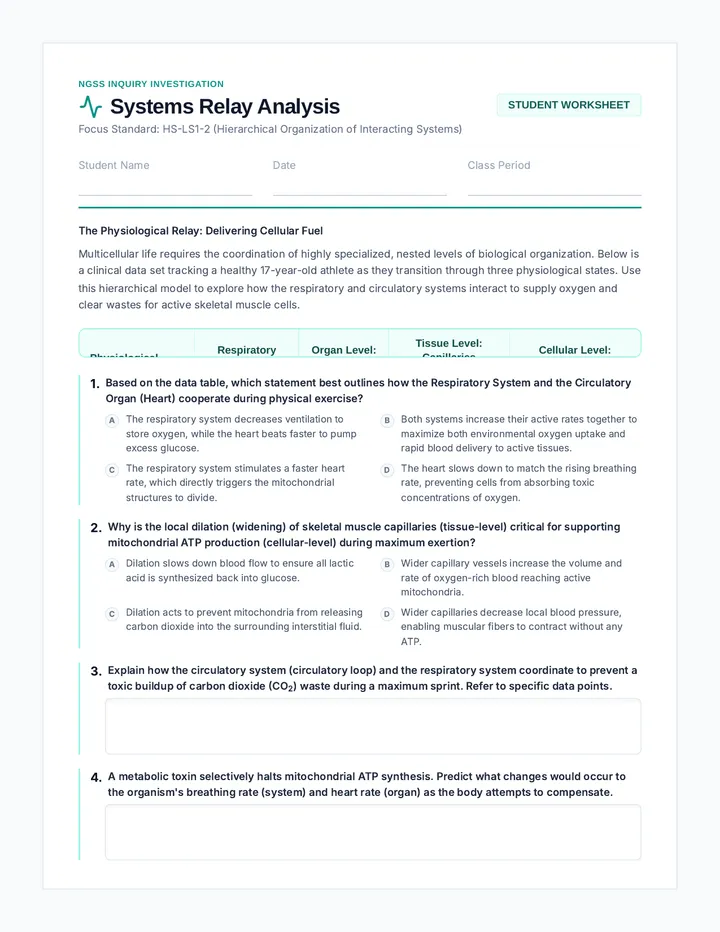
An inquiry-based analysis worksheet focusing on NGSS HS-LS1-2, containing a detailed physiological data table tracking body systems from cells to organs to systems during exercise. Includes 8 rigorous analysis questions and a teacher answer key.
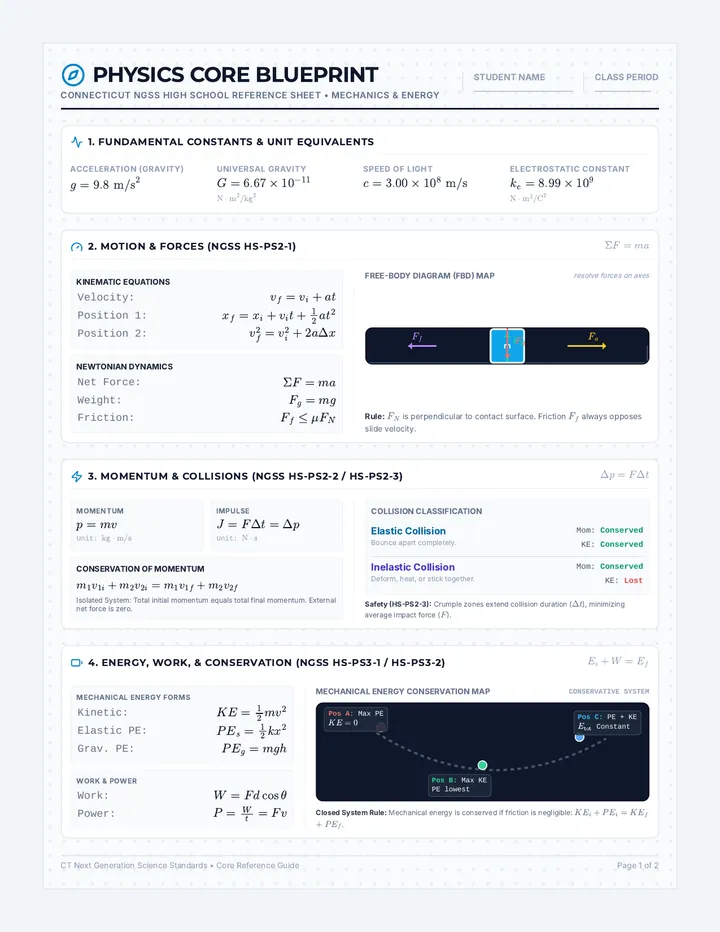
A comprehensive high school physics curriculum sequence aligned with the Connecticut Next Generation Science Standards (CT-NGSS), focusing on core concepts, quantitative problem-solving, and visual models.
This lesson explores the hierarchical organization of living organisms from cells to tissues, organs, organ systems, and whole organisms, aligned with NGSS MS/HS-LS1-2 standards.
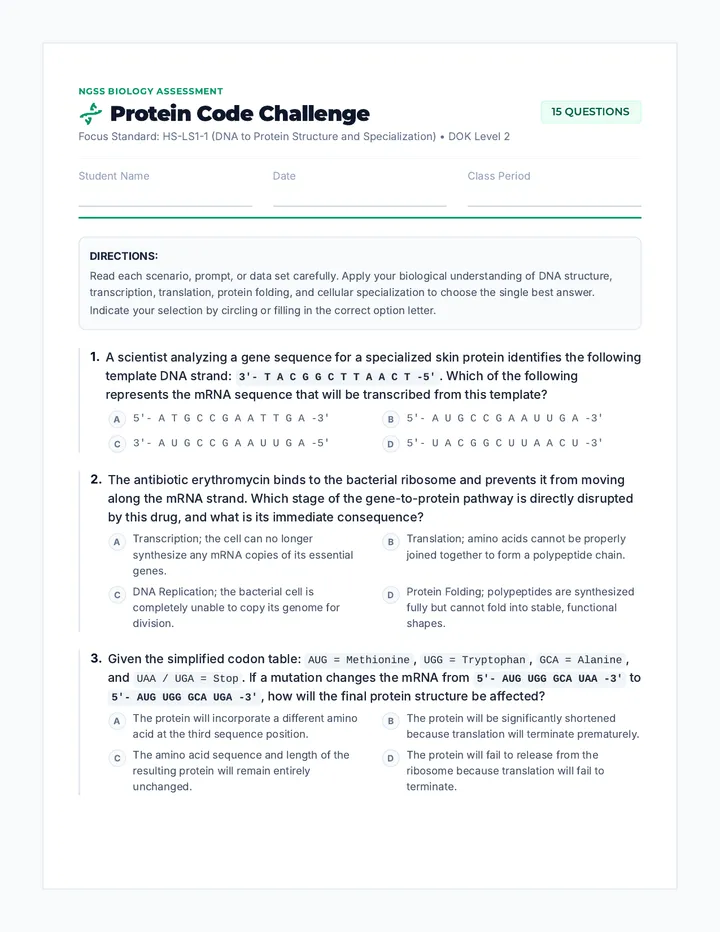
A rigorous, standards-aligned assessment consisting of 15 DOK-2 multiple-choice questions for HS-LS1-1, complete with a beautifully formatted teacher answer key. Covers transcription, translation, protein folding, specialized cellular systems, and gene expression.
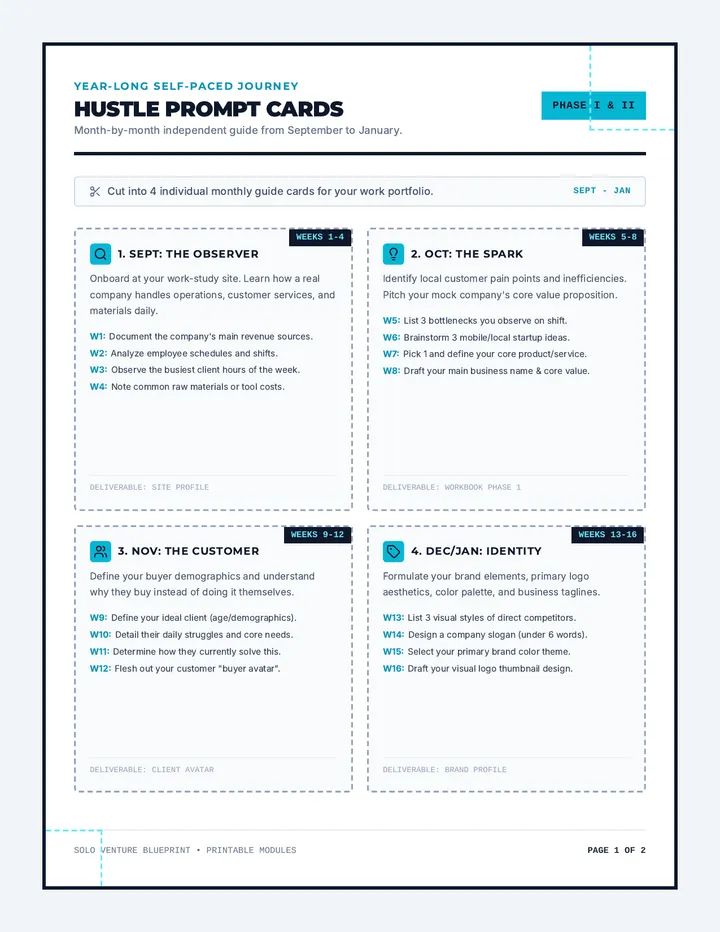
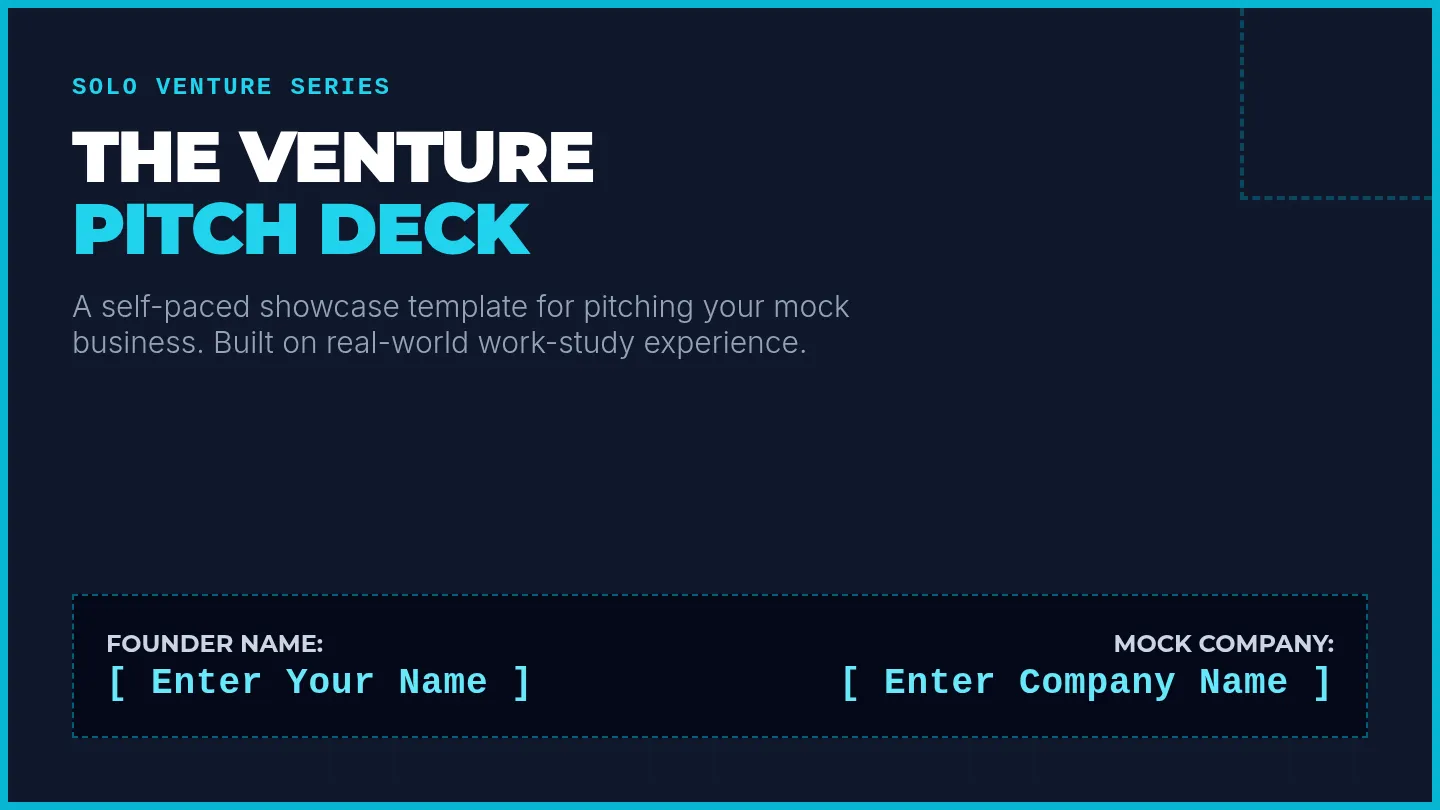
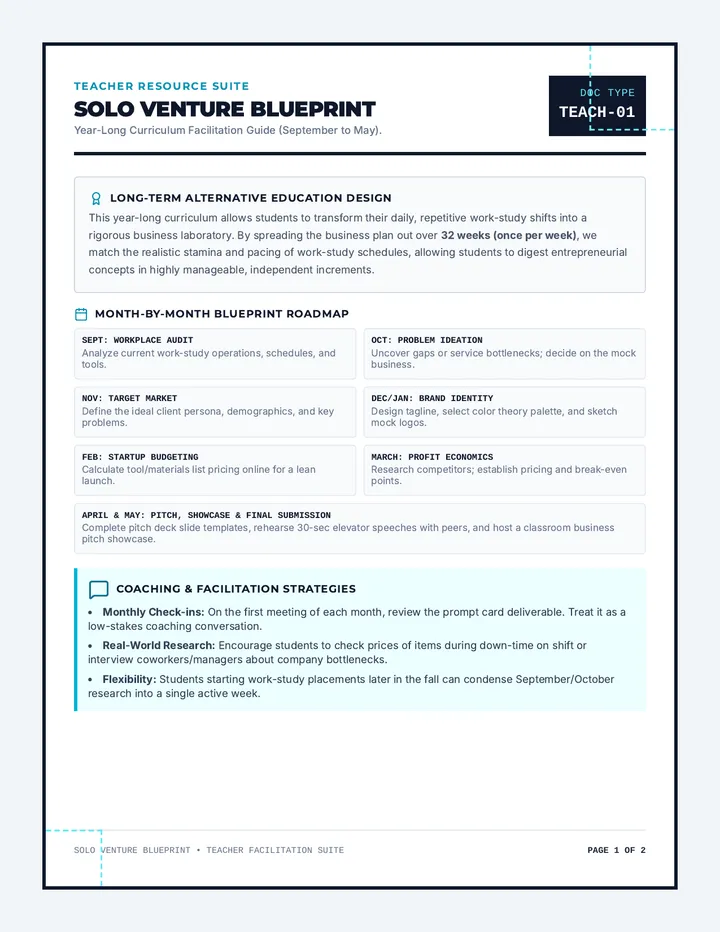
A year-long, self-paced entrepreneurship curriculum spanning September to May for alternative education students in work-study placements. Students transform real-world work experience into a modular business plan and slide presentation.
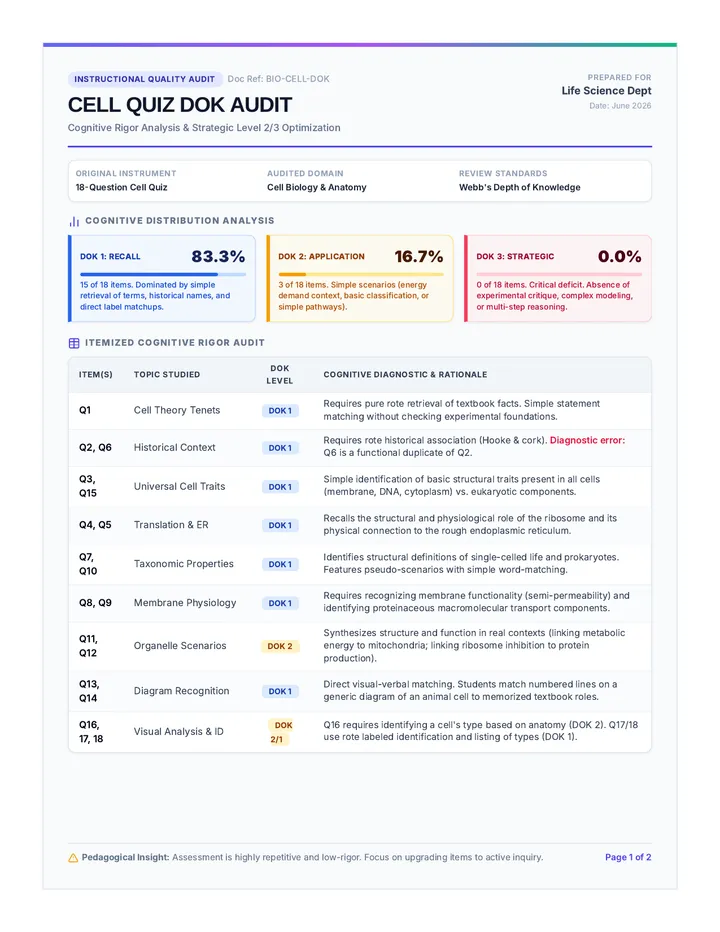
A thorough analysis of a 18-question cell biology quiz, mapping items to Depth of Knowledge (DOK) levels and presenting high-rigor upgrades.
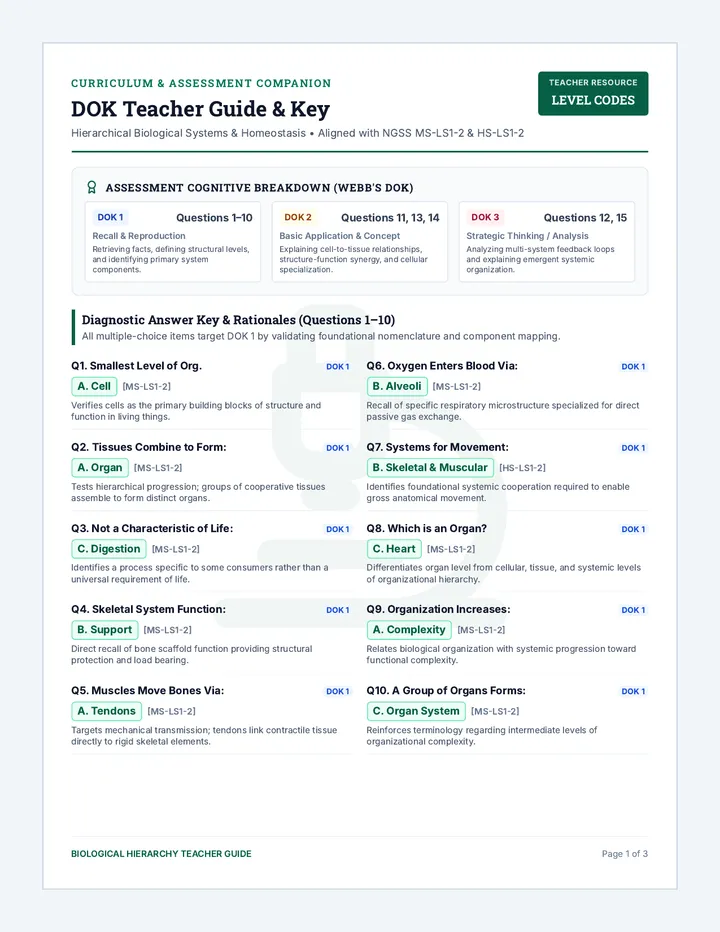
A premium 3-page teacher guide and coded answer key mapping biological hierarchy questions (MS/HS-LS1-2) to Webb's Depth of Knowledge (DOK) levels. Includes detailed rationales, multi-sentence college-bound exemplar responses, granular analytical rubrics, and pedagogical strategies for scaffolding and extension.