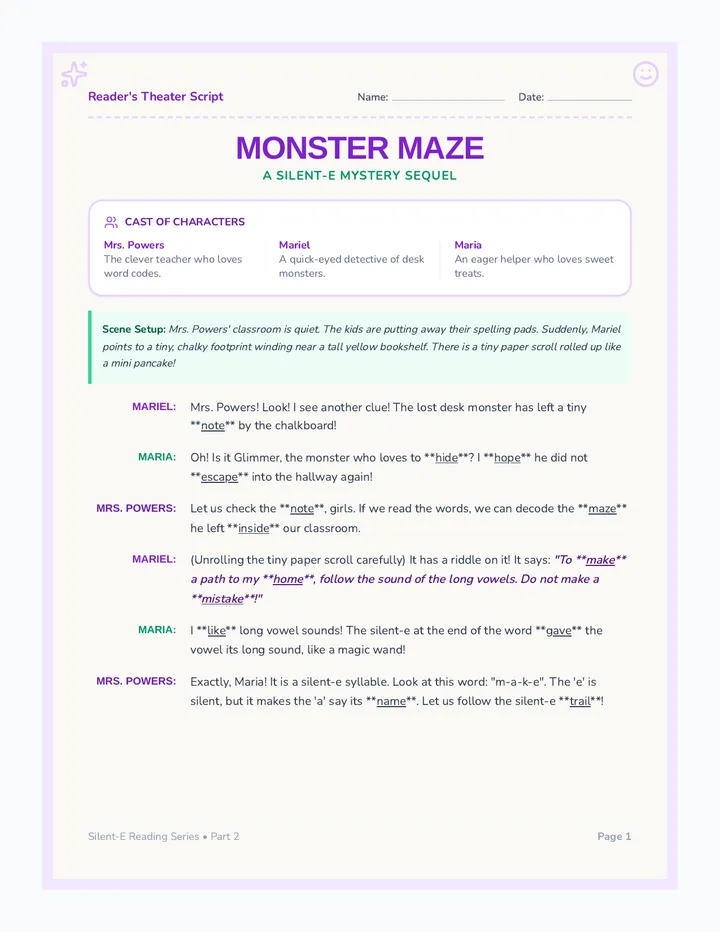
Data Detective Slides
A comprehensive instructional slide deck introducing students to reading and interpreting maps, bar charts, and diagrams. It features North Carolina-specific examples and clear visual cues for teaching graphic source analysis.
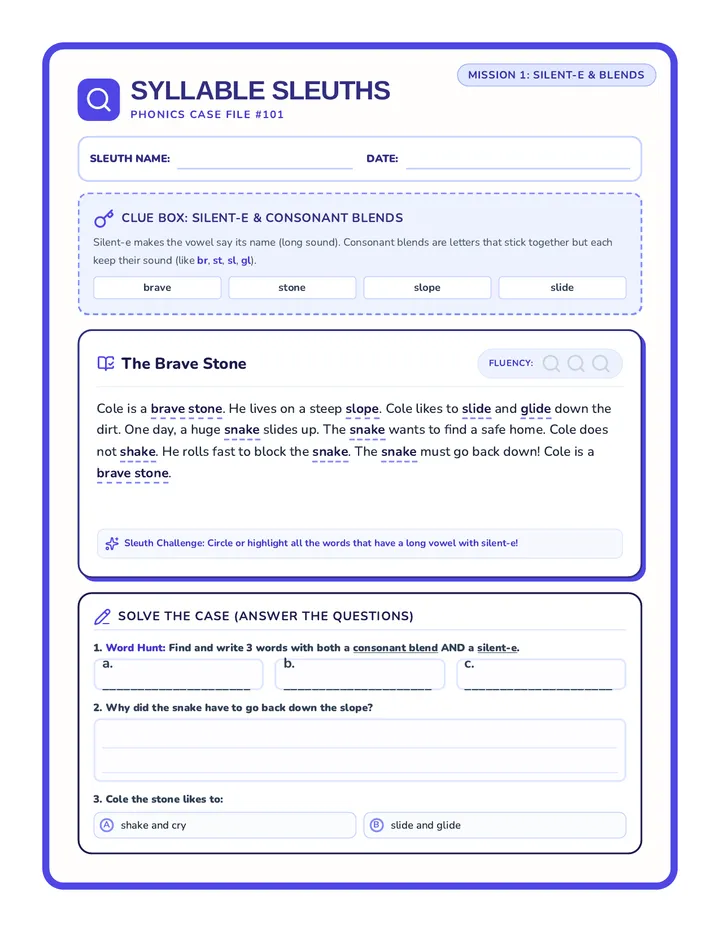
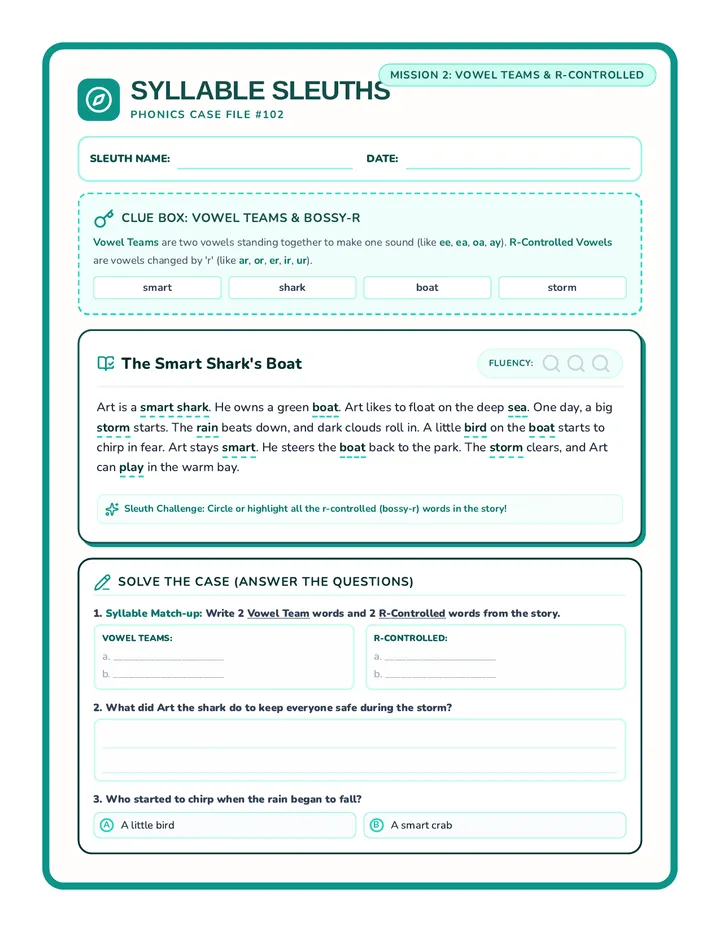
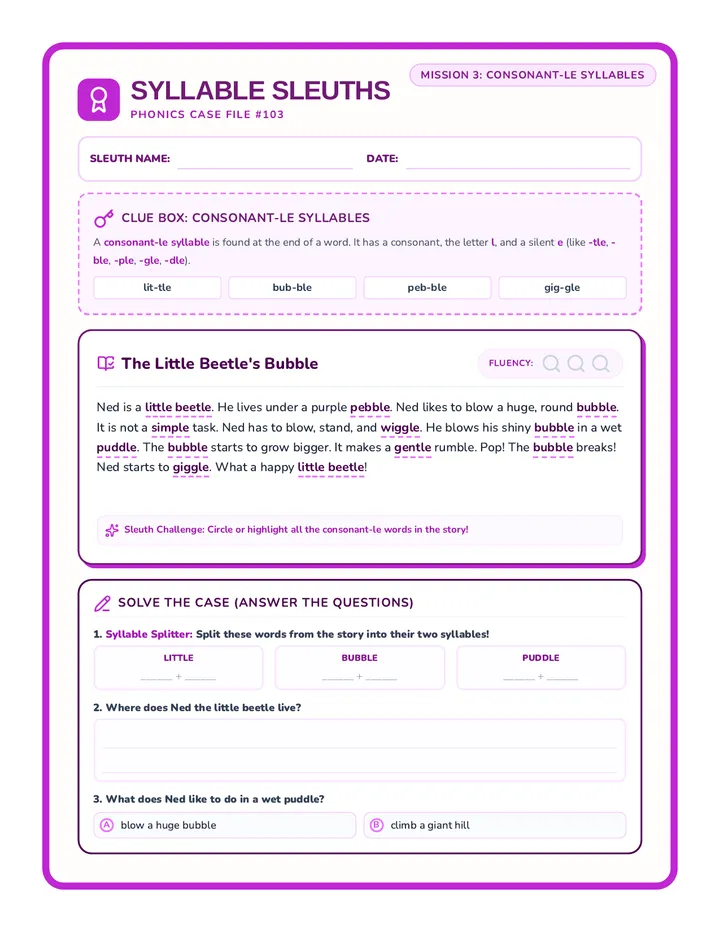
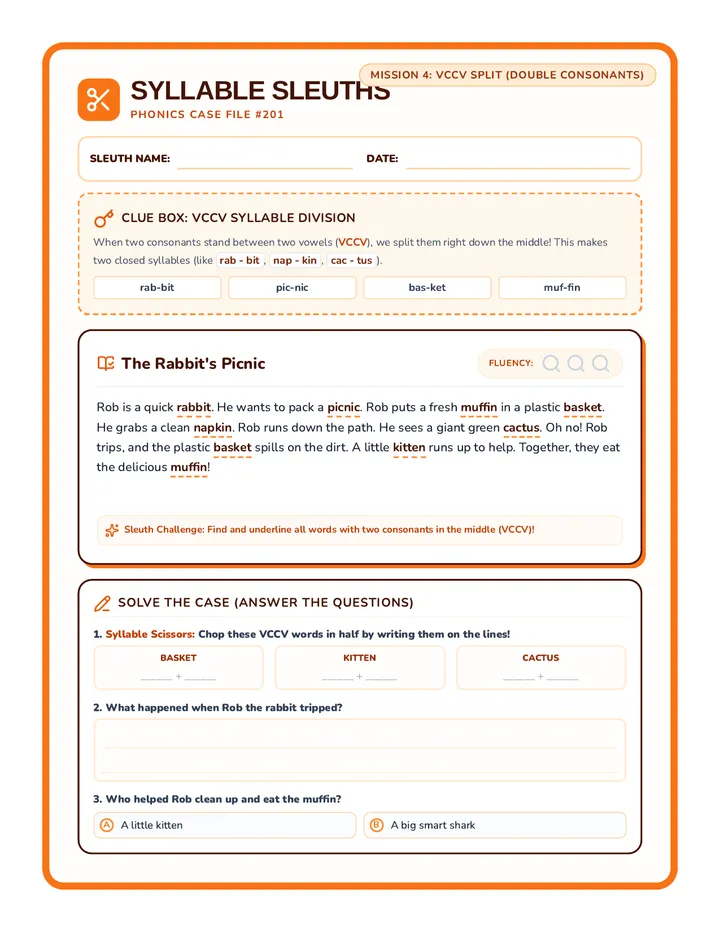
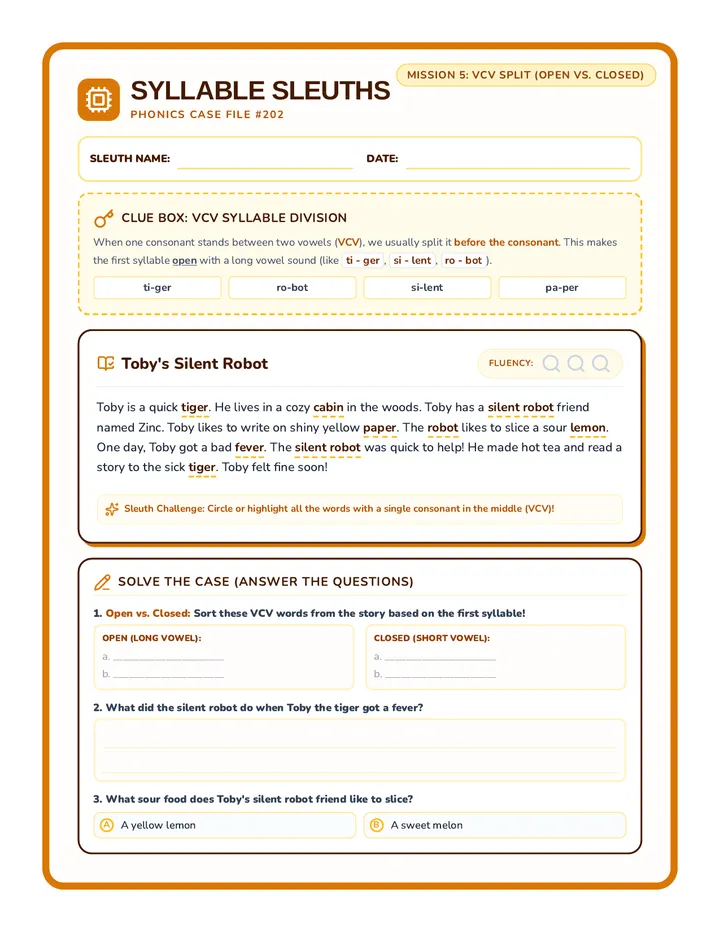
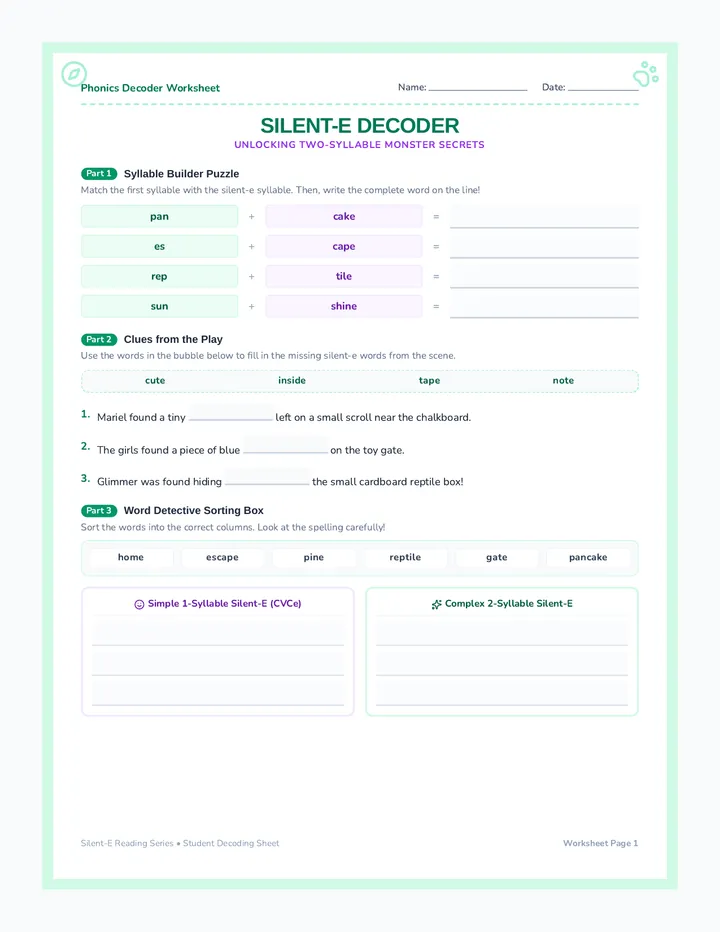
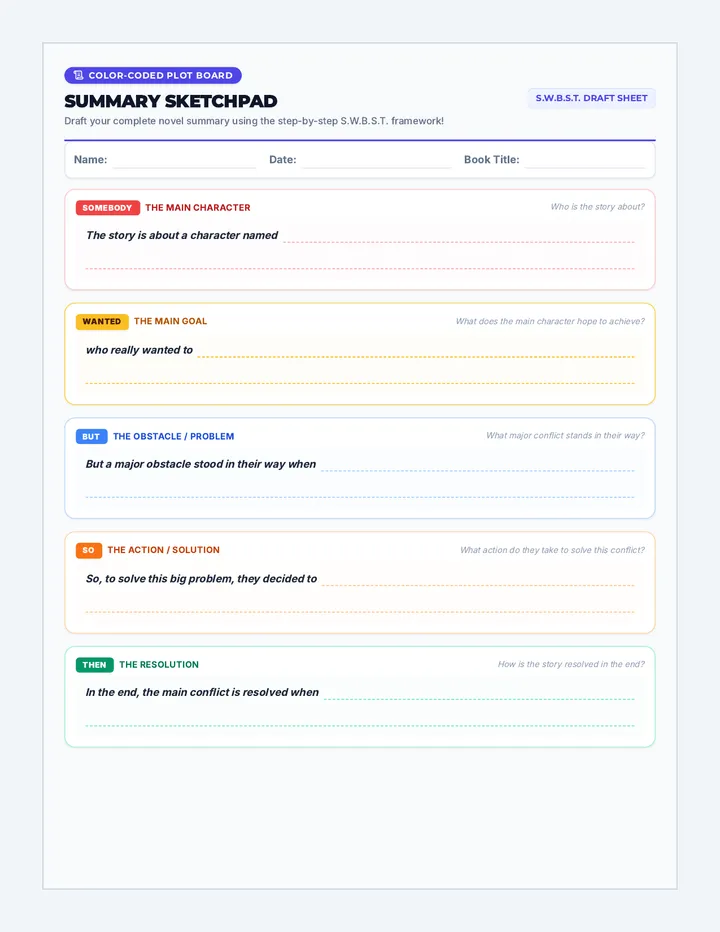
Source Analysis Worksheets
A three-page guided analysis packet for Grade 3 students. It includes a North Carolina regions map, an agricultural bar chart, and a water cycle diagram, each with specific detective-themed observation and analysis questions. Space is provided for student handwriting.
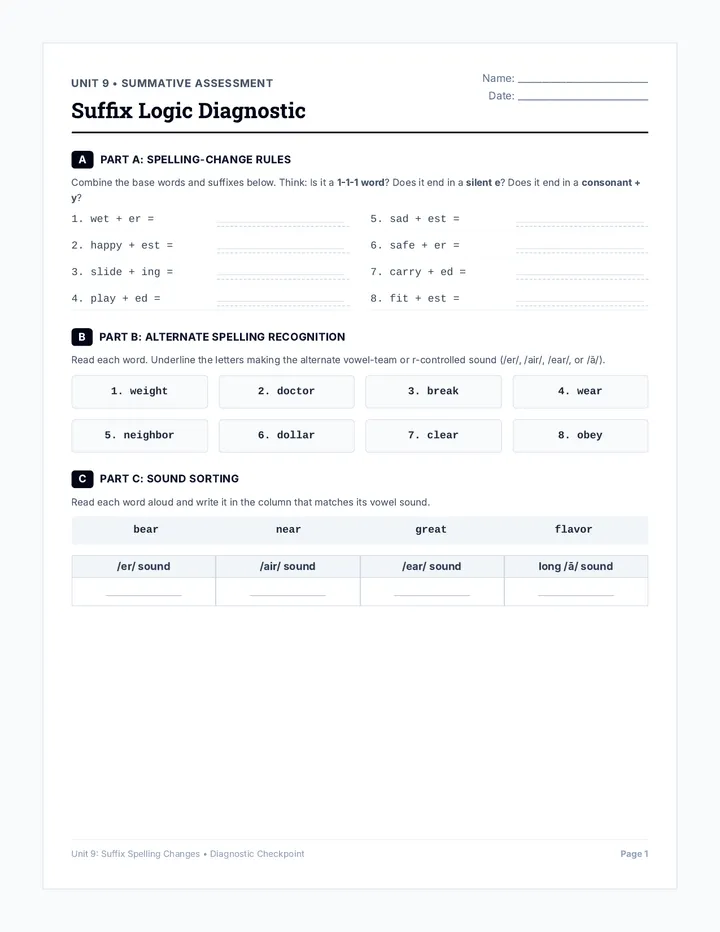
Visual Evidence Exam
A 6-question EOG-style assessment requiring students to interpret and extract information from maps, charts, and diagrams. Includes multiple-choice questions focused on North Carolina geography, agriculture, and the water cycle.
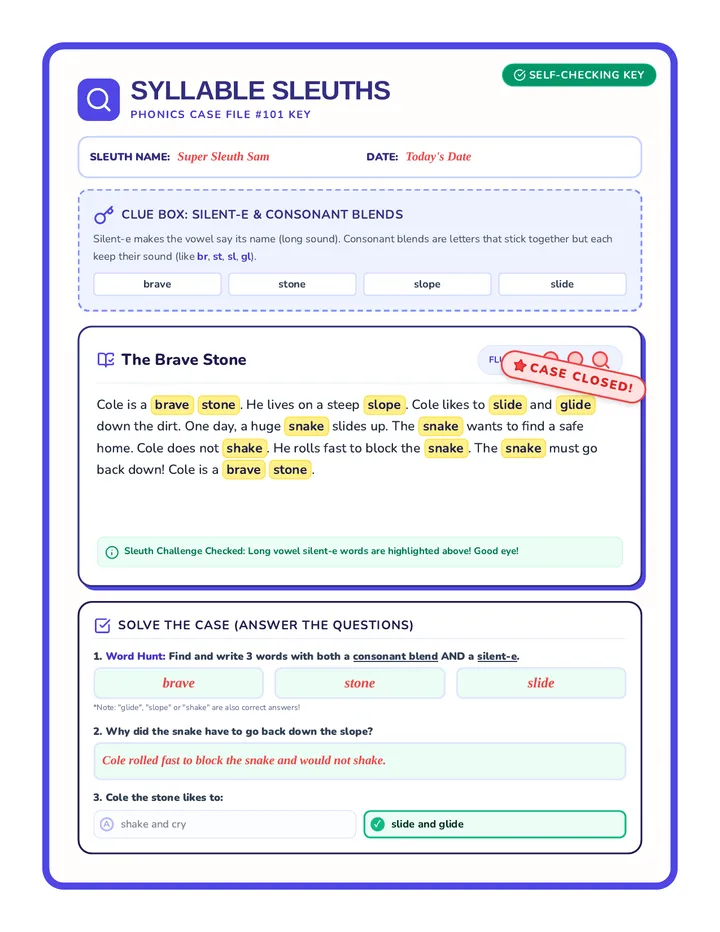
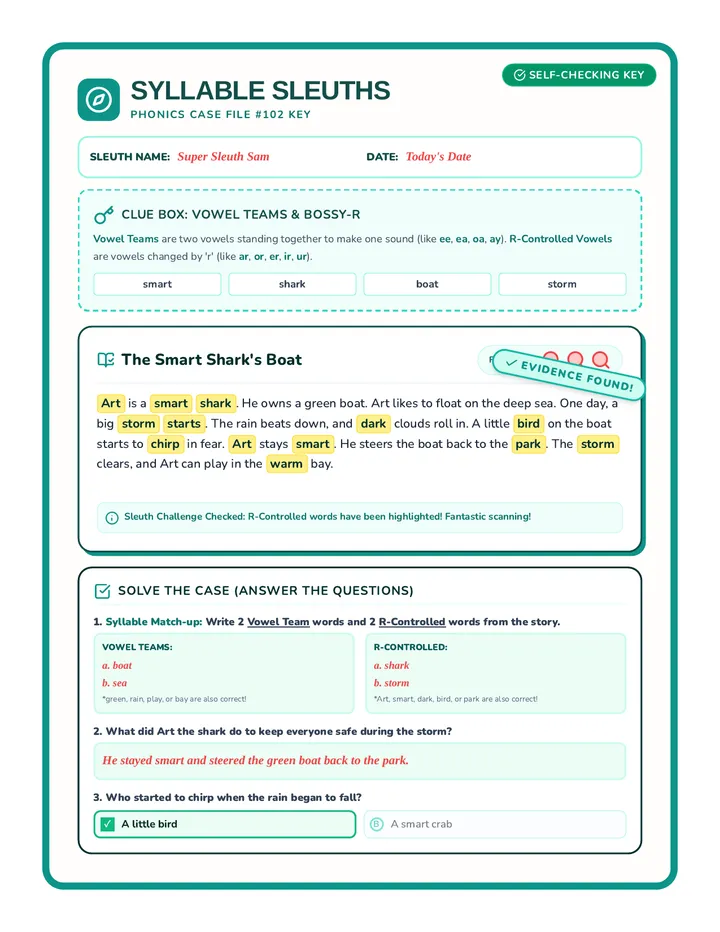
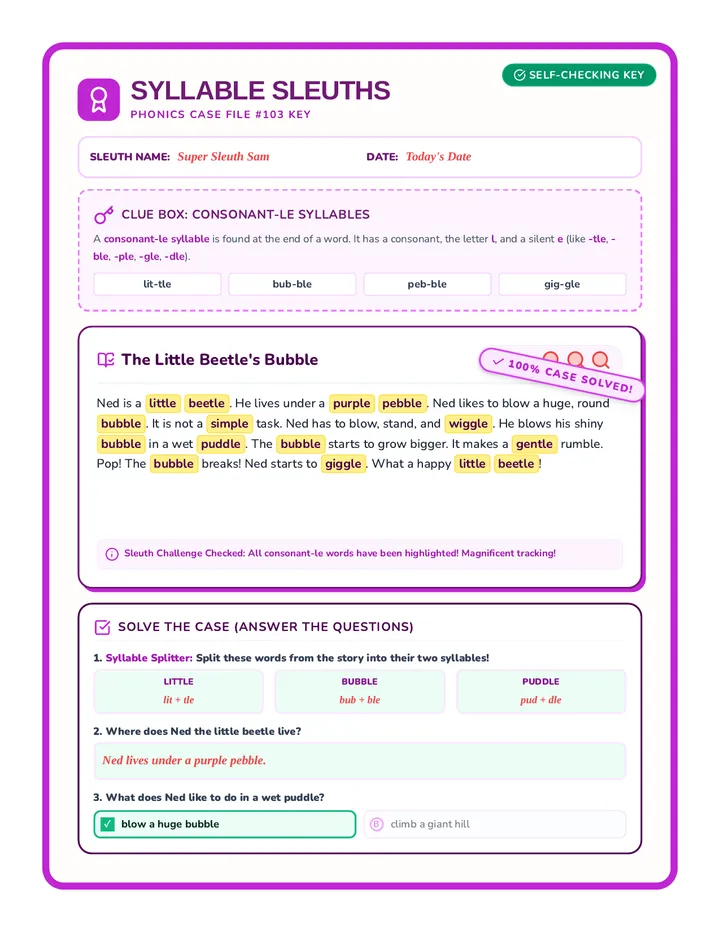
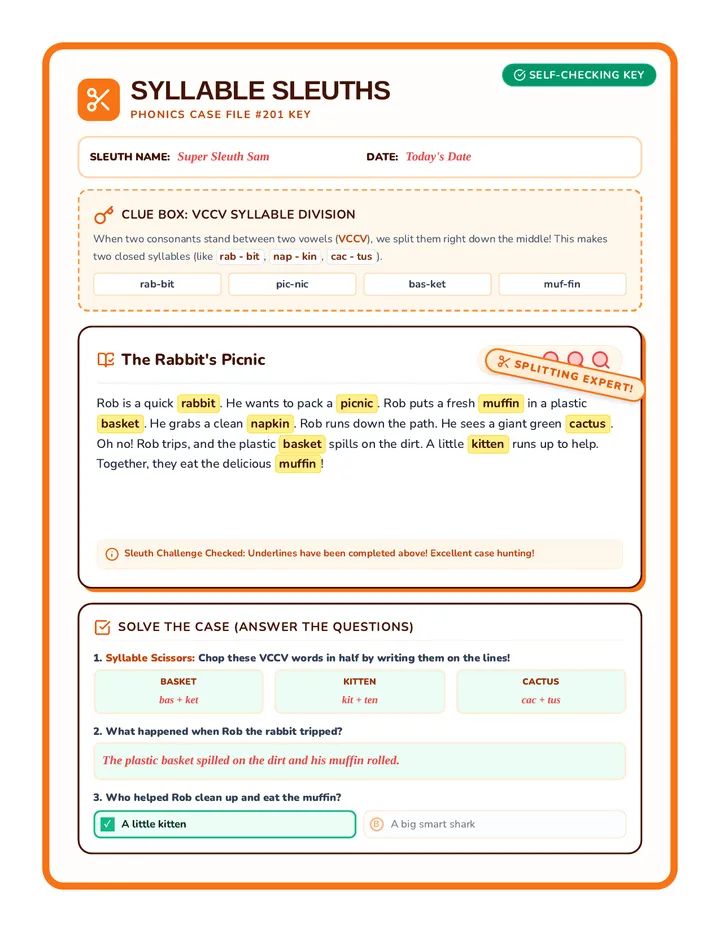
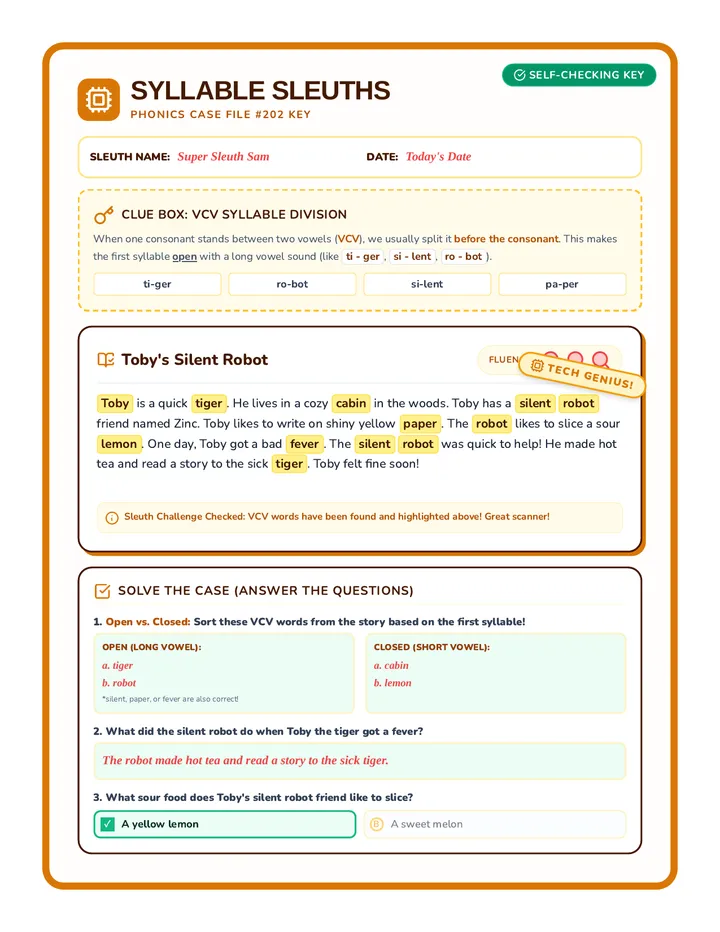
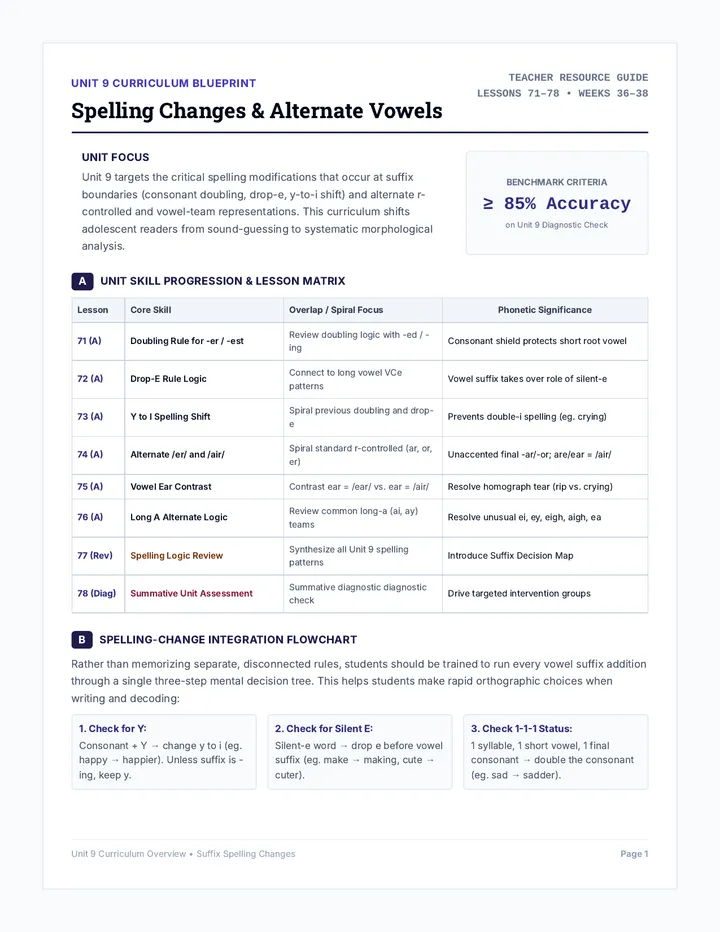
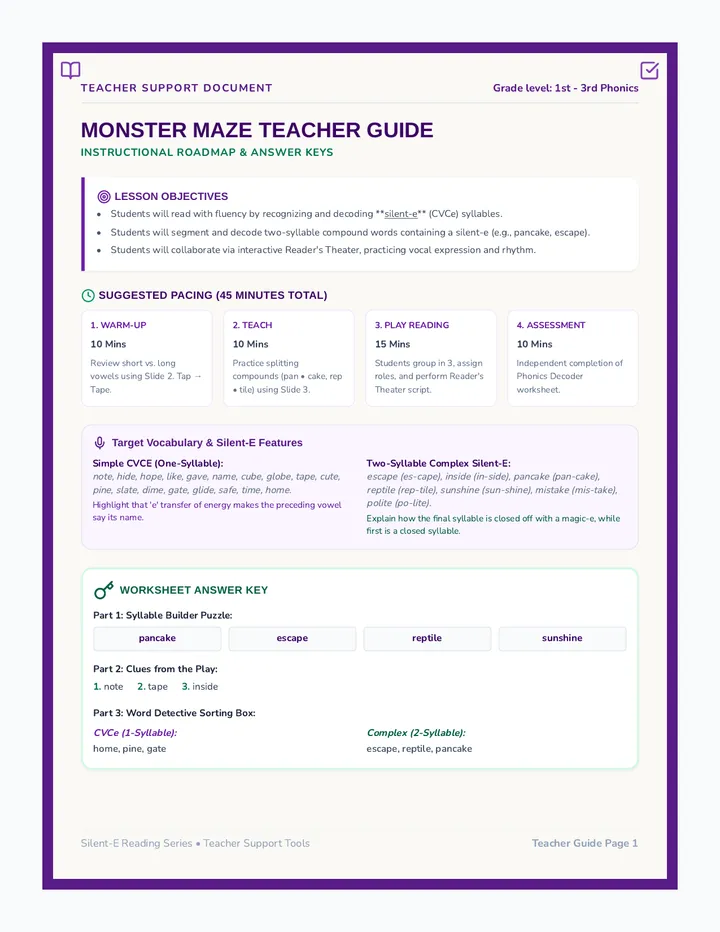
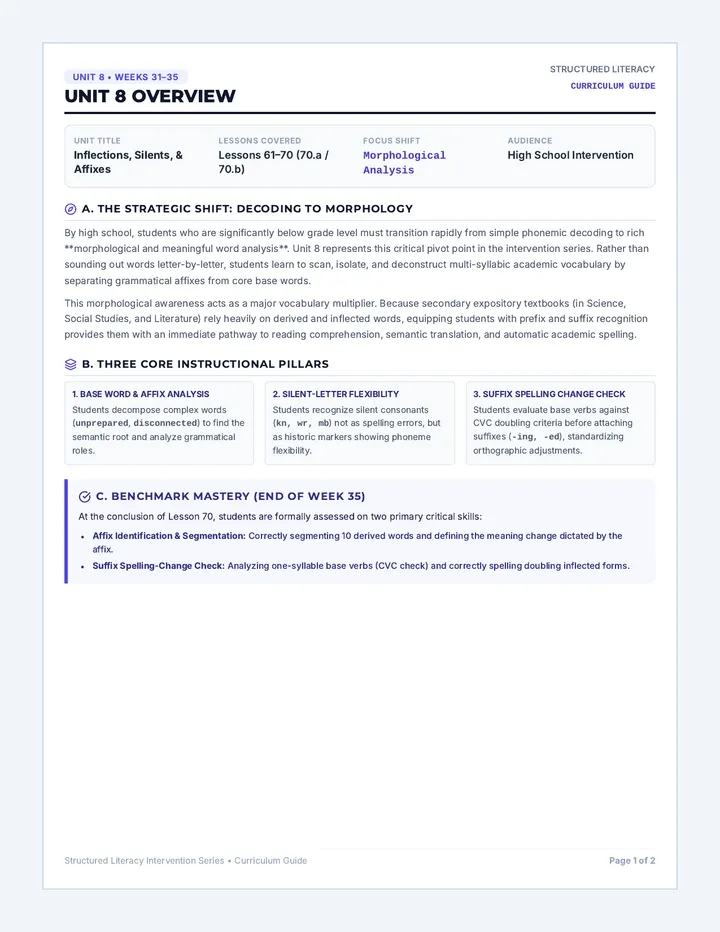
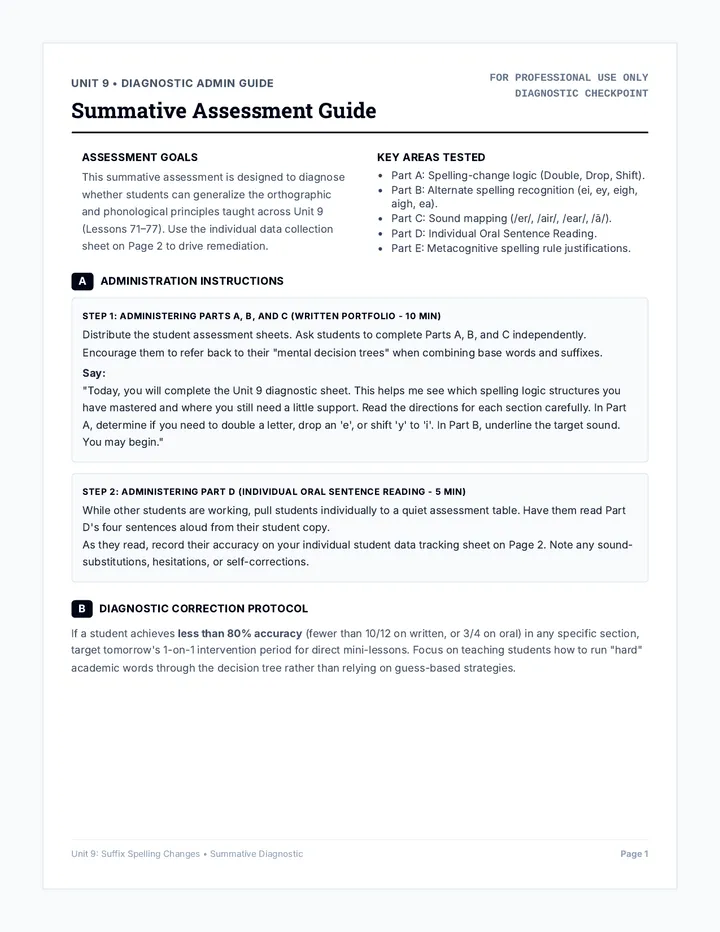
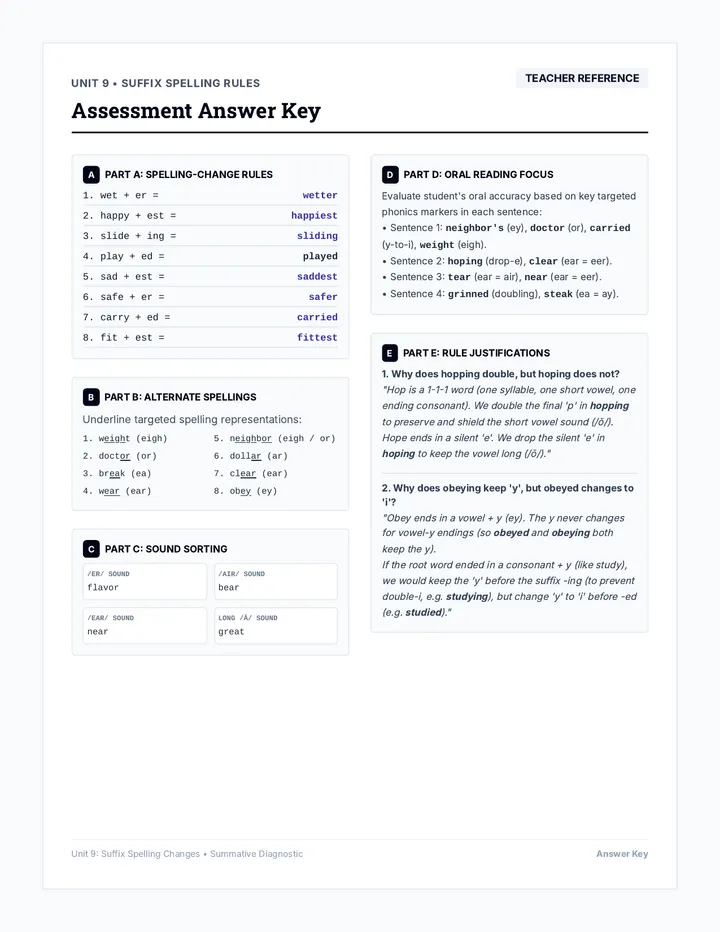
Data Detective Teacher Guide
A comprehensive teacher resource containing lesson objectives, vocabulary definitions, instructional strategies for teaching graphic sources, and complete answer keys for both the guided analysis worksheets and the final exam.