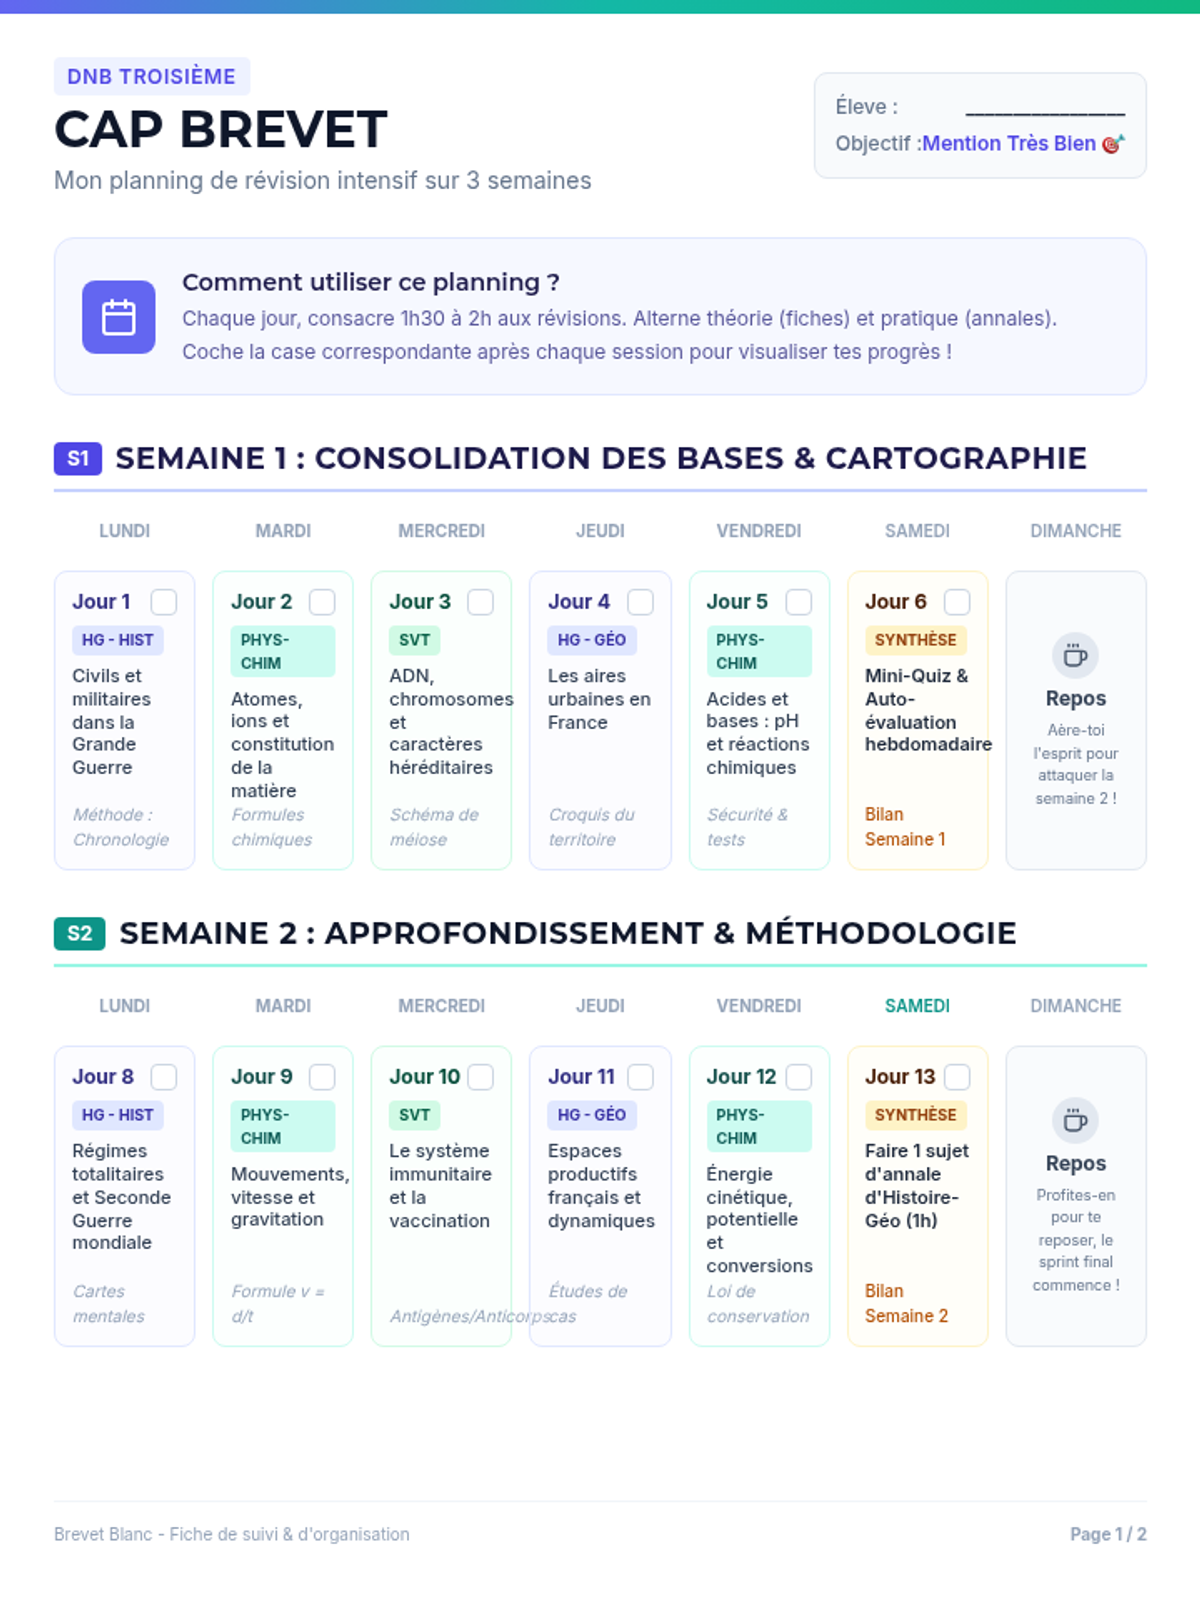
Students create a simplified Gantt chart to visualize overlapping commitments and project phases. They color-code concurrent tasks to identify potential bottlenecks.
Students create a simplified Gantt chart to visualize overlapping commitments and project phases. They color-code concurrent tasks to identify potential bottlenecks.