ACT Math Practice Test: Review of Algebra, Geometry, and Trig Concepts
This comprehensive video tutorial serves as an intensive review for the ACT Math section, covering a wide array of topics crucial for high school students preparing for college entrance exams. The content is structured as a series of 31 practice problems that mimic the style and difficulty of actual ACT questions. It progresses through various mathematical domains including pre-algebra, elementary algebra, intermediate algebra, coordinate geometry, plane geometry, and trigonometry. The video adopts a pause-and-practice format, encouraging active participation where viewers attempt each problem before watching the detailed step-by-step solution.
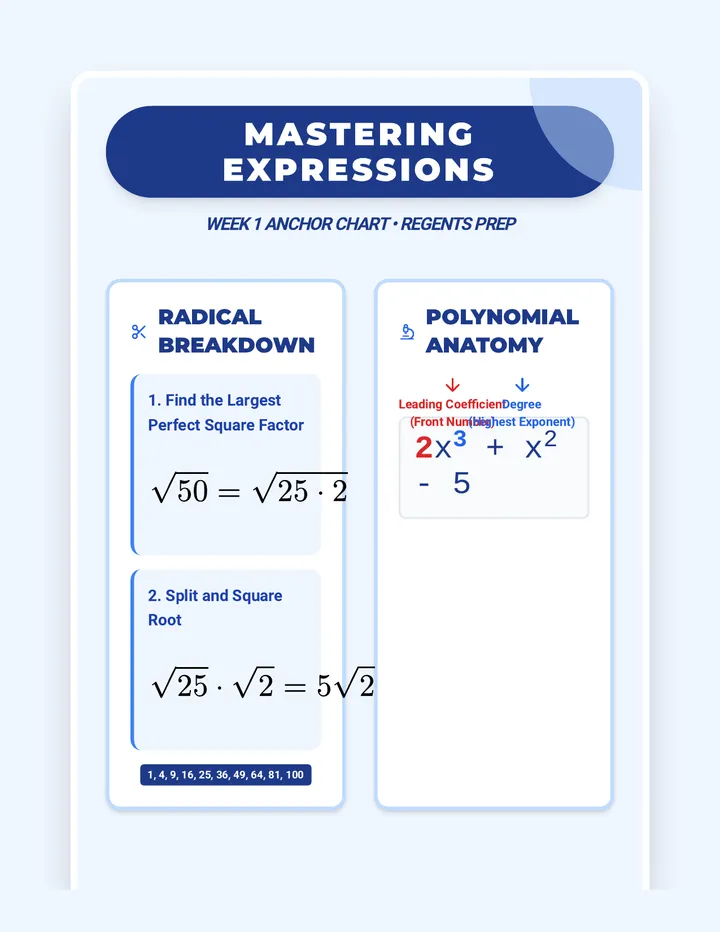
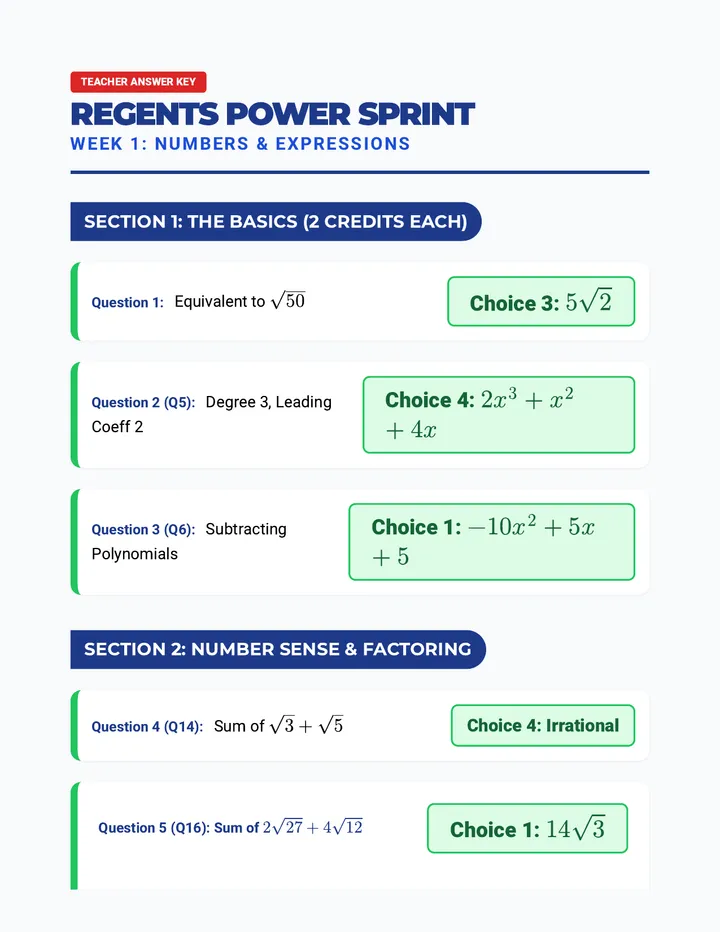
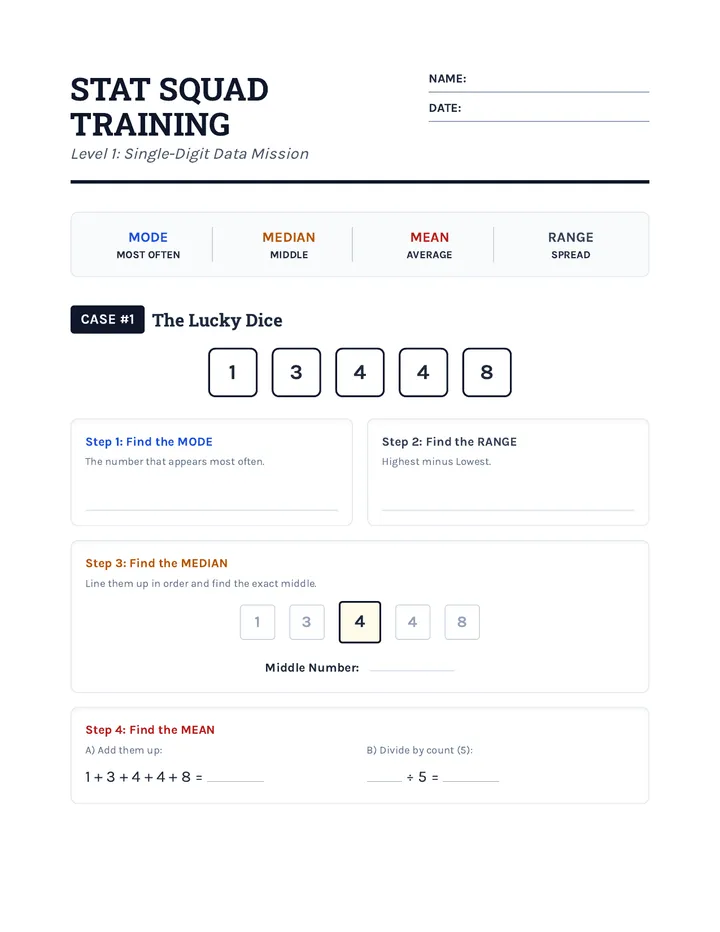
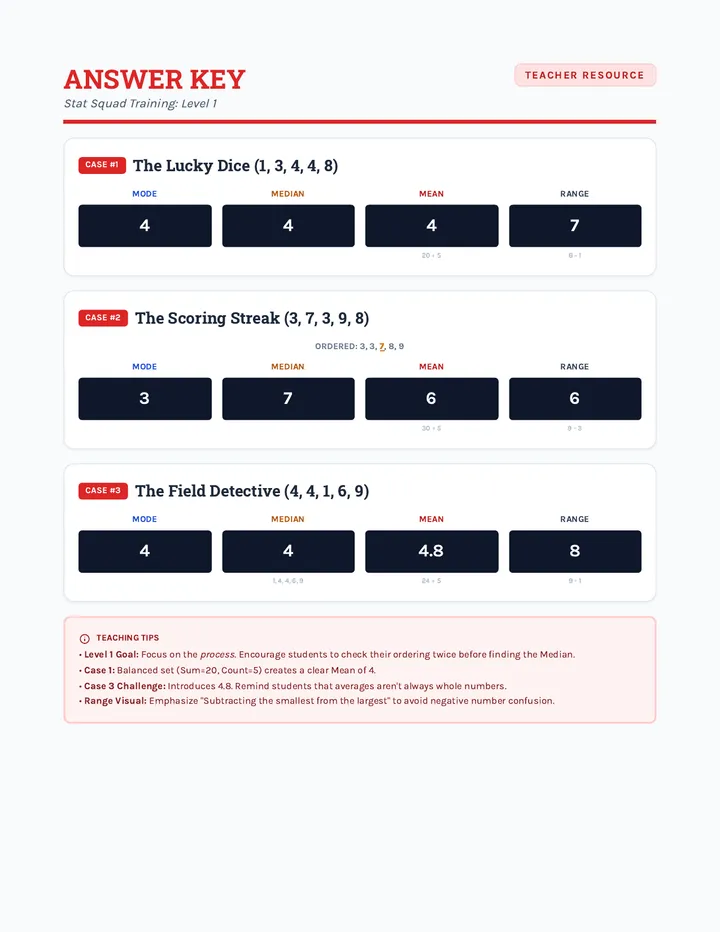
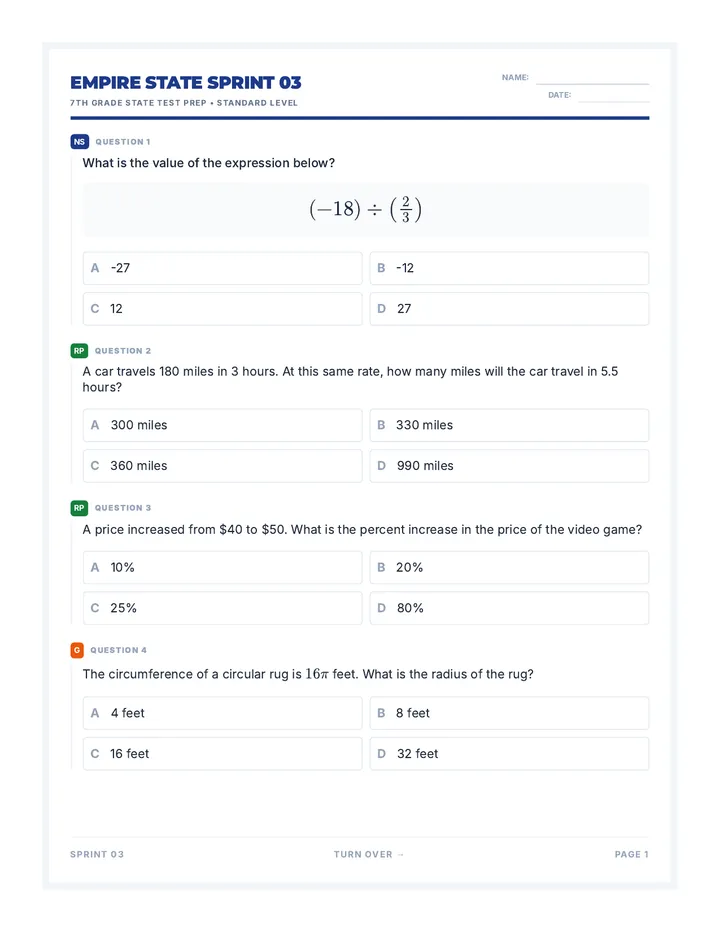
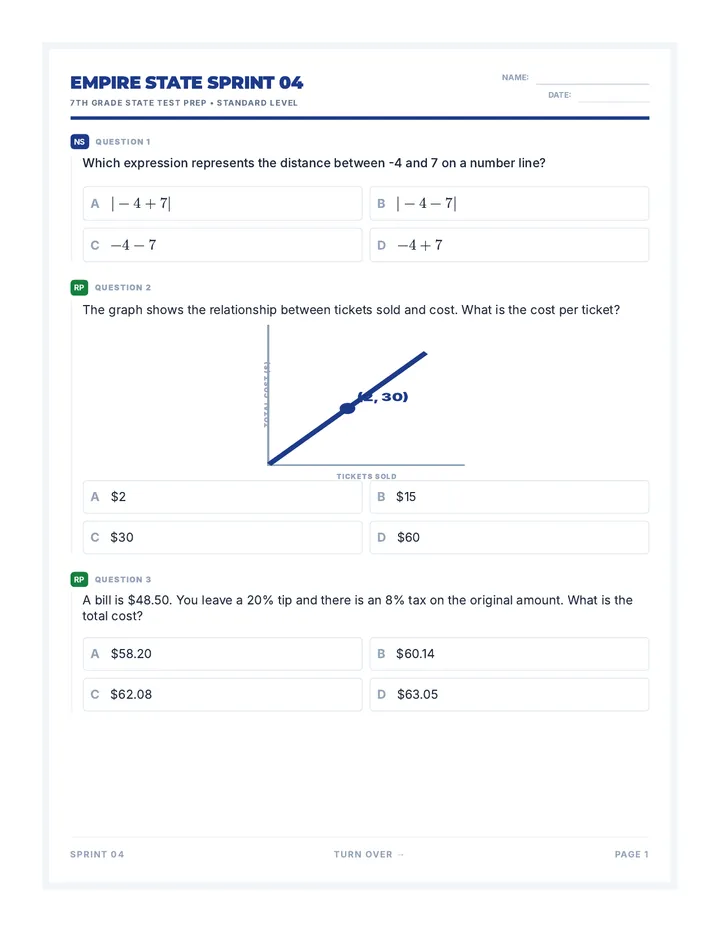
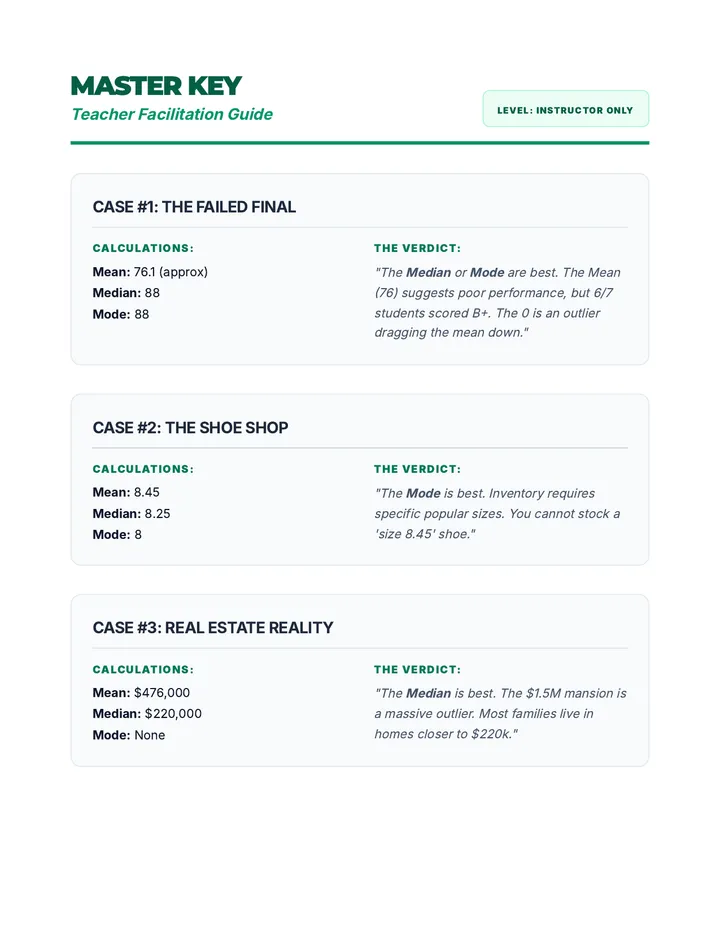
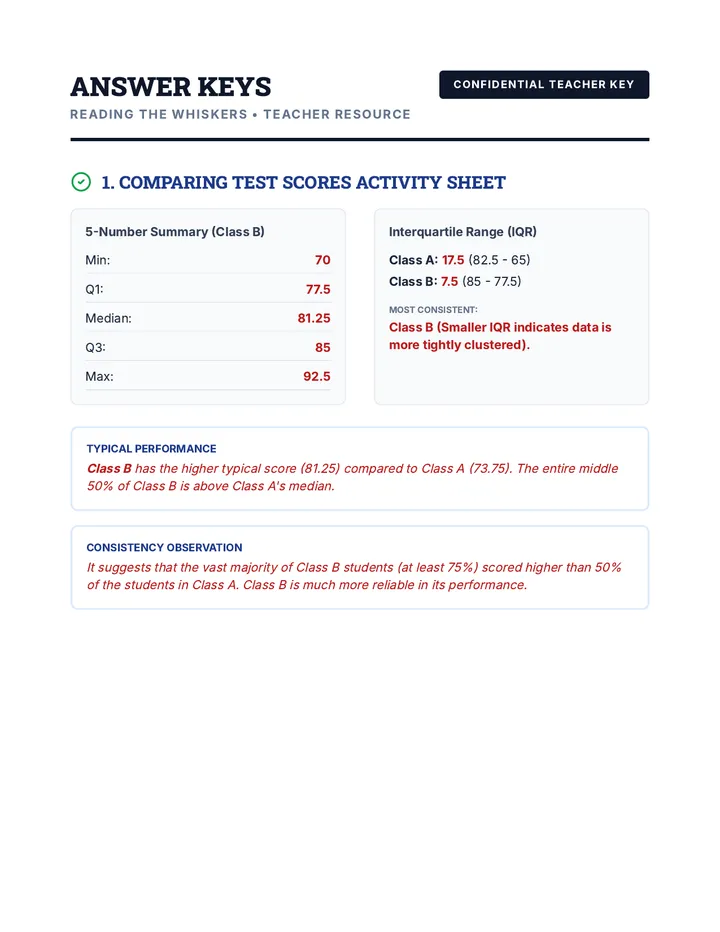
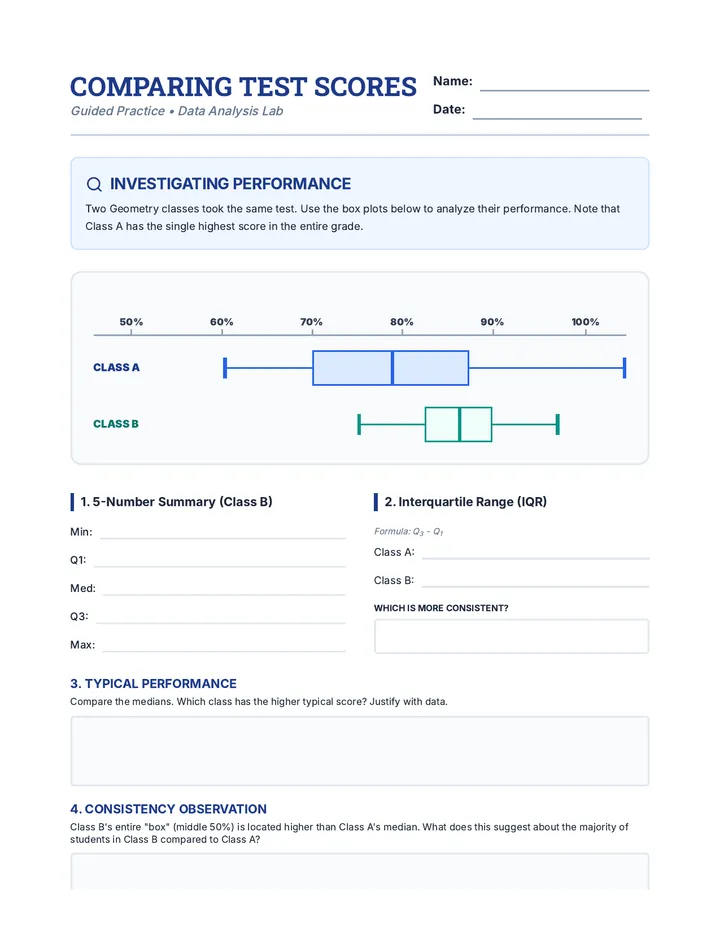
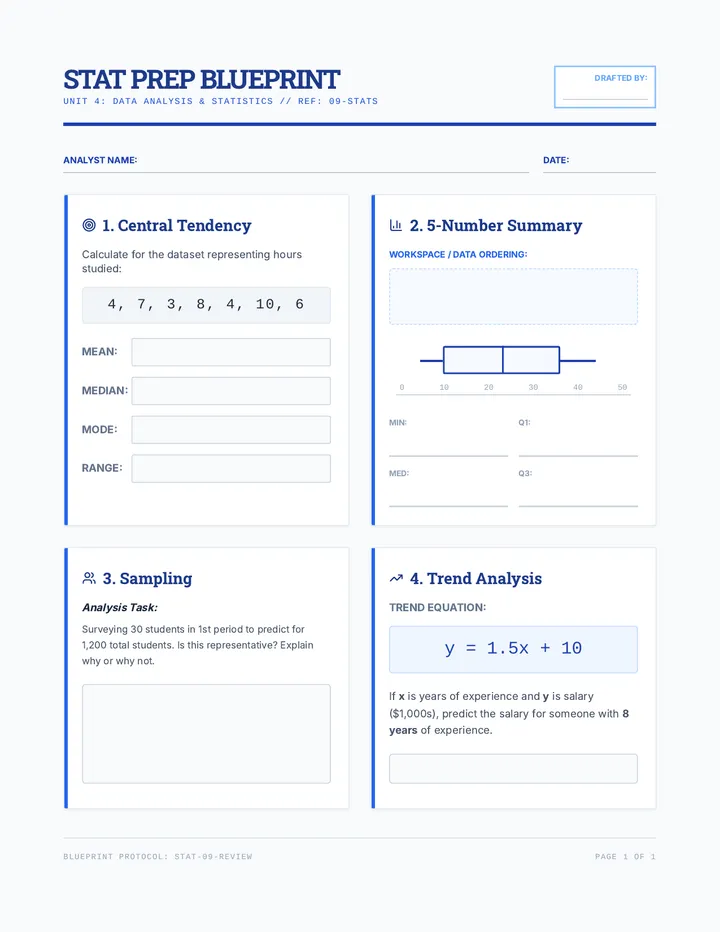
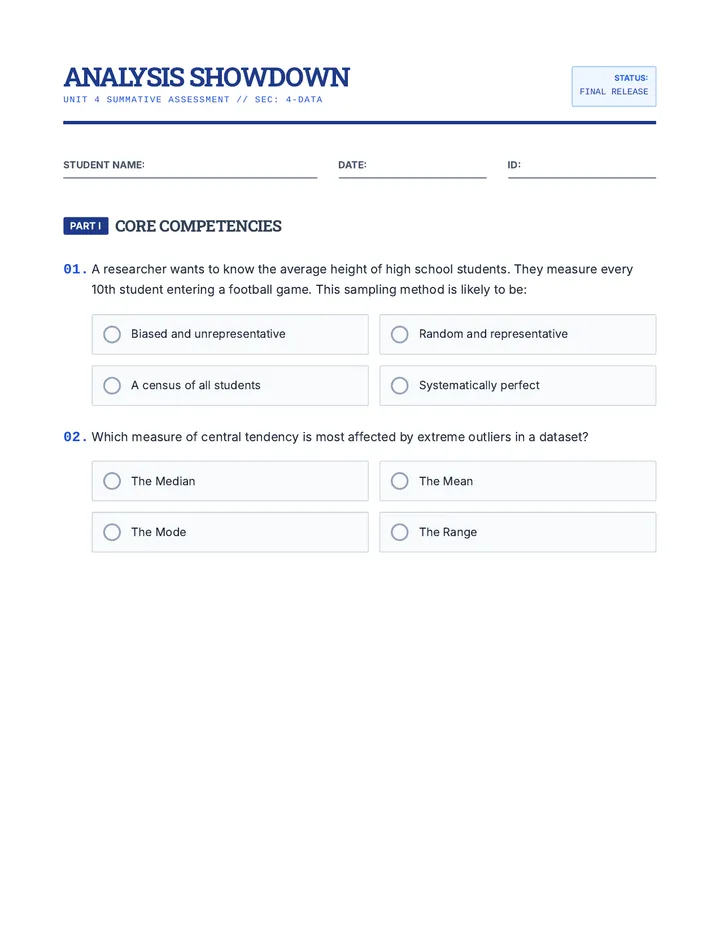
Key themes explored in this review include solving linear and quadratic equations, working with functions, understanding geometric properties of polygons and circles, applying trigonometric ratios (SOH CAH TOA) and identities, and analyzing statistical data. The video also places a strong emphasis on real-world application problems involving percentages, sales tax, discounts, and unit conversions. Particular attention is given to algebraic manipulation strategies, such as solving systems of equations and simplifying complex expressions, as well as test-taking tactics like identifying key information in word problems.
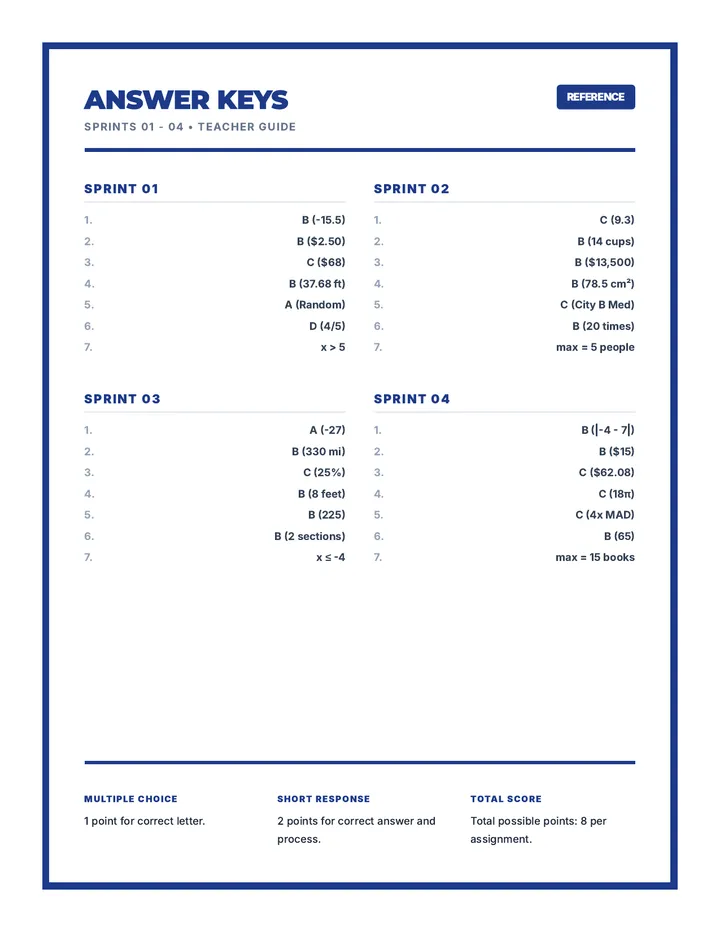
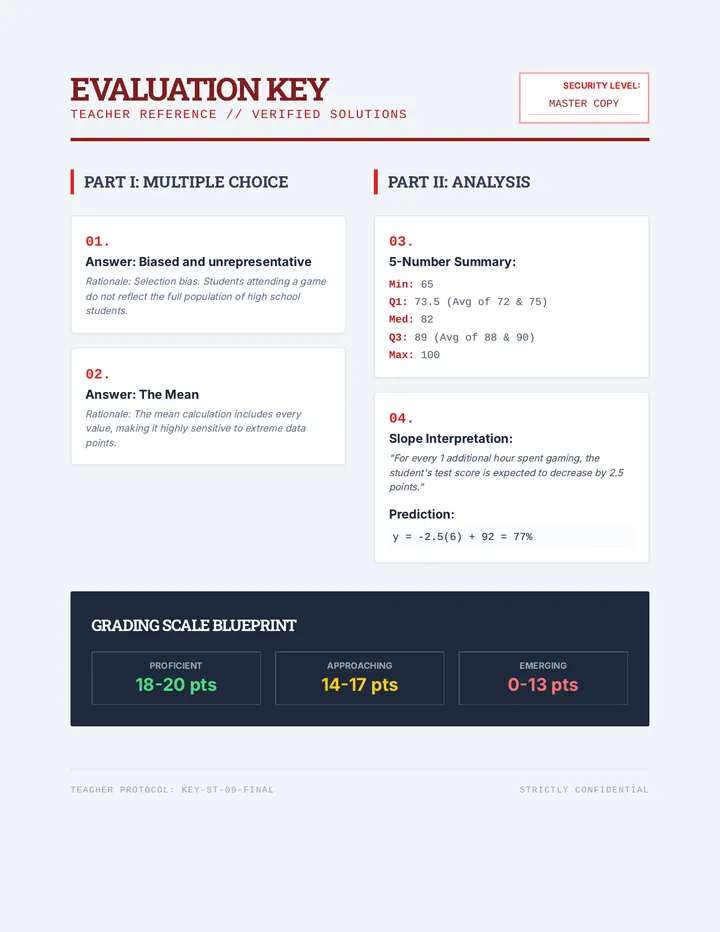
For educators and students, this video is a valuable resource for standardized test preparation. It allows teachers to identify specific areas of weakness in student understanding by isolating problem types (e.g., if a student struggles with problem 10, they need more support with circle geometry). The step-by-step explanations model clear mathematical reasoning, demonstrating not just *how* to get the right answer, but *why* specific methods work. This makes it an excellent tool for flipped classrooms, homework support, or intensive boot-camp style review sessions prior to test dates.