Data representation, distributions, and statistical variability using sampling and inference techniques. Integrates probability models, compound events, bivariate patterns, and linear models to guide data-driven decision making.
A comprehensive three-page printable STAAR Prep study guide for Grades 6-7, covering essential Math and RLA concepts with clear visual organization and student-friendly strategies.
A formal narrative reflection essay meticulously aligned with the SEYS 776 rubric to achieve "Excellent" scores. It presents synthesized insights on research methodology, the research-practice loop, personal researcher growth, and pedagogical applications in cohesive paragraphs, incorporating specific examples and meaningful course feedback.
A comprehensive unit covering 7th-grade geometry standards, focusing on scale drawings, geometric constructions, 3D cross-sections, angle relationships, and solving real-world area, volume, and surface area problems.
A comprehensive 15-day TSIA2 math review sequence featuring daily warm-up questions and weekly progress logs for students. The program covers all four TSIA2 domains through a "Math Marathon" theme.
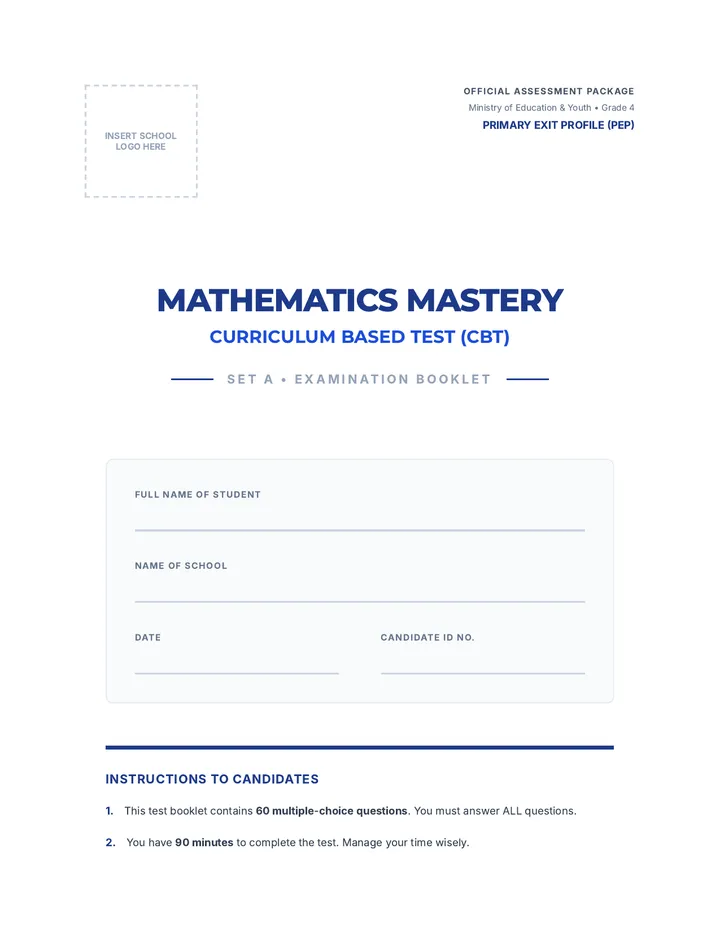
A series of official Grade 4 PEP-style assessments and teacher resources designed to prepare students for the Jamaican Primary Exit Profile, covering all key mathematical domains from the National Standards Curriculum.
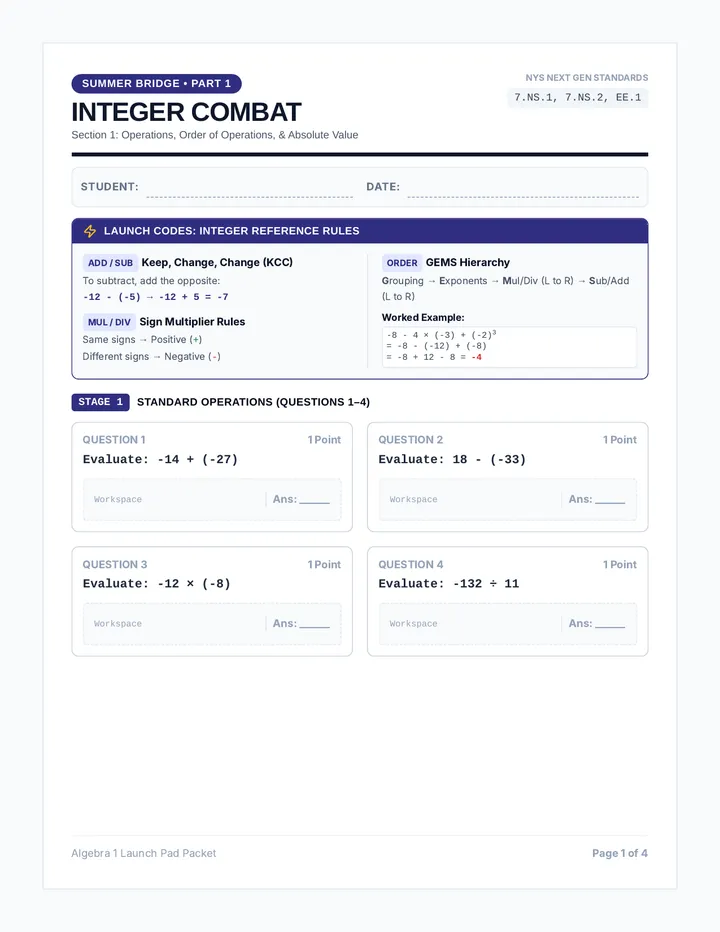
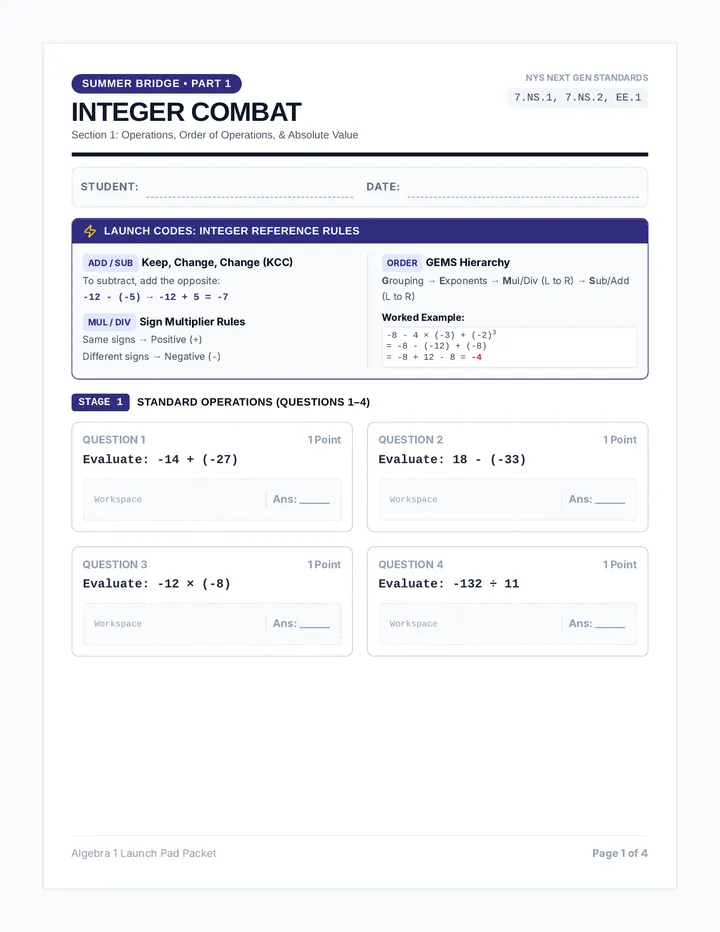
A comprehensive summer bridge workbook for rising 8th graders transitioning to Algebra 1. Contains review of prerequisite topics, advanced pre-algebra skills, real-world application, and an Algebra Escape Challenge.
A set of two comprehensive 90-minute substitute teacher packets covering middle school math topics. Each packet includes review exercises, application problems, and extension activities designed for independent student work.
A 7-week math review sequence for 7th-grade students preparing for the NYS Math Assessment, covering proportional relationships, percents, algebraic expressions, inequalities, scale drawings, and statistics/probability.
A comprehensive prep sequence for the most challenging questions on the ACT Math and Science sections. It focuses on high-level conceptual blueprints for math topics like complex numbers and matrices, alongside speed-reading and data-interpretation strategies for the Science section.
A comprehensive 7th-grade unit exploring probability through game design, where students move from understanding basic likelihood to analyzing mathematical fairness and building their own chance-based simulations.
A targeted intervention sequence focused on foundational probability concepts, specifically developing discrete probability distributions and calculating expected values through visual scaffolds like tree diagrams and organized counting.
A targeted intervention sequence focused on understanding and calculating the independence of events through structured reasoning and decision trees.
A targeted intervention sequence focused on compound probability, designed for small groups to master sample space construction and simulations.
A high-intensity, 120-minute math simulation. Students act as lead consultants, completing a high-speed skill warmup before selecting a professional sector (Music, Urban Planning, Rocket Science, or Sports Analytics) to solve a series of complex work orders.
A series of 8th and 9th grade Algebra lessons focused on linear relationships and systems of equations, with a focus on SPED/IEP support.
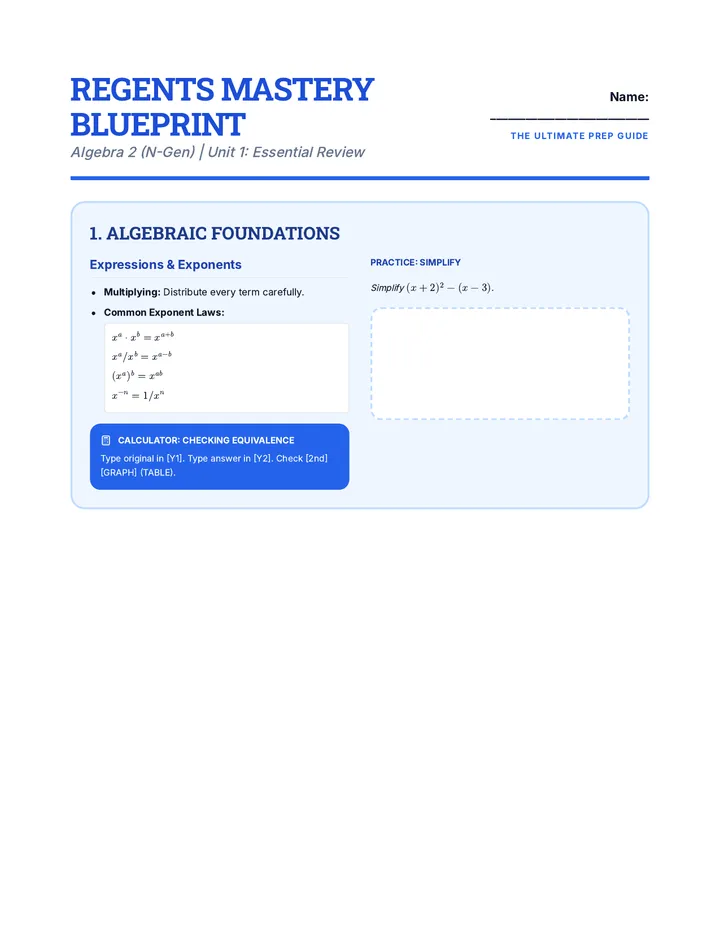
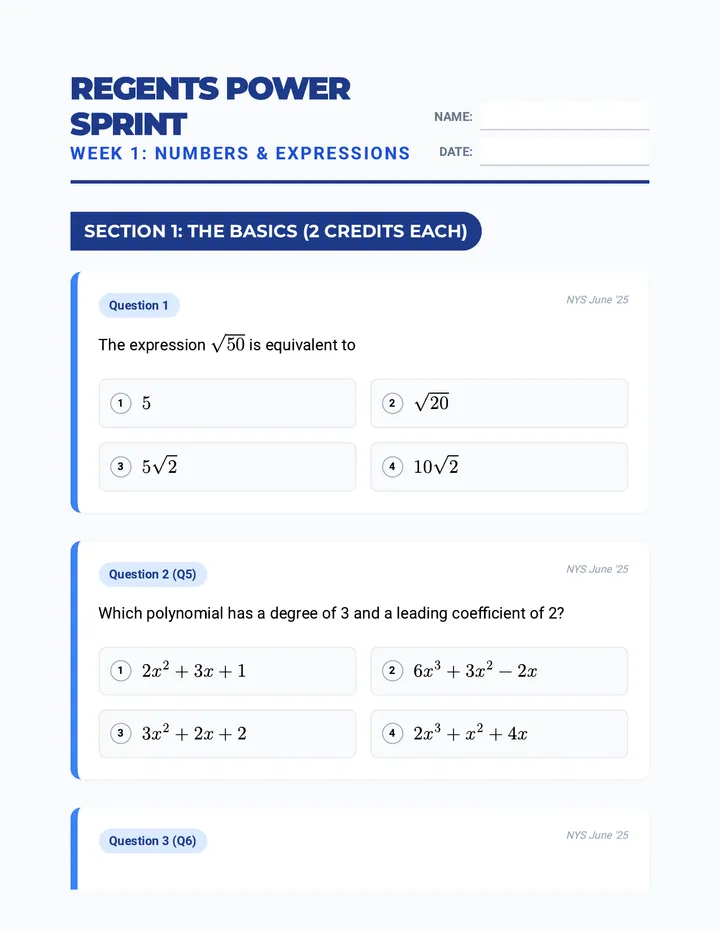
A comprehensive review suite for the New York State Mathematics Regents exams, including Algebra 1, Geometry, and Algebra 2, featuring mastery blueprints, calculator strategies, and exam-taking tips.
A comprehensive 10-week preparation sequence designed to get students ready for the Algebra I Regents exam by May 15th, featuring bi-weekly 30-minute practice sessions and visual anchor charts.
A comprehensive sequence covering the mastery of linear functions, equations, and inequalities. This progression takes students from identifying functions and solving basic equations to complex modeling with lines of best fit and inequality systems.
A 5-day series of morning work activities for 7th graders designed to sharpen critical thinking through error analysis, logic puzzles, open-ended problems, and real-world tasks.
A 10-day intensive review sequence for the Texas Algebra I EOC exam, focusing on two high-stakes vocabulary terms each day with definitions, visual samples, and practice problems.
A 15-day Texas Algebra 1 EOC test preparation program designed for non-math teachers to facilitate vocabulary mastery and high-yield readiness standard practice.
A comprehensive Algebra 1 Regents review sequence covering Linear Functions, Polynomials, Quadratics, and Statistics. Designed to build student confidence and mastery through structured practice and a architectural blueprint theme.
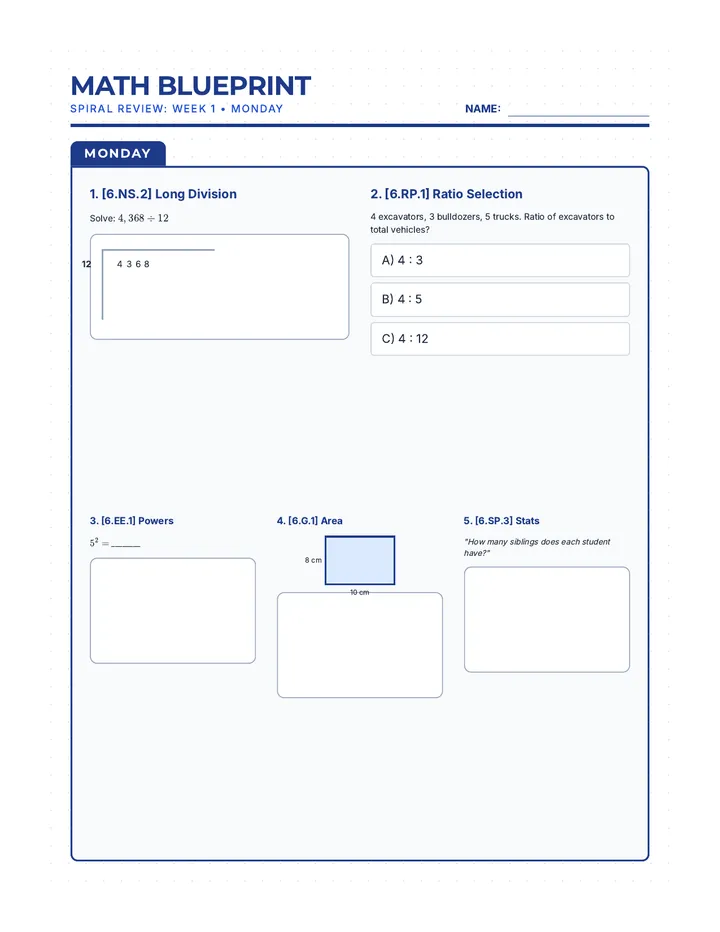
A 7-week comprehensive math review sequence designed to prepare 6th-grade students for North Carolina state testing, covering Number Systems, Ratios, Expressions, Geometry, and Statistics.
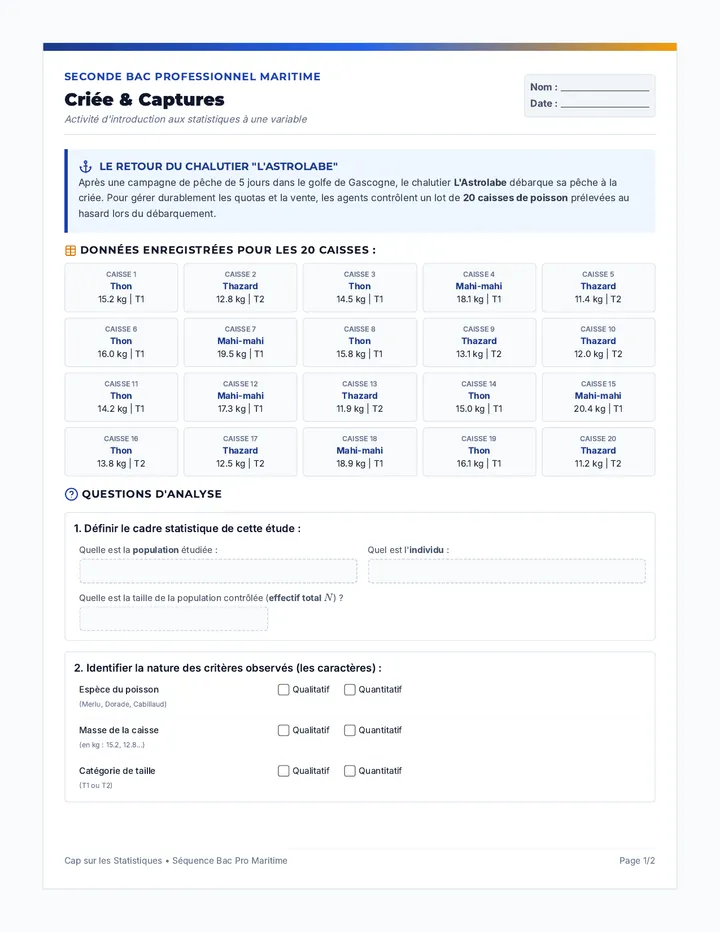
Séquence clé en main sur le module de chimie « Comment caractériser une solution ? » du programme de Seconde Bac Pro, contextualisée dans l'univers de la marine et de l'analyse des eaux.
Comprehensive quarterly assessment suites for high school self-contained geometry and statistics. These modules cover foundational geometric properties (lines, segments, angles) and key statistics elements (shape, center, spread, outliers, z-scores, and normal distributions).
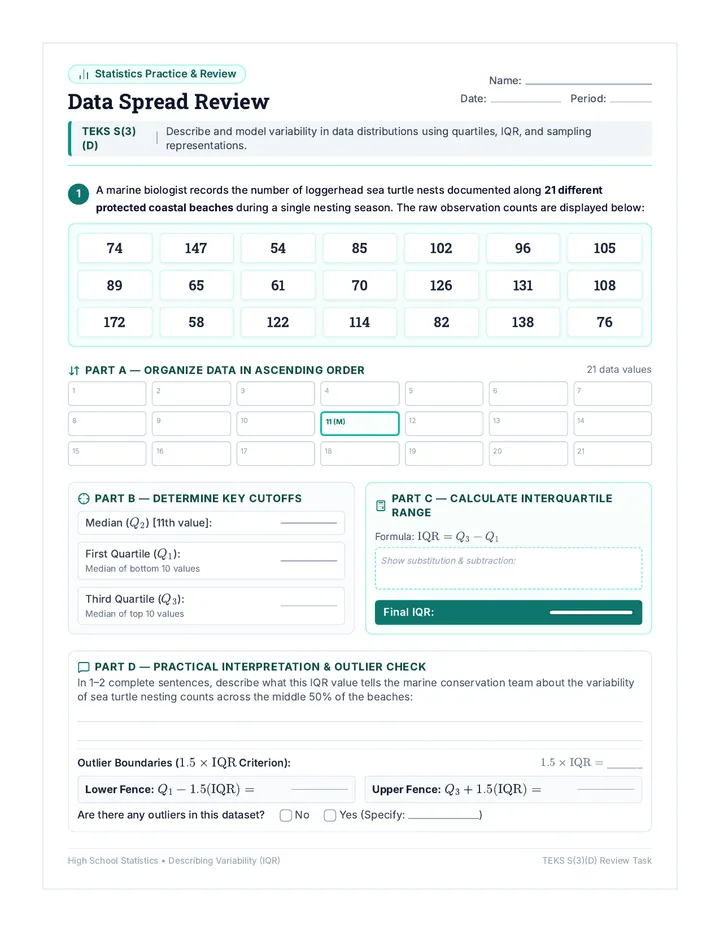
A comprehensive progression through descriptive statistics, from foundational calculations to high-school level analytical applications, including outlier effects and algebraic problem-solving.
A comprehensive math intervention sequence for 6th-grade students, focusing on four key domains: Numbers & Operations, Algebraic Thinking, Measurement & Data, and Geometry. This sequence uses high-leverage strategies from the All Learners Network (ALN) and aligns with i-Ready prerequisite modules to bridge conceptual gaps.
A comprehensive 5-day math review sequence designed for middle school students preparing for state testing. The sequence covers number systems, expressions, ratios, geometry, and statistics through a 'Brain Blueprint' theme.
A series of materials designed to evaluate and document first-grade students' mastery of year-long mathematical standards in preparation for second grade.
A comprehensive assessment sequence covering Normal Distributions, Z-scores, and the Central Limit Theorem.
A collection of sports-themed instructional materials that use real-world events to teach logic, statistics, and organizational skills.
Un kit complet de révision de dernière minute pour le DNB de Mathématiques, comprenant un sujet blanc guidé pas-à-pas pour les élèves et un corrigé détaillé avec barème pour l'enseignant.
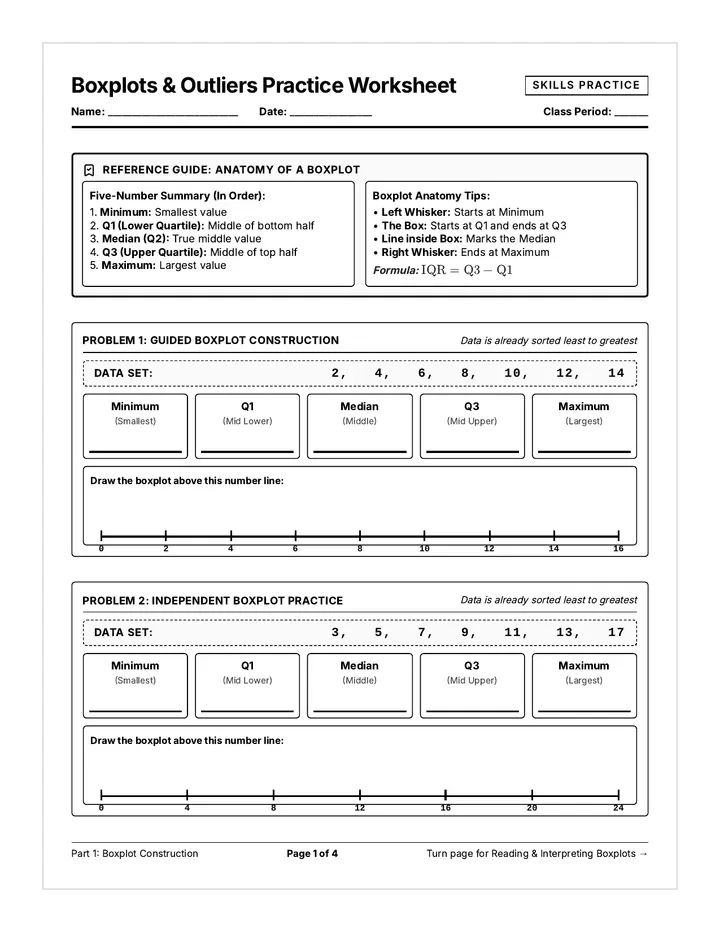
A comprehensive 90-minute lesson where 6th grade students master the creation and interpretation of box plots using real-world data from their own names and coin flips.
A focused lesson on the binomial distribution, covering the BINS criteria, identifying parameters, and calculating probabilities using digital spreadsheet tools.
A hands-on exploration of probability concepts using a specific set of 10 colored cubes. Students learn to calculate theoretical and experimental probability, identify sample spaces, and understand complements.
A four-day statistics packet using Cartoon Network shows to teach tallying, graphing, probability, range, and outliers, complete with a comprehensive teacher guide for IEP tracking.
Une série de ressources complètes pour préparer les élèves de 3ème à l'épreuve de mathématiques du DNB, incluant des corrigés détaillés et des fiches méthodologiques.
A hands-on probability lab where students rotate through various 'carnival' stations to explore theoretical and experimental probability, compound events, and tree diagrams.
A comprehensive TSIA2 math lesson focusing on Probabilistic and Statistical Reasoning, including classifying data, computing probability, and analyzing measures of center and spread. Features a guided workbook with multi-tool calculator strategies, an independent practice worksheet, and a detailed teacher answer key.
A comprehensive lesson covering probability rules, counting principles, discrete random variables, and empirical distributions. Includes a condensed reference sheet and a practice review worksheet.
A mini-lesson introducing probability concepts through the lens of 'The Luck Lab', covering vocabulary (certain to impossible) and fractional representations.
A comprehensive Grade 7 Math test prep lesson aligned to Arkansas Academic Standards, focusing on proportional relationships, rational number operations, geometry, and probability through an Arkansas-themed "Diamond State Discovery" lens.
A comprehensive Grade 7 lesson on probability and statistics, covering TEKS 7.6A-I and 7.12A. Students explore experimental versus theoretical probability through hands-on simulations and master data displays like box plots and histograms for STAAR readiness.
A hands-on statistics lesson where students collect and analyze footwear data from their peers to master measures of center and variability. Students act as 'Census Agents' to transform classroom trends into meaningful mathematical insights.
A comprehensive lesson on 3.MD.4 focusing on measuring to the nearest quarter inch and displaying that data on a line plot. Students measure their hand lengths to generate authentic data for analysis.
This 45-minute lesson for 10th-grade students highlights the critical role of collaboration and problem-solving skills across all mathematical domains. Students will experience how diverse perspectives and teamwork lead to more effective and robust solutions, fostering a deeper appreciation for the interconnectedness of math and real-world challenges.
Students learn to plot bivariate data, identify trends, and spot outliers using a real-world scenario of sleep and mood.
A 9th-grade statistics lesson exploring mean, median, and mode, with a focus on identifying the most appropriate measure of central tendency in the presence of outliers. Students act as 'Data Detectives' to investigate real-world scenarios.
A comprehensive lesson on measures of center (mean, median, mode) where students learn to summarize numerical data and find missing values using time, temperature, and group size data.
A 9th-grade lesson focused on interpreting and comparing multiple box plots to analyze data distributions, spread, and skewness. Students will transition from basic identification to making data-driven conclusions across various scenarios.
A 65-minute lesson for 9th-grade students to master scatter plots and correlation. Students act as 'Data Detectives' to identify positive, negative, and no correlation patterns in real-world data sets.
A creative end-of-year project where students choose between two paths to demonstrate mastery of transformations, linear equations, and patterns/sequences. Designed with scaffolded options for 8th-grade students.
A comprehensive 12-minute presentation and speaker notes based on research investigating the link between parental attitudes and student math outcomes.
A comprehensive assessment lesson for 9th-grade statistics, covering central tendency, data visualization, sampling, and correlation through a blueprint-themed instructional arc.
A comprehensive assessment lesson focusing on North Carolina 3rd grade measurement standards, including time to the minute, elapsed time, liquid volume, mass, and data representation. Students will demonstrate mastery through multiple-choice questions and multi-step word problems.
A high-energy, station-based review session where students collaborate to build 'Vocabulary Posters' covering all major 3rd-grade math domains. Students rotate through 8 stations, adding new layers of mathematical reasoning and vocabulary to shared posters at each stop.
A collaborative data collection and graphing project where students partner up to survey 5th graders, collect tally mark data, and design a custom poster featuring a line plot and an alternative graph style.
A comprehensive lesson on data interpretation and graphing, moving from foundational skill practice to an independent data collection and design project.
A 45-minute investigation into the world of data manipulation, covering misleading graphs, correlation vs. causation, and source credibility.
A comprehensive, arcade-themed review of all 4th-grade Virginia SOL mathematics standards. Includes a highly engaging practice slide deck, structured student answer sheet, complete teacher script with answers and misconceptions, and a desk reference sheet.
A hands-on, community-based mathematics and environmental science lesson. Students take on specific active roles during a community cleanup to collect, weigh, and analyze litter data, converting their real-world findings into rates, ratios, percentages, and visual graphs.
A 60-minute lesson where students act as lead researchers in a data laboratory. They will master constructing and interpreting dot plots, histograms, and box plots to analyze scientific findings.