Lenny.com
Explore
Create
ActivitiesNewMathEnglish Language ArtsScience & EngineeringSocial StudiesGlobal LanguagesHealth & Physical EducationSpecial EducationCounseling & Life SkillsArts & CreativityESL
Lenny.com
Lenny.com
Explore
Create
ActivitiesNewMathEnglish Language ArtsScience & EngineeringSocial StudiesGlobal LanguagesHealth & Physical EducationSpecial EducationCounseling & Life SkillsArts & CreativityESL
Lenny.com
Lenny.com

Solutions

Lenny for EducatorsLenny for SchoolsLenny for Districts

Product

ExploreSign inCreateSupportAbout

Resources

Getting startedMTSS Acceleration Program

© 2026 Lenny Learning Inc.

TermsPrivacyAccessibility
LinkedInInstagramX
Lenny

Statistical Variability

Analysis of data spread using range, interquartile range, and mean absolute deviation. Examines how individual data points differ from the center and from each other within a distribution.

MathNumbers & CountingCounting ObjectsNumber NamesComparing NumbersNumber OperationsCounting SequenceNumbers 0-10Place Value Understanding and SystemAdd and Subtract Within 20Addition and Subtraction ConceptsAddition and Subtraction EquationsAddition and Subtraction ProblemsFoundations for MultiplicationMultiplication and Division PropertiesMultiply and Divide Within 100Multiplication and Division ProblemsFactors and MultiplesProperties of OperationsPatterns and RelationshipsGenerate and Analyze PatternsMulti-Digit ArithmeticPlace Value OperationsMulti-Digit and Decimal OperationsNumerical ExpressionsFour Operations and PatternsFour Operations Problem SolvingMeasurement & DataMeasurable AttributesMeasuring LengthsMeasure and Estimate Lengths in Standard UnitsRelate Addition and Subtraction to LengthClassifying and Counting ObjectsTime and MoneyArea Concepts and MeasurementPerimeter and Area MeasuresAngle Concepts and MeasurementTime, Volume, and MassMeasurement Unit ConversionsGeometryIdentifying ShapesShapes and AttributesShape Attributes and ReasoningShapes and CompositionClassifying 2D FiguresGeometric Figures and RelationshipsLines, Angles, and ShapesAngle, Area, and VolumeGeometric MeasurementVolume of 3D ShapesCoordinate Plane ApplicationsTransformations in the PlaneCongruence and SimilarityUnderstand congruence in terms of rigid motionsSimilarity and TransformationsProve Theorems Involving SimilarityPythagorean TheoremTrigonometry for General TrianglesMake Geometric ConstructionsProve Geometric TheoremsTheorems About CirclesFind Arc Lengths And Areas of Sectors of CirclesVolume FormulasRelationships Between Two-Dimensional and Three-Dimensional ObjectsProve Simple Geometric Theorems AlgebraicallyTranslate Between Geometric Description and Equation for Conic SectionApply Geometric Concepts in Modeling SituationsFractions & DecimalsFractions as NumbersBuilding FractionsFraction Equivalence and OrderingAdding and Subtracting FractionsMultiplying and Dividing FractionsDividing FractionsDecimal FractionsMulti-Digit Computation and FactorsAdd, Subtract, Multiply, and Divide Rational NumbersRational Number SystemIrrational Numbers and ApproximationsRatiosRatios and ProportionsProportional RelationshipsUnit RateAlgebraAlgebraic ExpressionsGenerate Equivalent ExpressionsQuantitative RelationshipsProportional Relationships and Linear EquationsEquations and InequalitiesEquation Solving and ReasoningLinear Equations and SystemsGraph Equations and InequalitiesSystems of EquationsReal-World Algebraic ProblemsQuantitative Reasoning with UnitsExpression StructureEquivalent Expression FormsRadicals and Integer ExponentsRational ExponentsRational and Irrational NumbersPolynomial OperationsPolynomial IdentitiesPolynomial Zeros and FactorsRational ExpressionsComplex Number OperationsComplex Numbers in PolynomialsComplex Numbers on PlaneStatistics & ProbabilityRepresent and Interpret DataData DistributionsStatistical VariabilityProbability ModelsCompound Event ProbabilitiesStatistical SamplingInterpret Categorical and Quantitative DataBivariate Data PatternsInterpret Linear ModelsComparing Two PopulationsRandom Processes in StatisticsIndependence and Conditional ProbabilityExpected ValuesProbability-Based Decision MakingStatistical Inference and ConclusionsFunctionsFunction Concepts and NotationDefine and Compare FunctionsInterpret Functions in ContextAnalyze Function RepresentationsModel Relationships with FunctionsIdentify Linear vs Exponential GrowthDistinguish Between Function TypesCompare Growth RatesInterpret Function ExpressionsBuild Functions from RelationshipsConstruct and Model FunctionsTransform and Combine FunctionsModel Comparison and SelectionSolve Exponential EquationsTrigonometryTrigonometric Ratios Involving Right TrianglesTrigonometric Functions and Unit CircleModel with Trigonometric FunctionsTrigonometric IdentitiesVectors & MatricesIntroduction to Vectors and MatricesVector QuantitiesVector OperationsMatrix OperationsCalculusLimits and ContinuityDerivative Concepts and NotationDerivative Rules and TechniquesApplications of DerivativesOptimization ProblemsRelated RatesCurve Sketching and AnalysisIntegration Concepts and NotationAntiderivatives and Indefinite IntegralsDefinite Integrals and AreaFundamental Theorem of CalculusIntegration TechniquesApplications of IntegrationDifferential EquationsSequences and SeriesParametric and Polar FunctionsVector-Valued Functions

Videos

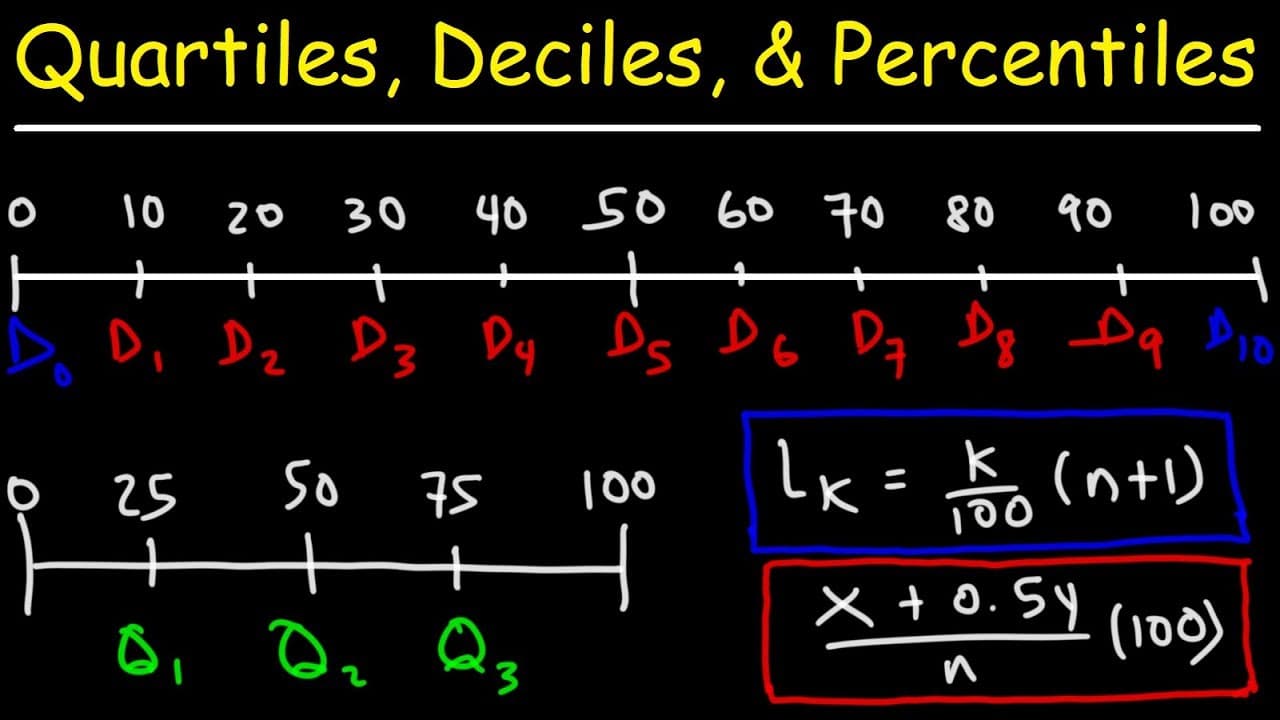
How to Calculate Quartiles, Deciles, and Percentiles

How to Calculate Quartiles, Deciles, and Percentiles

This comprehensive math tutorial provides a deep dive into statistical measures of position: quartiles, deciles, and percentiles. It begins by defining each term and visualizing their relationships on a number line, establishing a clear conceptual foundation before moving into calculations. The video demonstrates how to calculate these values for both odd and even datasets using two distinct methods: finding the median physically by eliminating outer numbers, and using the position formula $L = \frac{k}{100}(n+1)$. A significant portion of the video focuses on the nuances of calculation, specifically how to handle results when the position formula yields a decimal. It explains the process of averaging the two surrounding data points to find the precise value. Furthermore, the video introduces a formula for finding the percentile rank of a specific data point, which is useful for standardized testing contexts. Finally, it guides viewers through constructing a cumulative relative frequency table and using it to determine deciles efficiently. This resource is highly valuable for algebra and statistics classrooms. It addresses common points of confusion, such as the difference between a percentile's "position" and its "value," and how to handle data that falls between two values. Teachers can use this video to introduce new concepts, reinforce calculation methods, or provide a refresher on reading cumulative frequency tables. The step-by-step examples with varying dataset sizes make it an excellent reference for students mastering data analysis.

The Organic Chemistry TutorThe Organic Chemistry Tutor

35mins 13s

Using Measures of Dispersion to Choose a Basketball Champion

Using Measures of Dispersion to Choose a Basketball Champion

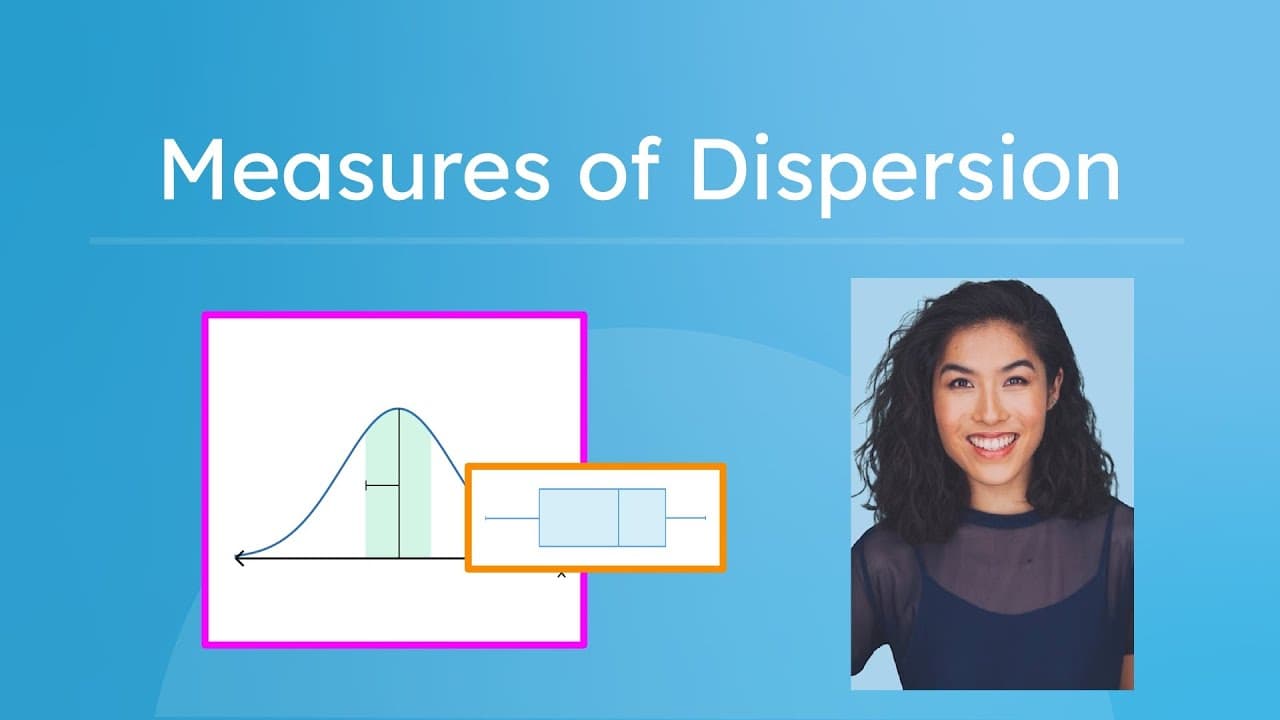
This educational video introduces advanced statistics students to measures of dispersion—statistical tools used to describe the spread or variability of a dataset. Using a practical scenario where a basketball coach must choose a free-throw shooter for a championship game, the video demonstrates why the mean (average) alone is often insufficient for making informed decisions. It guides viewers through three key players who all share the same shooting average but have vastly different consistency levels.

Miacademy & MiaPrep Learning ChannelMiacademy & MiaPrep Learning Channel

13mins 5s

Constructing Box and Whisker Plots Step-by-Step

Constructing Box and Whisker Plots Step-by-Step

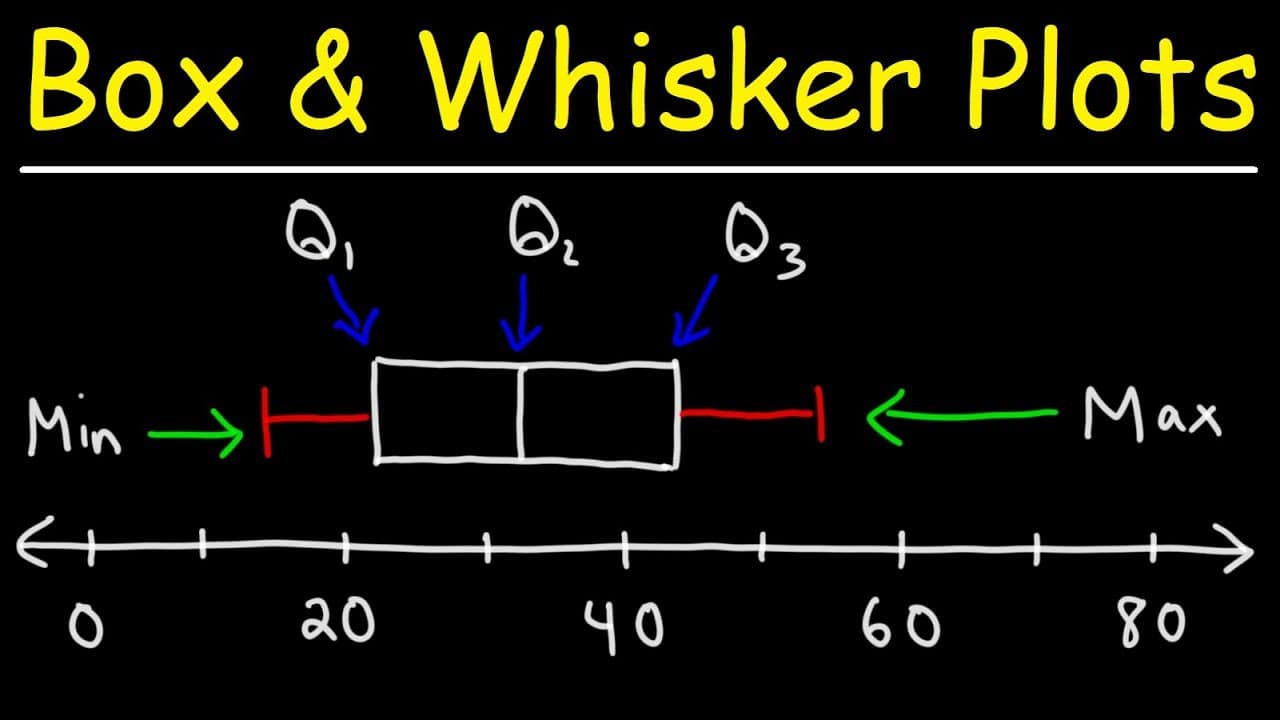
This educational video provides a comprehensive, step-by-step tutorial on how to construct box and whisker plots (also known as box plots). The narrator guides viewers through identifying the five-number summary required to draw the plot: minimum, first quartile (Q1), median (second quartile/Q2), third quartile (Q3), and maximum. The video uses clear, handwritten visualizations on a blackboard style background to demonstrate the process of organizing raw data, calculating quartiles, and mapping these points onto a number line.

The Organic Chemistry TutorThe Organic Chemistry Tutor

13mins 56s

ACT Math Practice Test: Review of Algebra, Geometry, and Trig Concepts

ACT Math Practice Test: Review of Algebra, Geometry, and Trig Concepts

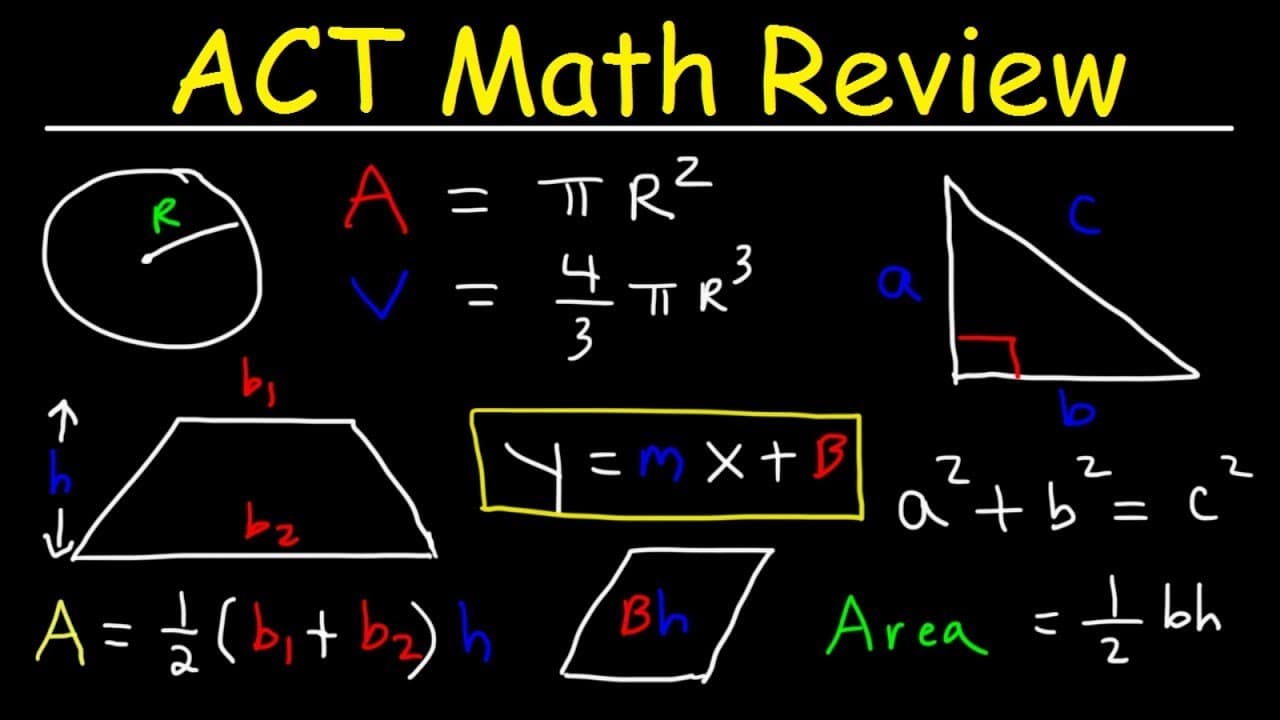
This comprehensive video tutorial serves as an intensive review for the ACT Math section, covering a wide array of topics crucial for high school students preparing for college entrance exams. The content is structured as a series of 31 practice problems that mimic the style and difficulty of actual ACT questions. It progresses through various mathematical domains including pre-algebra, elementary algebra, intermediate algebra, coordinate geometry, plane geometry, and trigonometry. The video adopts a pause-and-practice format, encouraging active participation where viewers attempt each problem before watching the detailed step-by-step solution. Key themes explored in this review include solving linear and quadratic equations, working with functions, understanding geometric properties of polygons and circles, applying trigonometric ratios (SOH CAH TOA) and identities, and analyzing statistical data. The video also places a strong emphasis on real-world application problems involving percentages, sales tax, discounts, and unit conversions. Particular attention is given to algebraic manipulation strategies, such as solving systems of equations and simplifying complex expressions, as well as test-taking tactics like identifying key information in word problems. For educators and students, this video is a valuable resource for standardized test preparation. It allows teachers to identify specific areas of weakness in student understanding by isolating problem types (e.g., if a student struggles with problem 10, they need more support with circle geometry). The step-by-step explanations model clear mathematical reasoning, demonstrating not just *how* to get the right answer, but *why* specific methods work. This makes it an excellent tool for flipped classrooms, homework support, or intensive boot-camp style review sessions prior to test dates.
The Organic Chemistry TutorThe Organic Chemistry Tutor

20mins 33s

How to Calculate Percent Error with a Real-World Example

How to Calculate Percent Error with a Real-World Example

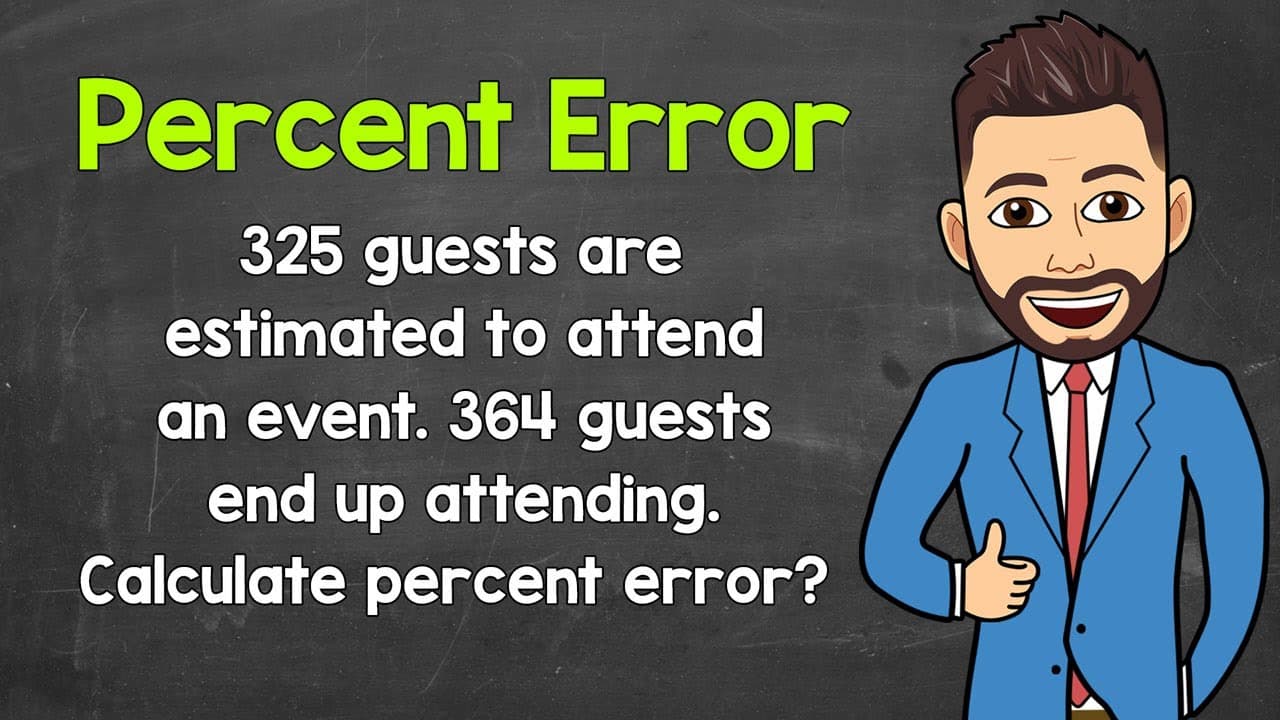
This instructional math video guides students through the process of calculating percent error, a critical concept for understanding accuracy in measurements and estimations. The video begins by defining percent error and presenting the standard formula involving absolute value. It then walks through a practical, real-world word problem involving an event planner who estimated 325 guests but had 364 actual attendees, demonstrating how to apply the formula to find the percentage of error in the estimation. The video covers several key mathematical themes, including the difference between estimated and actual values, the function of absolute value in determining error magnitude, and the procedural steps of converting decimals to percentages. It also explicitly demonstrates how to round the final result to the nearest whole percent, reinforcing rules of rounding in a practical context. The step-by-step breakdown ensures that viewers understand not just the calculation, but the logic behind comparing an estimate against reality. For educators, this resource serves as an excellent direct instruction tool or review aid for middle school math curriculums. It simplifies a multi-step process—subtraction, division, and multiplication—into manageable chunks. The use of a relatable scenario helps ground abstract statistics concepts in reality, making it useful for lessons on data analysis, scientific measurement, or financial literacy where prediction versus reality is a key metric.

Math with Mr. JMath with Mr. J

4mins 25s

Calculating Sample Standard Deviation Step-by-Step

Calculating Sample Standard Deviation Step-by-Step

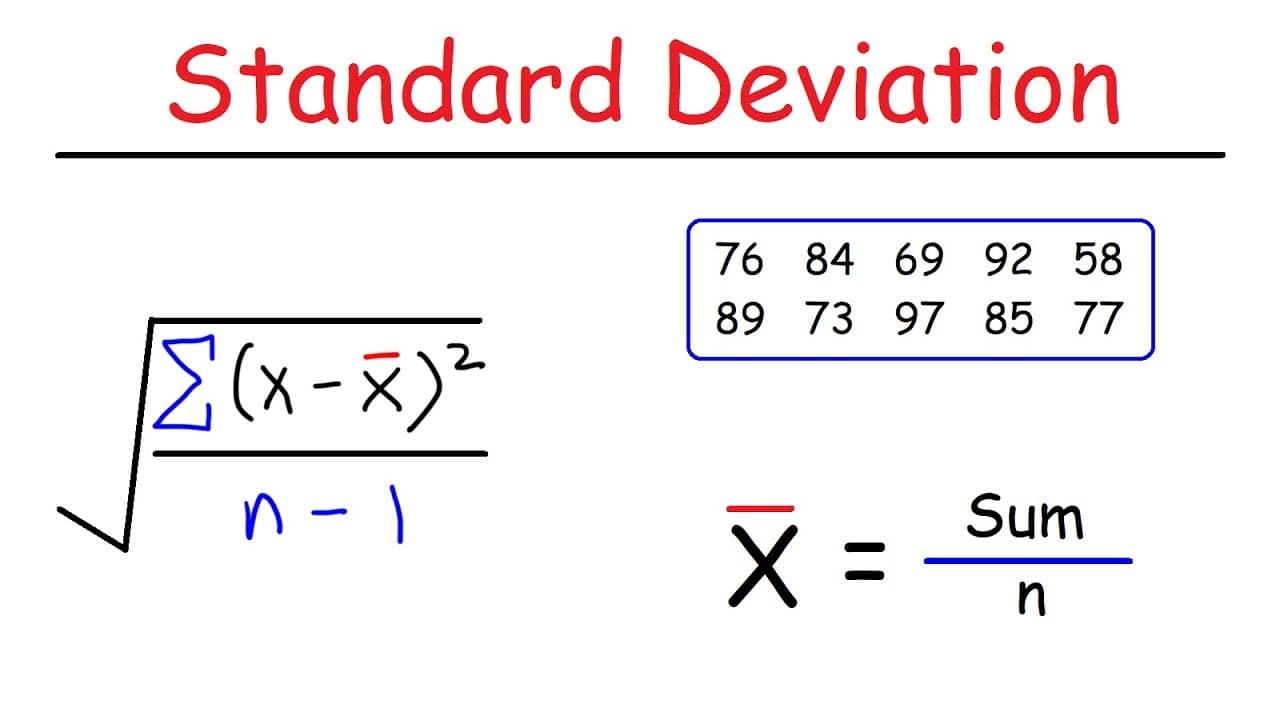
This educational video provides a clear, step-by-step tutorial on how to calculate the sample standard deviation for a set of numbers. The instructor uses a digital whiteboard to demonstrate the process manually, breaking down the complex statistical formula into manageable arithmetic steps. The video covers two distinct examples: a smaller data set with five numbers to introduce the concept, and a larger data set with ten numbers to reinforce the process and demonstrate how to handle more data points. The content focuses on key statistical concepts including calculating the arithmetic mean (average), determining sample size (n), calculating the differences between data points and the mean, squaring those differences, and applying the specific formula for sample standard deviation which requires dividing by n-1. The instructor emphasizes the order of operations and provides practical tips for organizing calculations to avoid errors. This resource is highly valuable for high school and introductory college statistics classrooms. It demystifies a formula that often intimidates students by showing the mechanical logic behind it. Teachers can use this video to support flipped classroom models, providing students with a procedural reference for homework, or as a remediation tool for students struggling with the multi-step calculation process of finding measures of spread.

The Organic Chemistry TutorThe Organic Chemistry Tutor

7mins 14s

Materials

Muscle Fatigue Activity

Muscle Fatigue Activity

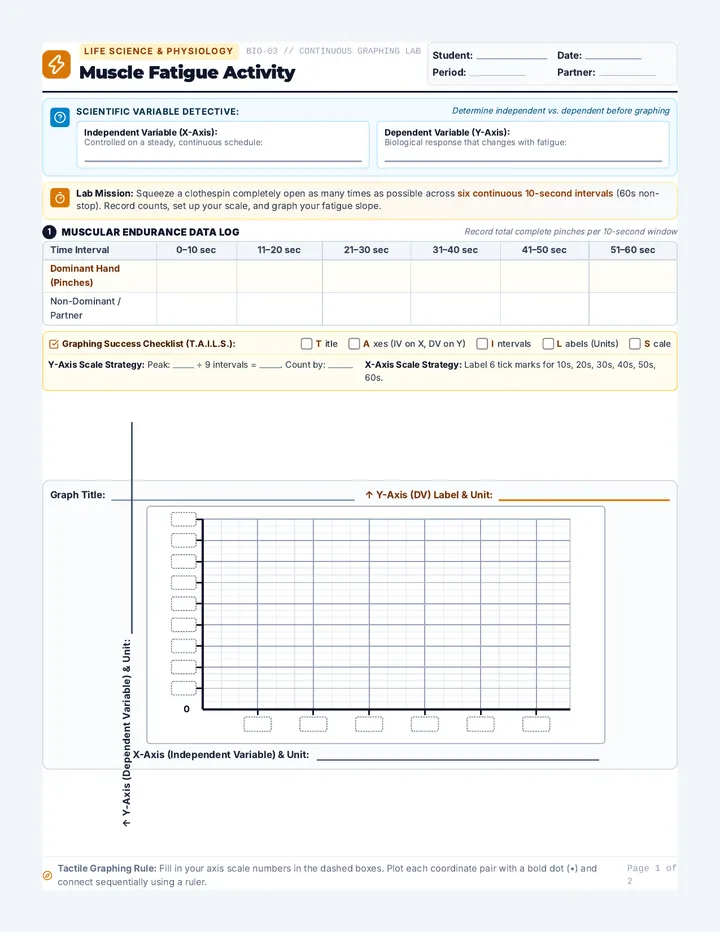
A 2-page hands-on life science printable activity where students measure clothespin pinch frequency across six 10-second intervals to map muscular fatigue, independently identify the independent and dependent variables, determine their coordinate scale, and construct a precision line graph on a full coordinate grid.

S

stewart

Data Displays Practice Worksheet

Data Displays Practice Worksheet

A comprehensive two-page student worksheet covering major statistical data displays (dot plots, bar graphs, histograms, box plots, and scatter plots). Page 1 features a display selection reference guide with construction procedures and scenario-matching diagnostics. Page 2 provides hands-on construction labs where students calculate five-number summaries, complete frequency tables, and plot histograms, box plots, and scatter plots.

F

fradunsky

Boxplots and Outliers Worksheet

Boxplots and Outliers Worksheet

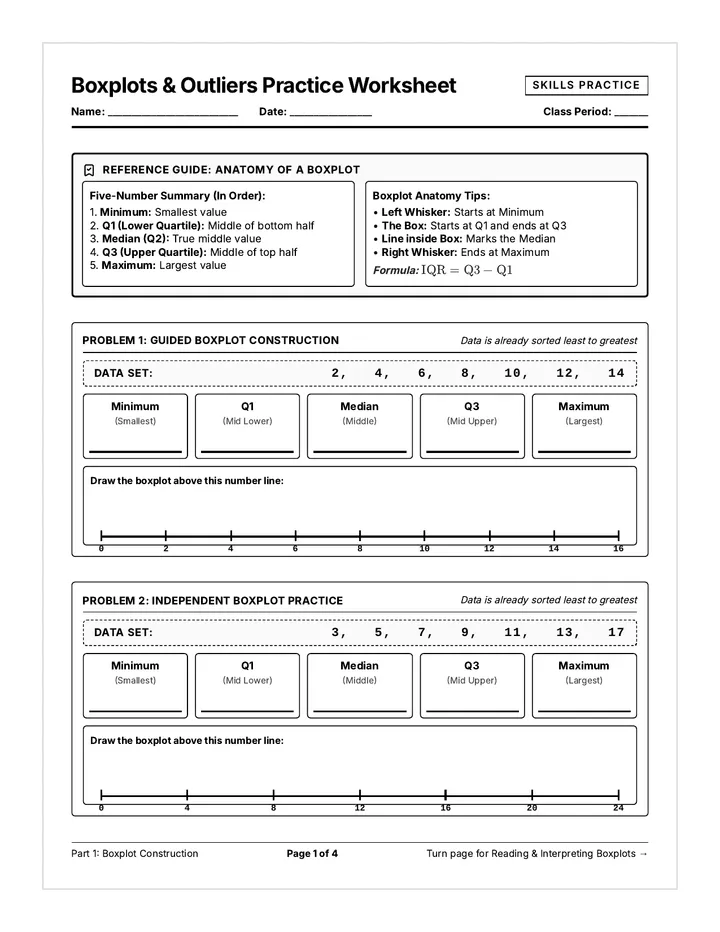
A comprehensive 4-page print-friendly practice worksheet for SPED students reviewing five-number summaries, boxplots, IQR, fence calculations, and outlier detection with additional problems, expanded handwriting space, and reference notes.

D

david.marques

Indiana Math Standards Guide

Indiana Math Standards Guide

A comprehensive 4-page reference guide and curriculum pacing tracker for 6th Grade Indiana Academic Standards in Mathematics. Features complete standard codes, official descriptions, student-friendly 'I Can' statements, and tracking checkboxes for Number Sense, Computation, Algebraic Thinking, Geometry, and Data Analysis.

RG

Richard Gist

Leaf Lengths Mean Review

Leaf Lengths Mean Review

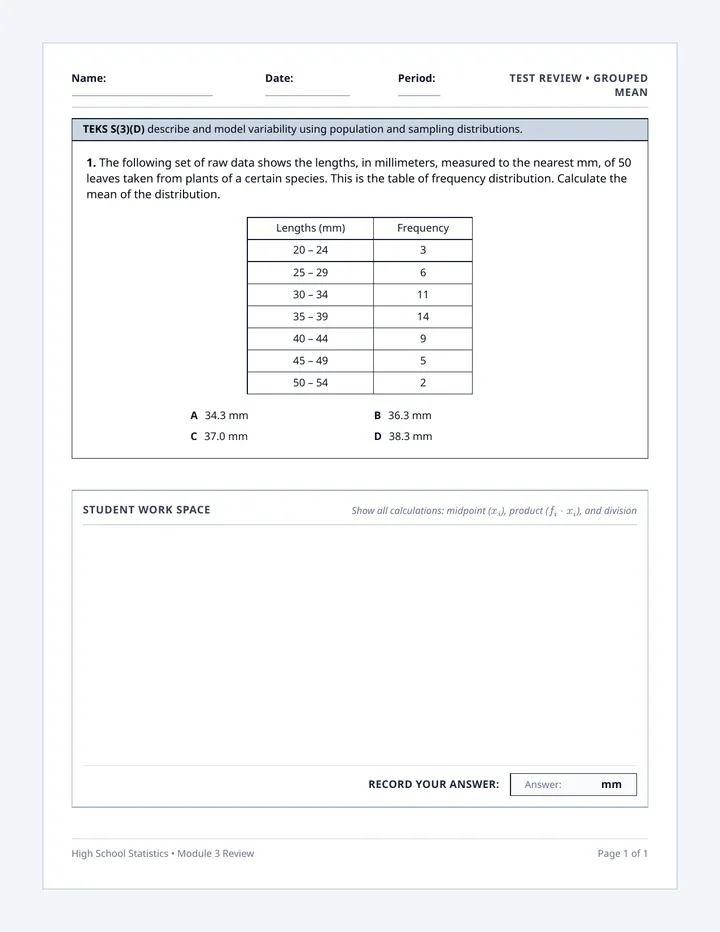
A single-page test review document formatted identically to the state assessment question for TEKS S(3)(D). Features the exact grey standard banner, question stem for a 50-leaf dataset, clean black-bordered frequency distribution table, multiple-choice options, and a clean student workspace.

MR

Mahuya Roy Chowdhury

Data Spread Review Worksheet

Data Spread Review Worksheet

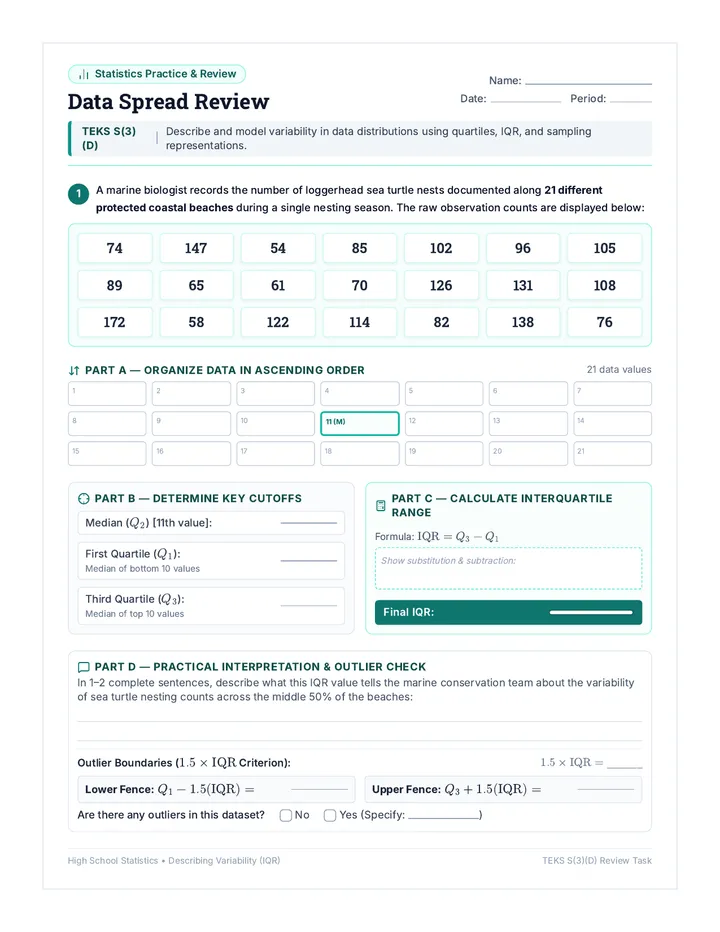
A targeted statistics review worksheet modeling data variability using interquartile range (IQR) and outlier boundaries in a marine biology context. Aligned to TEKS S(3)(D), it presents a 21-point coastal nesting dataset with structured work areas for quartile identification and contextual interpretation.

MR

Mahuya Roy Chowdhury

Sequences

Math Blueprint Week 1 Booklet (Definitive)

Math Blueprint Spiral

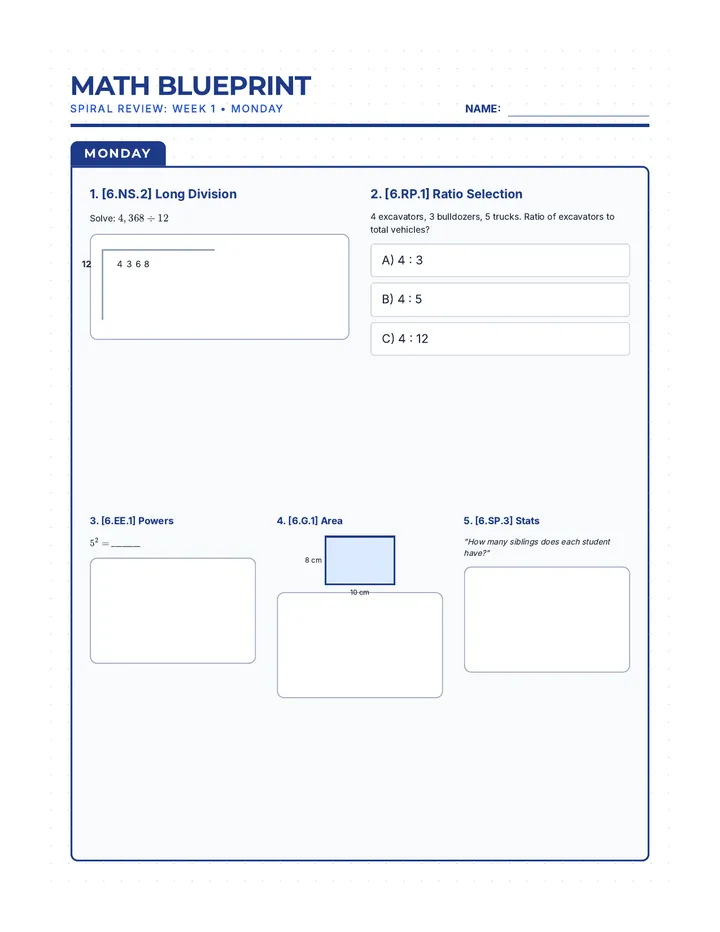
A 7-week comprehensive math review sequence designed to prepare 6th-grade students for North Carolina state testing, covering Number Systems, Ratios, Expressions, Geometry, and Statistics.

MK

Michell Kisler

27
Regents Mastery Blueprint Study Guide

Regents Mastery Suite

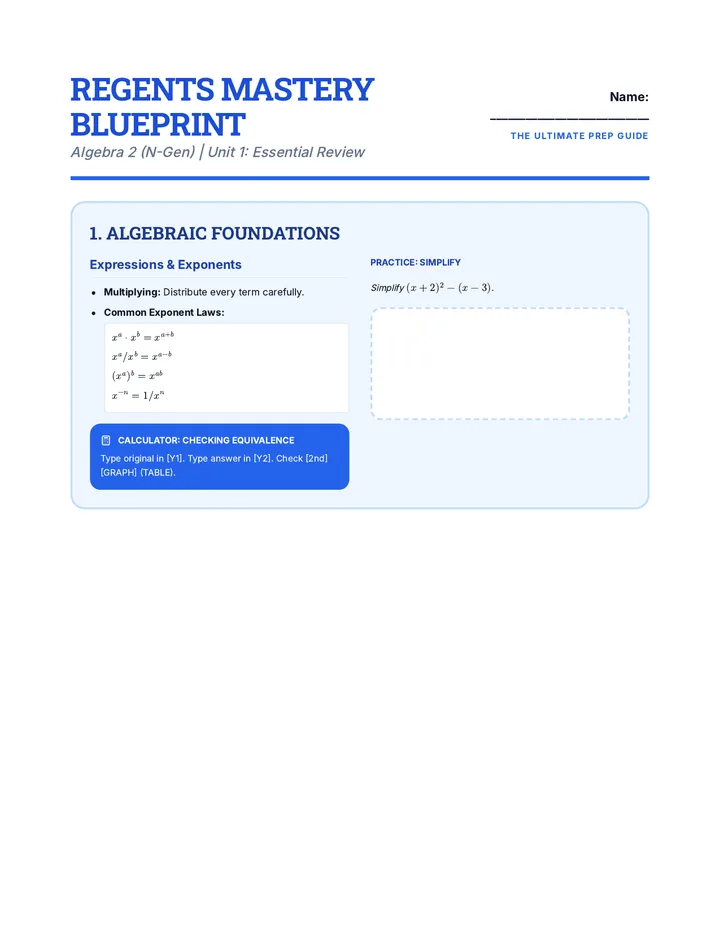
A comprehensive review suite for the New York State Mathematics Regents exams, including Algebra 1, Geometry, and Algebra 2, featuring mastery blueprints, calculator strategies, and exam-taking tips.

KB

Kayla Borozny

15
Week 1 Power Sprint Worksheet

Regents Road Map

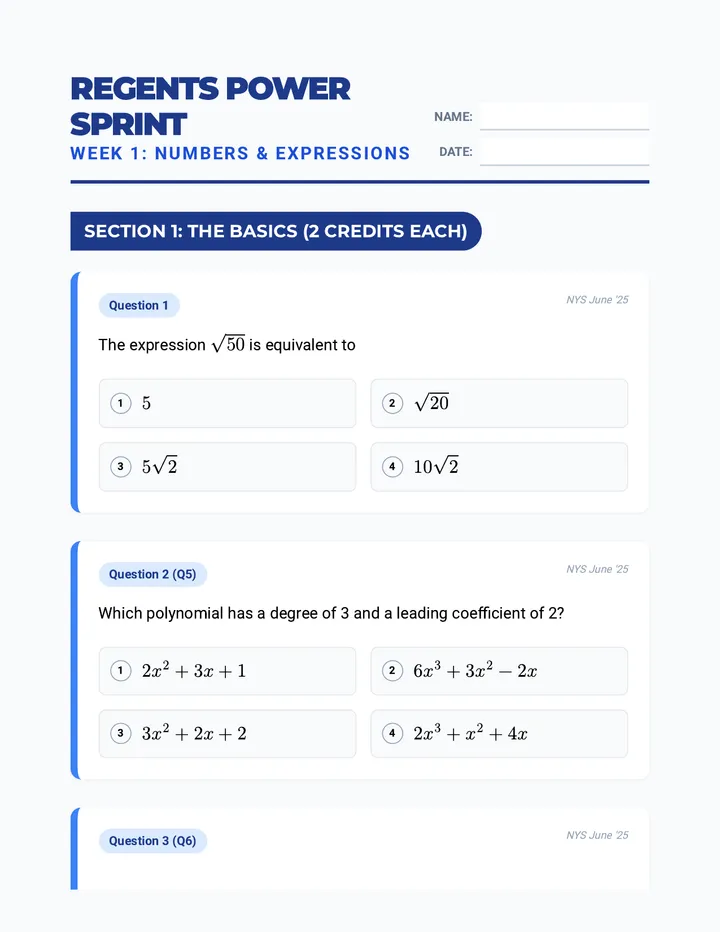
A comprehensive 10-week preparation sequence designed to get students ready for the Algebra I Regents exam by May 15th, featuring bi-weekly 30-minute practice sessions and visual anchor charts.

L

laura.clar

31
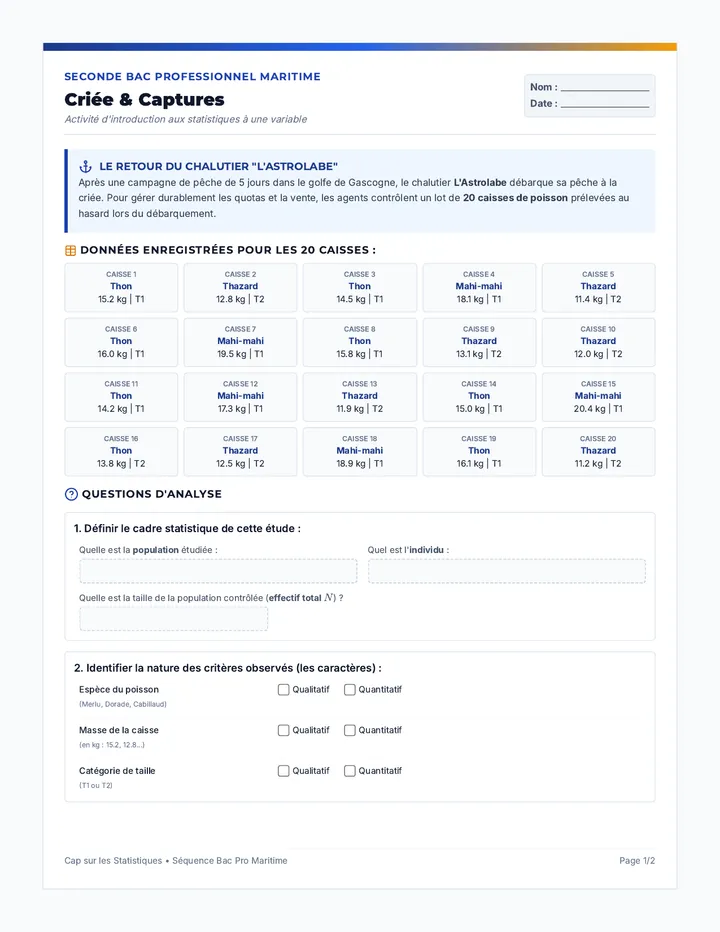
Positionnement Diagnostic Test

Cap sur les Automatismes

Séquence d'accueil et de consolidation des automatismes numériques (nombres, fractions, priorités opératoires) comprenant un test de positionnement et des fiches d'exercices contextualisées.

EK

Emmanuelle Klaus-Baron

7
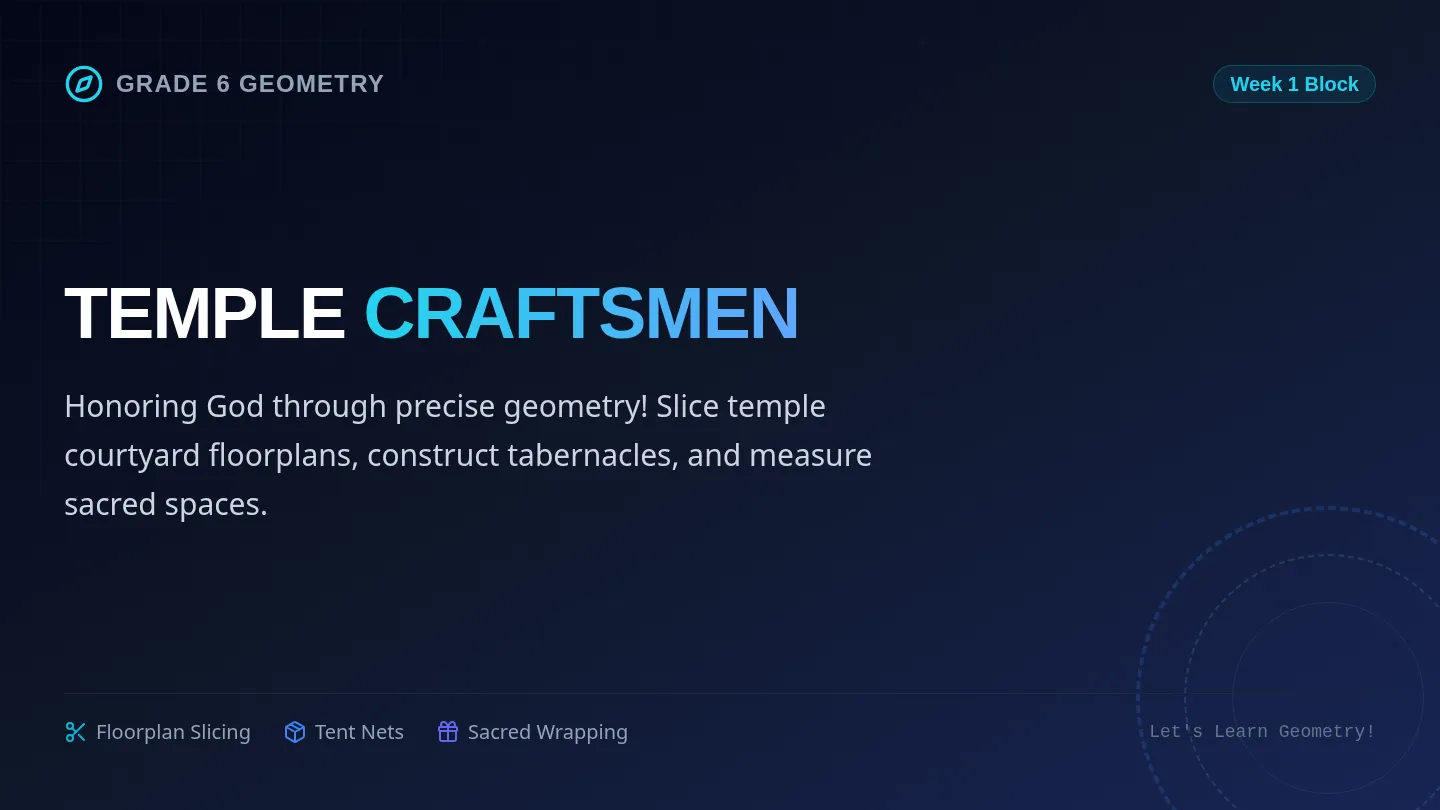
Temple Craftsmen Slides

Middle School Math Block

A multi-subject middle school mathematics block for Week 1, covering 6th Grade Geometry (Temple Craftsmen: polygon decomposition, nets, surface area) and 7th/8th Grade Math (Faithful Stewards: proportional relationships, linear equations, inequalities, transversals) from a Christian perspective.

JR

Jamens Ray II

59
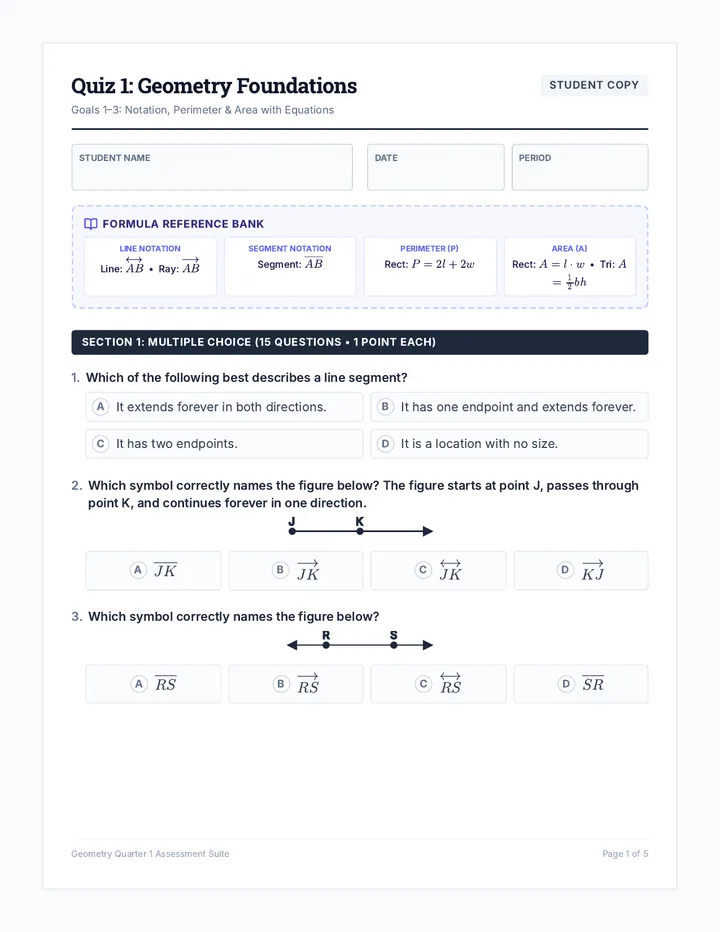
Quiz 1 Student Handout

Geometry and Statistics Assessments

Comprehensive quarterly assessment suites for high school self-contained geometry and statistics. These modules cover foundational geometric properties (lines, segments, angles) and key statistics elements (shape, center, spread, outliers, z-scores, and normal distributions).

D

david.marques

16

Lessons

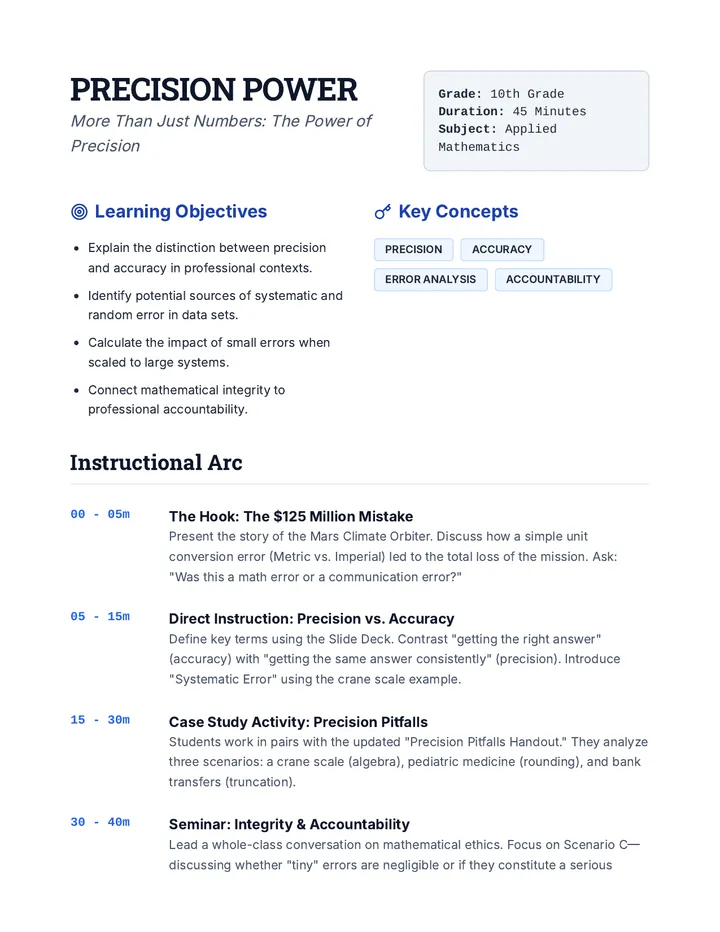
Precision Power Lesson Plan

Precision Power

A 45-minute exploration into why mathematical precision and accuracy are critical for professional success, ethical accountability, and real-world safety. Students analyze high-stakes scenarios where small errors led to significant consequences.

J

jtoomey

8
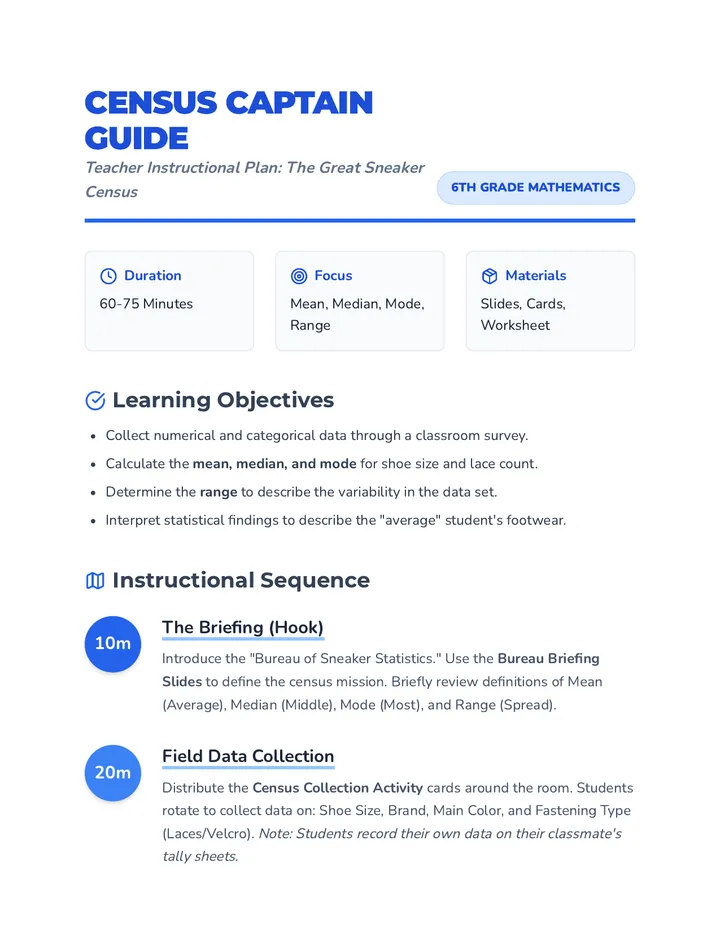
Census Captain Guide

The Great Sneaker Census

A hands-on statistics lesson where students collect and analyze footwear data from their peers to master measures of center and variability. Students act as 'Census Agents' to transform classroom trends into meaningful mathematical insights.

C

cary.stamps

5
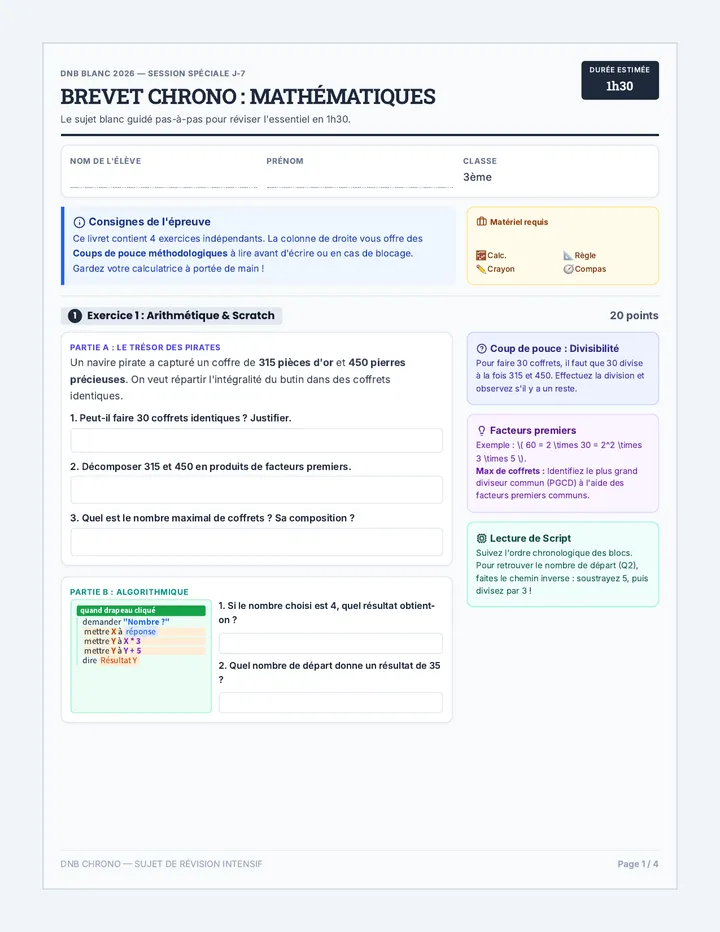
DNB Chrono Livret de Révision

Brevet Express

Un kit complet de révision de dernière minute pour le DNB de Mathématiques, comprenant un sujet blanc guidé pas-à-pas pour les élèves et un corrigé détaillé avec barème pour l'enseignant.

E

Enseignante

4
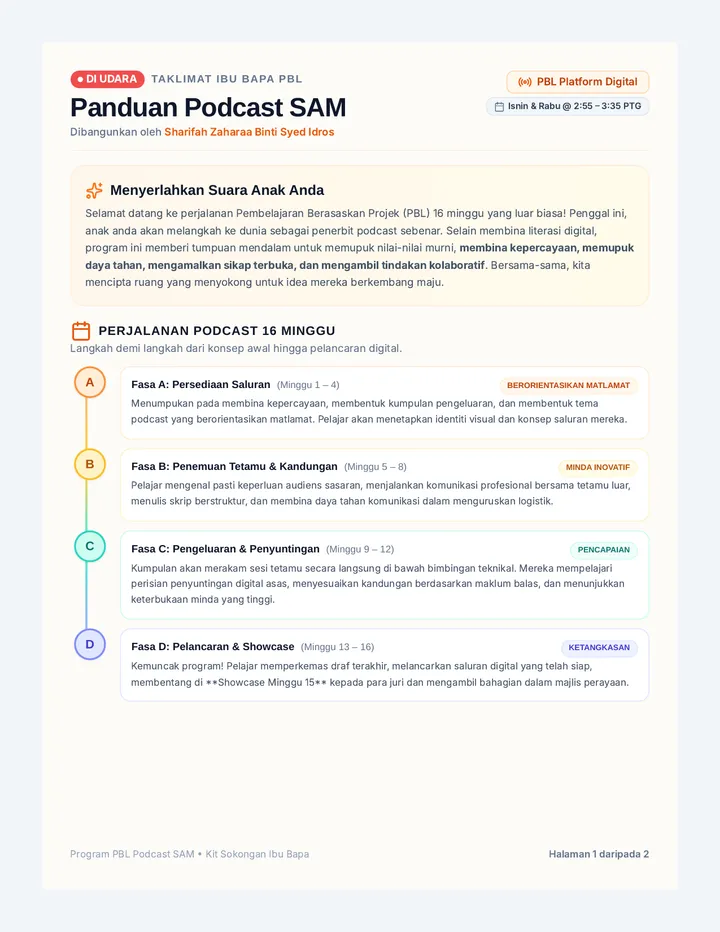
SAM Podcast Parent Briefing Guide

SAM Podcast PBL Launch

A comprehensive introductory lesson set for the SAM Podcast Project-Based Learning program. This lesson incorporates critical parent communication tools alongside specialized teacher lesson plans linking core academic subjects like KSSM Mathematics to real-world digital podcast applications.

AM

Arrthy Muthamilselvan

14
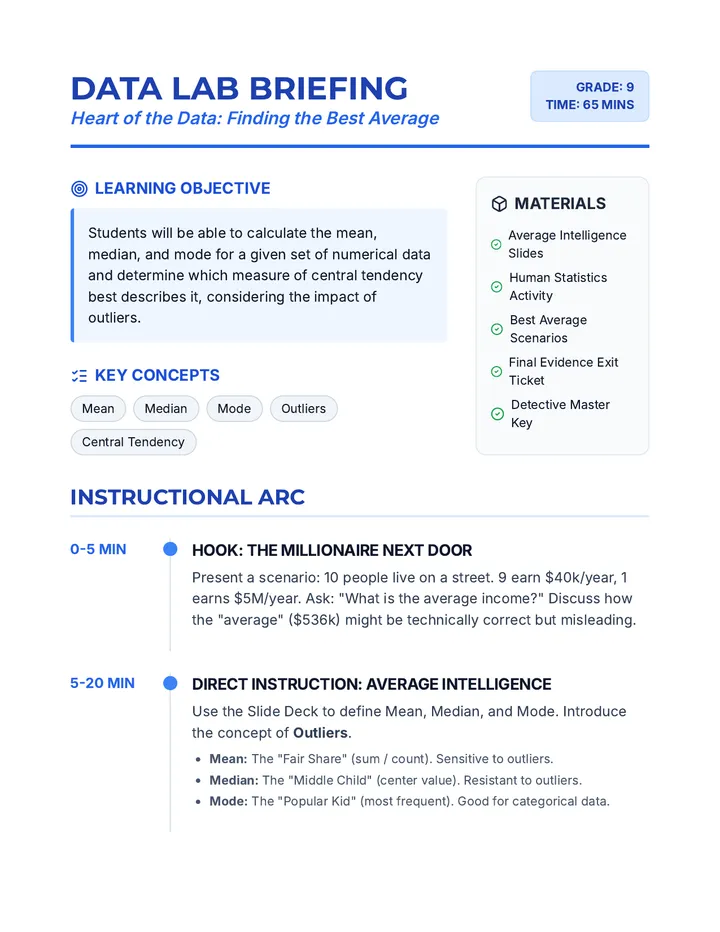
Data Lab Lesson Plan

Heart of the Data

A 9th-grade statistics lesson exploring mean, median, and mode, with a focus on identifying the most appropriate measure of central tendency in the presence of outliers. Students act as 'Data Detectives' to investigate real-world scenarios.

KC

Kris Coyne

6
Center Stage Slides

Data Detectives

A comprehensive lesson on measures of center (mean, median, mode) where students learn to summarize numerical data and find missing values using time, temperature, and group size data.

CS

Crysta Schwartz

8