Random, stratified, and cluster sampling methods for data collection and analysis. Addresses sample size determination, bias reduction, and the principles of making valid inferences about larger populations.
A formal narrative reflection essay meticulously aligned with the SEYS 776 rubric to achieve "Excellent" scores. It presents synthesized insights on research methodology, the research-practice loop, personal researcher growth, and pedagogical applications in cohesive paragraphs, incorporating specific examples and meaningful course feedback.
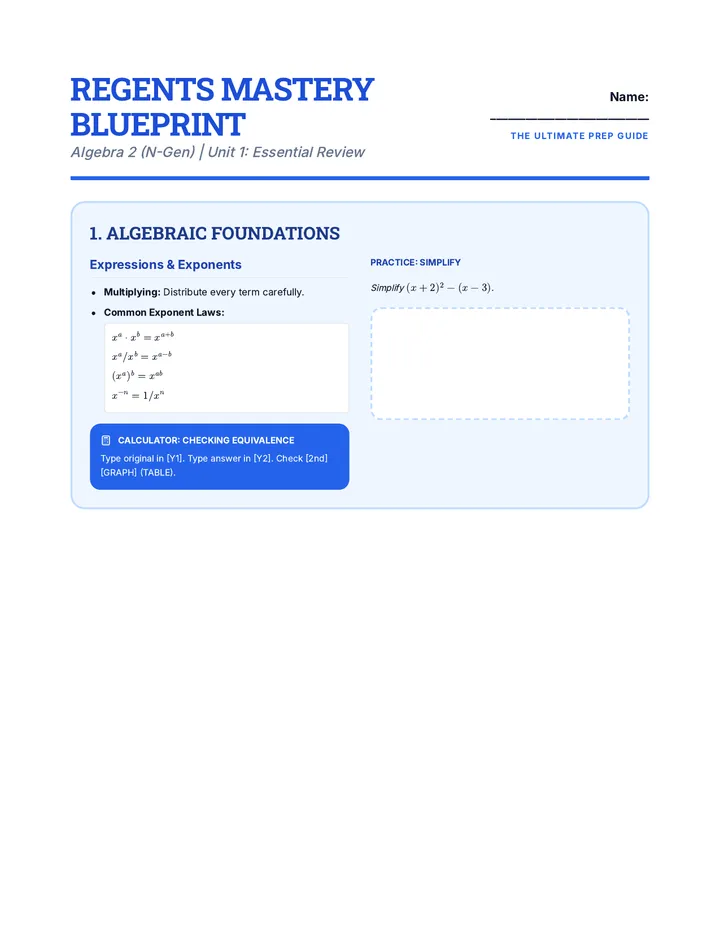
A comprehensive review suite for the New York State Mathematics Regents exams, including Algebra 1, Geometry, and Algebra 2, featuring mastery blueprints, calculator strategies, and exam-taking tips.
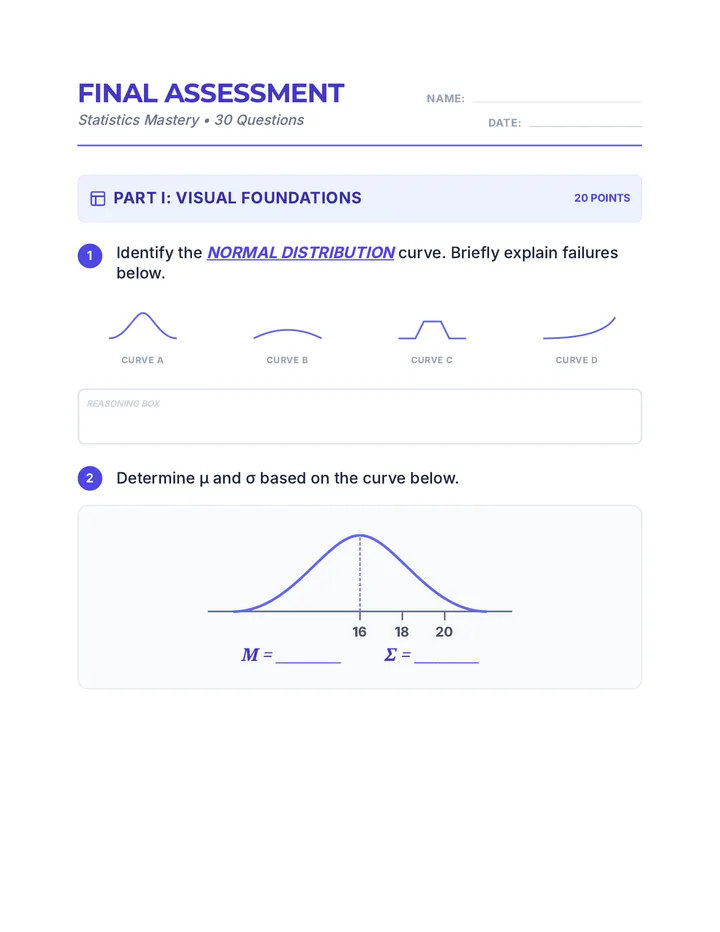
A comprehensive assessment sequence covering Normal Distributions, Z-scores, and the Central Limit Theorem.
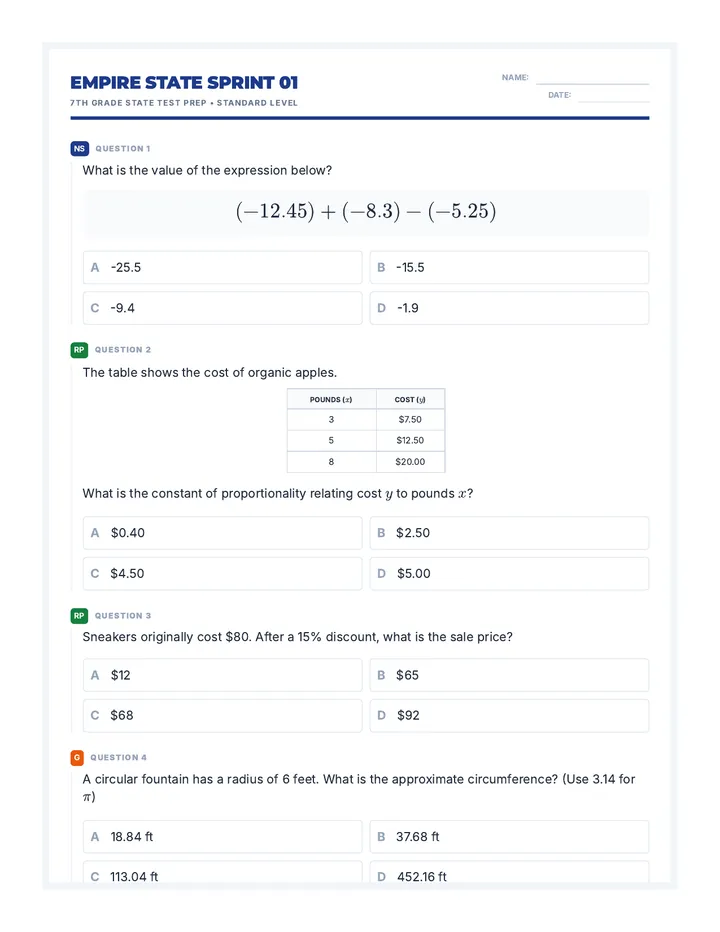
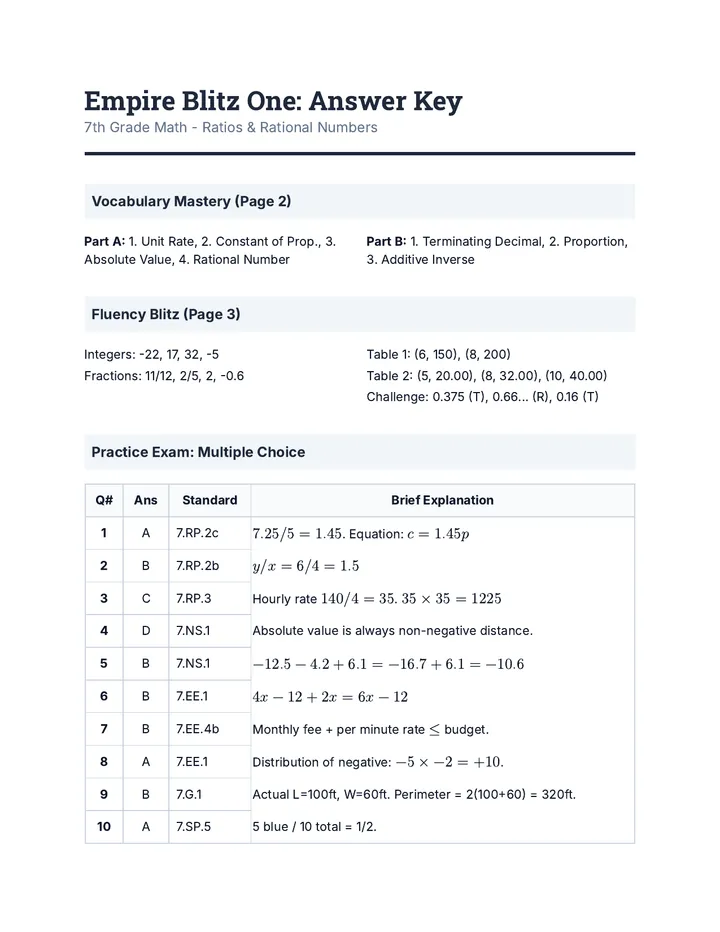
A series of four targeted homework assignments designed to prepare 7th-grade students for the New York State Mathematics Test. Each assignment covers key domains including Number Systems, Ratios and Proportions, Geometry, Statistics, and Probability in a standardized format.
A comprehensive 3-packet New York State test prep series for 7th grade math, covering all major domains including Ratios, Number Systems, Expressions, Equations, Geometry, and Statistics. Each packet includes vocabulary, fluency, guided practice, and a 15-question mock exam.
A 7-day math project where 6th-grade students use statistics and proportions to analyze school-based environmental issues and propose data-driven solutions to create change.
An interdisciplinary unit for 7th and 8th graders that transforms students into 'Data Detectives'. They learn to collect, analyze, and visualize real-world data to uncover trends and communicate findings effectively.
A 7-week math review sequence for 7th-grade students preparing for the NYS Math Assessment, covering proportional relationships, percents, algebraic expressions, inequalities, scale drawings, and statistics/probability.
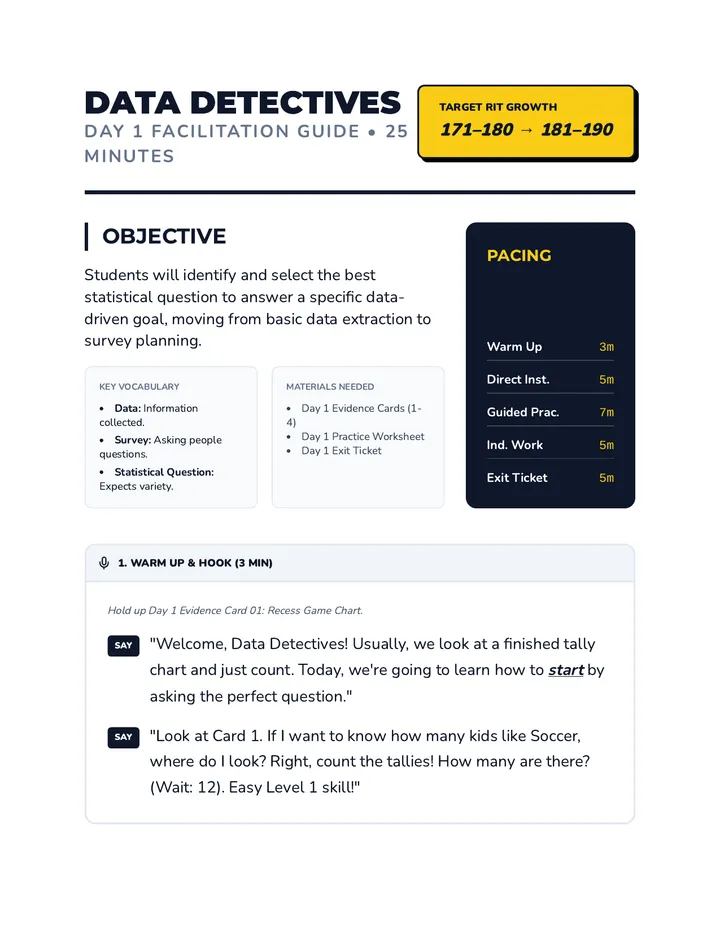
A 3-day small group intervention sequence designed to move students from RIT 171-180 to 181-190 in Data Analysis. Students progress from selecting appropriate survey questions to formulating their own and evaluating the effectiveness of data collection methods.
Une introduction complète aux statistiques universitaires, couvrant la classification des données, les mesures descriptives, la visualisation et les fondements de la loi normale. L'approche est axée sur l'analyse de données réelles et la compréhension conceptuelle.
A targeted Tier 2 intervention sequence designed to help high school students master the fundamental concepts of statistical inference, moving from population parameters to sample statistics and back again through real-world applications.
A specialized intervention sequence focused on data analysis and informal inferences, helping students bridge the gap between calculating statistics and interpreting their real-world meaning through comparative analysis.
A specialized intervention sequence focused on understanding how multiple samples provide a clearer picture of a population and how variability affects predictions. Students engage in hands-on simulations and visual data analysis to master seventh-grade sampling standards.
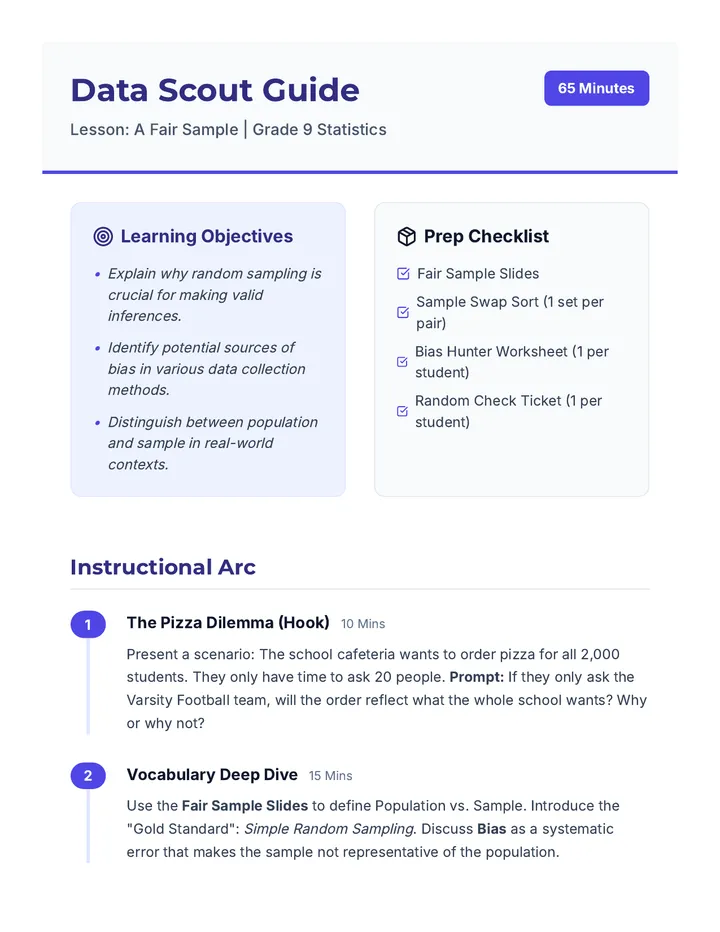
A 65-minute lesson for 9th Grade students exploring the fundamental concepts of population, sampling, and statistical bias. Students learn to distinguish between fair and biased collection methods through scenario analysis and sorting activities.
A focused practice set on calculating confidence intervals for means, finding critical values, and determining minimum sample sizes for specific margins of error.
A comprehensive 12-minute presentation and speaker notes based on research investigating the link between parental attitudes and student math outcomes.
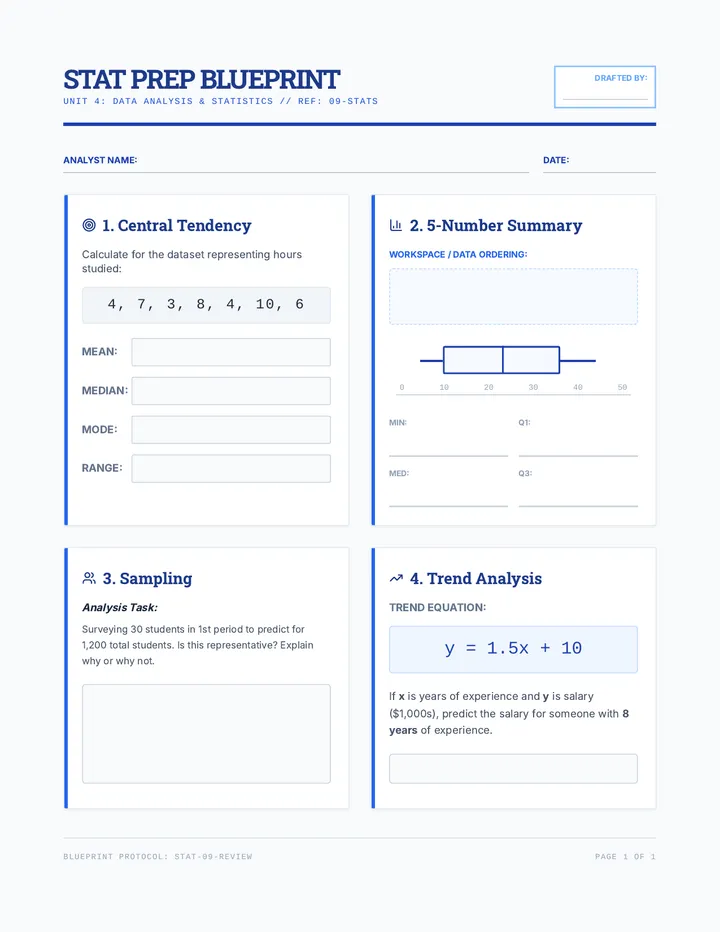
A comprehensive assessment lesson for 9th-grade statistics, covering central tendency, data visualization, sampling, and correlation through a blueprint-themed instructional arc.
A focused lesson on the binomial distribution, covering the BINS criteria, identifying parameters, and calculating probabilities using digital spreadsheet tools.
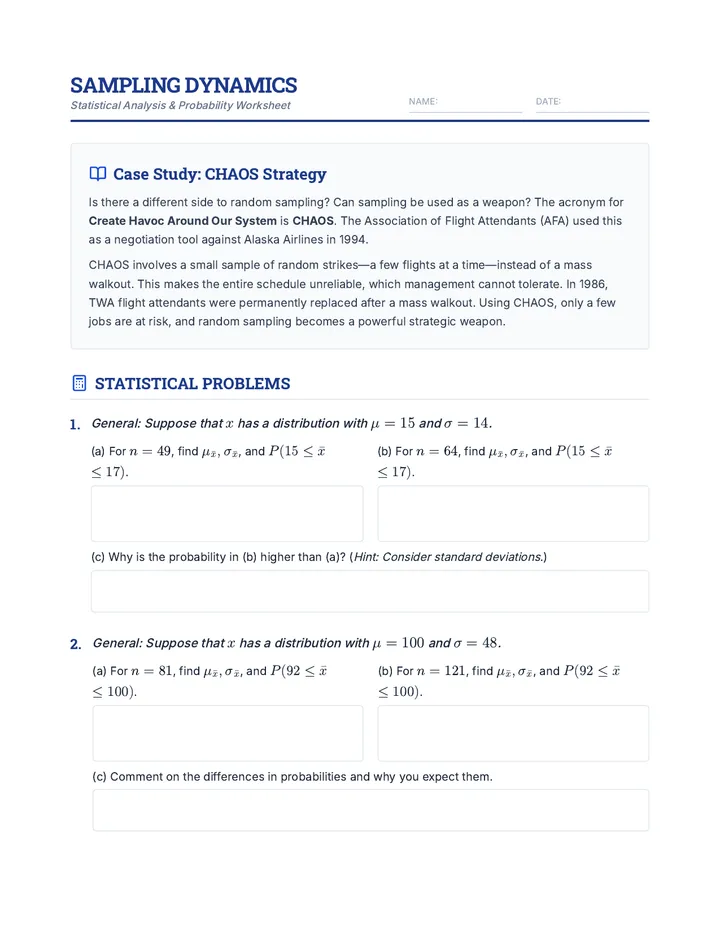
A lesson exploring sampling distributions, the Central Limit Theorem, and the real-world applications of random sampling as a strategic tool.
A comprehensive summative assessment lesson where 9th-grade students demonstrate their mathematical proficiency across algebra, geometry, and statistics before reflecting on their year-long growth.
A comprehensive assessment covering descriptive statistics, data distributions, measures of variation, and basic probability theory including tree diagrams.
A comprehensive lesson focusing on constructing and interpreting confidence intervals for population means, specifically targeting how various factors like sample size and confidence level influence the margin of error.
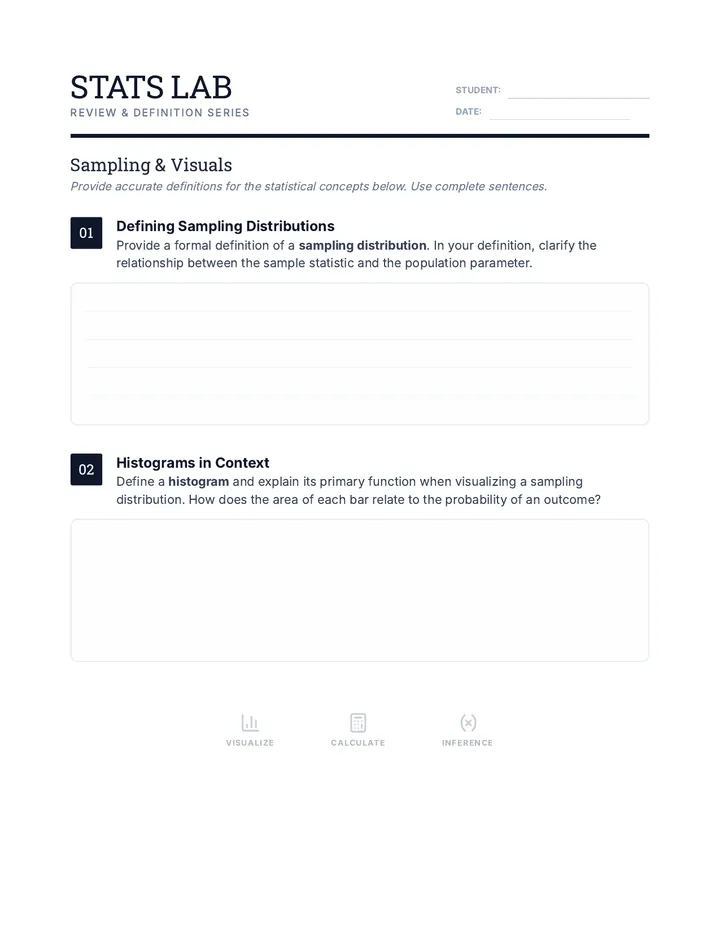
A lesson focused on fundamental statistical concepts including sampling distributions and the visual representation of data using histograms.
A comprehensive review of all 7th Grade Math TEKS reporting categories, featuring a 25-question cumulative assessment and detailed answer key.
A comprehensive lesson on interpreting circle graphs, box plots, and proportional relationships within a City Engineering context, focused on 7th grade MCAS standards.