Lenny.com
Explore
Create
ActivitiesNewMathEnglish Language ArtsScience & EngineeringSocial StudiesGlobal LanguagesHealth & Physical EducationSpecial EducationCounseling & Life SkillsArts & CreativityESL
Lenny.com
Lenny.com
Explore
Create
ActivitiesNewMathEnglish Language ArtsScience & EngineeringSocial StudiesGlobal LanguagesHealth & Physical EducationSpecial EducationCounseling & Life SkillsArts & CreativityESL
Lenny.com
Lenny.com

Solutions

Lenny for EducatorsLenny for SchoolsLenny for Districts

Product

ExploreSign inCreateSupportAbout

Resources

Getting startedMTSS Acceleration Program

© 2026 Lenny Learning Inc.

TermsPrivacyAccessibility
LinkedInInstagramX
Lenny
MathNumbers & CountingCounting ObjectsNumber NamesComparing NumbersNumber OperationsCounting SequenceNumbers 0-10Place Value Understanding and SystemAdd and Subtract Within 20Addition and Subtraction ConceptsAddition and Subtraction EquationsAddition and Subtraction ProblemsFoundations for MultiplicationMultiplication and Division PropertiesMultiply and Divide Within 100Multiplication and Division ProblemsFactors and MultiplesProperties of OperationsPatterns and RelationshipsGenerate and Analyze PatternsMulti-Digit ArithmeticPlace Value OperationsMulti-Digit and Decimal OperationsNumerical ExpressionsFour Operations and PatternsFour Operations Problem SolvingMeasurement & DataMeasurable AttributesMeasuring LengthsMeasure and Estimate Lengths in Standard UnitsRelate Addition and Subtraction to LengthClassifying and Counting ObjectsTime and MoneyArea Concepts and MeasurementPerimeter and Area MeasuresAngle Concepts and MeasurementTime, Volume, and MassMeasurement Unit ConversionsGeometryIdentifying ShapesShapes and AttributesShape Attributes and ReasoningShapes and CompositionClassifying 2D FiguresGeometric Figures and RelationshipsLines, Angles, and ShapesAngle, Area, and VolumeGeometric MeasurementVolume of 3D ShapesCoordinate Plane ApplicationsTransformations in the PlaneCongruence and SimilarityUnderstand congruence in terms of rigid motionsSimilarity and TransformationsProve Theorems Involving SimilarityPythagorean TheoremTrigonometry for General TrianglesMake Geometric ConstructionsProve Geometric TheoremsTheorems About CirclesFind Arc Lengths And Areas of Sectors of CirclesVolume FormulasRelationships Between Two-Dimensional and Three-Dimensional ObjectsProve Simple Geometric Theorems AlgebraicallyTranslate Between Geometric Description and Equation for Conic SectionApply Geometric Concepts in Modeling SituationsFractions & DecimalsFractions as NumbersBuilding FractionsFraction Equivalence and OrderingAdding and Subtracting FractionsMultiplying and Dividing FractionsDividing FractionsDecimal FractionsMulti-Digit Computation and FactorsAdd, Subtract, Multiply, and Divide Rational NumbersRational Number SystemIrrational Numbers and ApproximationsRatiosRatios and ProportionsProportional RelationshipsUnit RateAlgebraAlgebraic ExpressionsGenerate Equivalent ExpressionsQuantitative RelationshipsProportional Relationships and Linear EquationsEquations and InequalitiesEquation Solving and ReasoningLinear Equations and SystemsGraph Equations and InequalitiesSystems of EquationsReal-World Algebraic ProblemsQuantitative Reasoning with UnitsExpression StructureEquivalent Expression FormsRadicals and Integer ExponentsRational ExponentsRational and Irrational NumbersPolynomial OperationsPolynomial IdentitiesPolynomial Zeros and FactorsRational ExpressionsComplex Number OperationsComplex Numbers in PolynomialsComplex Numbers on PlaneStatistics & ProbabilityRepresent and Interpret DataData DistributionsStatistical VariabilityProbability ModelsCompound Event ProbabilitiesStatistical SamplingInterpret Categorical and Quantitative DataBivariate Data PatternsInterpret Linear ModelsComparing Two PopulationsRandom Processes in StatisticsIndependence and Conditional ProbabilityExpected ValuesProbability-Based Decision MakingStatistical Inference and ConclusionsFunctionsFunction Concepts and NotationDefine and Compare FunctionsInterpret Functions in ContextAnalyze Function RepresentationsModel Relationships with FunctionsIdentify Linear vs Exponential GrowthDistinguish Between Function TypesCompare Growth RatesInterpret Function ExpressionsBuild Functions from RelationshipsConstruct and Model FunctionsTransform and Combine FunctionsModel Comparison and SelectionSolve Exponential EquationsTrigonometryTrigonometric Ratios Involving Right TrianglesTrigonometric Functions and Unit CircleModel with Trigonometric FunctionsTrigonometric IdentitiesVectors & MatricesIntroduction to Vectors and MatricesVector QuantitiesVector OperationsMatrix OperationsCalculusLimits and ContinuityDerivative Concepts and NotationDerivative Rules and TechniquesApplications of DerivativesOptimization ProblemsRelated RatesCurve Sketching and AnalysisIntegration Concepts and NotationAntiderivatives and Indefinite IntegralsDefinite Integrals and AreaFundamental Theorem of CalculusIntegration TechniquesApplications of IntegrationDifferential EquationsSequences and SeriesParametric and Polar FunctionsVector-Valued Functions

Statistics Mastery

A comprehensive assessment sequence covering Normal Distributions, Z-scores, and the Central Limit Theorem.

ACAnjoe Calamba
Normal Distribution and CLT Assessment

A summative assessment lesson focusing on visual foundations, probability calculations, and the application of the Central Limit Theorem to sampling distributions.

Statistics Mastery

A comprehensive assessment sequence covering Normal Distributions, Z-scores, and the Central Limit Theorem.

ACAnjoe Calamba

B. Yes, z ≈ -3.07

C. No, within 1 SD

D. Yes, weight < 20kg

12

Find raw value x for z = -1.12 (μ=4400, σ=620).

3705.6

5094.4

4400.0

3120.2

Work Area

13

Count 9,000 (μ=7500, σ=1750). Find z.

z = 0.86

z = 1.15

z = -0.86

z = 1.50

Work

14

z = -2.25 (μ=4.8, σ=0.3). Interpretation?

A. Extremely close to average

B. 2.25 mil higher than avg

C. Unusually low count

D. Non-normal distribution

Part IV: Probability Calculations

15

Assume x normal (\(\mu=4, \sigma=2\)). Find \(P(3 \le x \le 6)\).

0.1915

0.3413

0.5328

0.6915

Work Area

16

Find z for 5% area right.

-1.645

1.645

1.960

2.326

17

Find z for middle 95%.

1.282

1.645

1.960

2.576

18

Healthy adults porphyrin (μ=38, σ=12). Find \(P(x < 60)\). Note: P(z ≤ 1.83) = 0.9664

0.0336

0.4664

0.9332

0.9664

Calculation Zone

Part V: Theory & Concepts

19 Sampling Distribution Definition

20 Histogram Purpose in CLT

Part VI: Sampling Applications

21

Heights normal (μ=68, σ=3). If one man is selected, find \(P(67 < x < 69)\).

P(z ≤ 0.33) = 0.6293 | P(z ≤ -0.33) = 0.3707

Calculation Area

0.2586

0.6293

0.3413

0.5000

22

Sample n = 9 men. Find \(P(67 < \bar{x} < 69)\).

P(z ≤ 1.00) = 0.8413 | P(z ≤ -1.00) = 0.1587

Calculation Area

0.3413

0.6826

0.9544

0.4772

23

Glucose μ=85, σ=25. Standard Error for n=2?

25.00

17.68

12.50

5.59

Work

24

WBC μ=7500, σ=1750. \(P(\text{single } x < 3500)\)?

0.0110

0.9890

0.0985

0.1750

Work

25

Doe weights μ=63, σ=7.1. Probability one doe is < 54kg?

P(z ≤ -1.27) = 0.1020

Calculation Work

0.8980

0.1020

0.3936

0.0510

26

Incubation μ=16, σ=2. Find Standard Error (\(\sigma_{\bar{x}}\)) for n = 30 eggs.

2.000 d

0.365 d

0.067 d

1.095 d

Work Area

27

Returns μ=1.6%, σ=0.9%. Prob avg return n=24 months is 1% to 2%?

P(z ≤ 2.18) = 0.9854
P(z ≤ -3.27) = 0.0005

Work Area

0.9849

0.9995

0.0145

0.5000

Part VII: Inverse Normal (z to x)

28

A test has mean \(\mu = 100\) and \(\sigma = 15\). If a student has a z-score of 2.00, what was their raw score x?

A. 115

B. 130

C. 145

D. 100

Show Your Work Below

29

A factory package has mean weight \(\mu = 500\text{g}\) and \(\sigma = 20\text{g}\). Find raw weight x if z = -1.50.

A. 470g

B. 485g

C. 530g

D. 480g

Show Your Work Below

30

Temperature follows \(\mu = 70^\circ\) and \(\sigma = 4^\circ\). What is actual temp x for a z-score of 0.75?

A. 73.0°

B. 74.0°

C. 71.5°

D. 76.0°

Show Your Work Below

End of Comprehensive Statistics Assessment • 2026

D. Yes, weight < 20kg

12

Find raw value x for z = -1.12 (μ=4400, σ=620).

3705.6

5094.4

4400.0

3120.2

Work

13

Count 9,000 (μ=7500, σ=1750). What is z?

z = 0.86

z = 1.15

z = -0.86

z = 1.50

14

z = -2.25 (μ=4.8, σ=0.3). Interpretation?

A. Extremely close to average

B. 2.25 mil higher than avg

C. Unusually low count

D. Non-normal distribution

Part IV: Probability Calculations

15

Assume x normal (\(\mu=4, \sigma=2\)). Find \(P(3 \le x \le 6)\).

0.1915

0.3413

0.5328

0.6915

Work Area

16

Find z for 5% area to the right.

-1.645

1.645

1.960

2.326

17

Find z for middle 95%.

1.282

1.645

1.960

2.576

18

Healthy adults porphyrin (μ=38, σ=12). Probability adult is under 60? Note: P(z ≤ 1.83) = 0.9664

0.0336

0.4664

0.9332

0.9664

Calculation Area

Part V: Theory & Concepts

19 Sampling Dist Def.

20 Histogram Purpose

Part VI: Sampling Applications

21

Heights normal (μ=68, σ=3). If one man is selected, find \(P(67 < x < 69)\).

P(z ≤ 0.33) = 0.6293 | P(z ≤ -0.33) = 0.3707

Work Area

0.2586

0.6293

0.3413

0.5000

22

Sample n = 9 men. Find \(P(67 < \bar{x} < 69)\).

P(z ≤ 1.00) = 0.8413 | P(z ≤ -1.00) = 0.1587

Work Area

0.3413

0.6826

0.9544

0.4772

23

Glucose μ=85, σ=25. SE for n=2?

25.00

17.68

12.50

5.59

Work Area

24

WBC μ=7500, σ=1750. \(P(\text{single } x < 3500)\)?

0.0110

0.9890

0.0985

0.1750

Work Area

25

Doe weights μ=63, σ=7.1. Probability single doe is < 54kg?

P(z ≤ -1.27) = 0.1020

Calculation Work

0.8980

0.1020

0.3936

0.0510

26

Incubation μ=16, σ=2. Standard Error for n = 30 eggs.

2.000 d

0.365 d

0.067 d

1.095 d

Work Area

27

Returns μ=1.6%, σ=0.9%. Prob avg return n=24 months is 1% to 2%?

P(z ≤ 2.18) = 0.9854 | P(z ≤ -3.27) = 0.0005

Work Area

0.9849

0.9995

0.0145

0.5000

Part VII: Inverse Normal (z to x)

28

A test has mean μ = 100 and σ = 15. If a student has a z-score of 2.00, what was their raw score x?

115

130

145

100

Show Your Work Below

29

A factory package has mean weight μ = 500g and σ = 20g. Find raw weight x if z = -1.50.

470g

485g

530g

480g

Show Your Work Below

30

Temperature follows μ = 70° and σ = 4°. What is actual temp x for a z-score of 0.75?

73.0°

74.0°

71.5°

76.0°

Show Your Work Below

End of Comprehensive Statistics Assessment • 2026

A. Close to avg

B. 2.25 mil higher

C. Unusually low

D. Non-normal

Part IV: Probability Calculations

15

x normal (μ=4, σ=2). Find P(3 ≤ x ≤ 6).

0.1915

0.3413

0.5328

0.6915

Calculation Zone

16

z for 5% area to right?

1.645

-1.645

1.960

2.326

17

z for middle 95%?

1.960

2.576

1.645

1.282

18

Porphyrin (μ=38, σ=12). Adult under 60? P(z ≤ 1.83) = .9664

0.0336

0.4664

0.9332

0.9664

Calculation Zone

Part V: Theory & Concepts

19 Sampling Distribution Def.

20 Histogram Purpose

Part VI: Sampling Applications

40 Points

21

Heights normal (μ=68, σ=3). If selected one man, P(67 < x < 69)?

P(z ≤ 0.33) = 0.6293 | P(z ≤ -0.33) = 0.3707

0.2586

0.6293

Calculation Zone

22

Sample n = 9 men. What is P(67 < x-bar < 69)?

P(z ≤ 1.00) = 0.8413 | P(z ≤ -1.00) = 0.1587

0.3413

0.6826

Calculation Zone

23

Glucose μ=85, σ=25. SE for n=2?

17.68

25.00

12.50

5.59

Work Area

24

WBC μ=7500, σ=1750. P(x < 3500)?

z = -2.29, P = .0110

0.0110

0.0985

Work Area

25

Doe weights μ=63, σ=7.1. P(single doe < 54kg)?

P(z ≤ -1.27) = 0.1020

0.8980

0.1020

Calculation Zone

26

Incubation μ=16, σ=2. Find Standard Error for n = 30 eggs.

2.000 d

0.365 d

0.067 d

1.095 d

Calculation Zone

27

Returns μ=1.6%, σ=0.9%. P(avg n=24 between 1% and 2%)?

P(z ≤ 2.18) = .9854 | P(z ≤ -3.27) = .0005

0.9849

0.9995

0.0145

0.5000

Calculation Zone

Part VII: Inverse Normal Calculations

28

A test has μ=500, σ=100. Student z-score = 1.45. Find x.

545

645

455

655

Calculation Zone

29

Liquid μ=500 mL, σ=5 mL. Bottle has z-score = -1.80. Volume?

491

495

505

509

Calculation Zone

30

Sample n=16, μ=400, σ=8. Find x-bar for z-score = -2.50.

380

395

405

420

Calculation Zone

End of Comprehensive Assessment • 2026

0.86

1.15

-0.86

1.50

z = -2.25 (μ=4.8, σ=0.3).

A. Close to average

B. 2.25 mil higher

C. Unusually low

D. Non-normal

Part IV: Probability Calculations

15

x normal (μ=4, σ=2). Find P(3 ≤ x ≤ 6).

0.1915

0.3413

0.5328

0.6915

Calculation Zone

16

z for 5% area to right?

1.645

-1.645

1.960

2.326

17

z for middle 95%?

1.960

2.576

1.645

1.282

18

Porphyrin (μ=38, σ=12). Adult under 60? P(z ≤ 1.83) = .9664

0.0336

0.4664

0.9332

0.9664

Work Area

Part V: Theory & Concepts

19 Sampling Distribution Def.

20 Histogram Purpose

Part VI: Sampling Applications

40 Points

21

Heights normal (μ=68, σ=3). selected one man, P(67 < x < 69)?

P(z ≤ 0.33) = 0.6293 | P(z ≤ -0.33) = 0.3707

0.2586

0.6293

Calculation Zone

22

Sample n=9 men. P(67 < x-bar < 69)?

P(z ≤ 1.00) = 0.8413 | P(z ≤ -1.00) = 0.1587

0.3413

0.6826

Calculation Zone

Glucose μ=85, σ=25. SE for n=2?

17.68

25.00

Work Area

WBC μ=7500, σ=1750. P(x < 3500)?

z = -2.29

0.0110

0.0985

Work Area

25

Deer weights μ=63, σ=7.1. P(doe < 54 kg)?

P(z ≤ -1.27) = 0.1020

0.8980

0.1020

Work Area

26

Incubation μ=16, σ=2. SE for n=30 eggs.

2.000 d

0.365 d

0.067 d

1.095 d

Work Area

27

Returns μ=1.6%, σ=0.9%. P(avg n=24 is 1-2%)?

P(z ≤ 2.18) = .9854 | P(z ≤ -3.27) = .0005

0.9849

0.9995

0.0145

0.5000

Work Area

Part VII: Inverse Normal Calculations

28

A test has μ=500 and σ=100. If a student's score results in a z-score of z = 1.45, what was their actual score?

A. 545

B. 645

C. 455

D. 655

Calculation Area

29

Liquid fill amounts have μ=500 mL and σ=5 mL. A bottle is found with a z-score of z = -1.80. Find the volume.

A. 491 mL

B. 495 mL

C. 505 mL

D. 509 mL

Calculation Area

30

A sample of n=16 is taken from a population with μ=400 and σ=8. Find the sample mean if its z-score is z = -2.50.

A. 380

B. 395

C. 405

D. 420

Calculation Area

End of Comprehensive Assessment • Statistics Mastery • 2026
C. No, within 1 SD

D. Yes, weight < 20kg

12

Find raw value x for z = -1.12 (μ=4400, σ=620).

3705.6

5094.4

4400.0

3120.2

Work Area

13

Count 9,000 (μ=7500, σ=1750). What is z?

z = 0.86

z = 1.15

z = -0.86

z = 1.50

14

z = -2.25 (μ=4.8, σ=0.3). Interpretation?

A. Extremely close to average

B. 2.25 mil higher than avg

C. Unusually low count

D. Non-normal distribution

Part IV: Probability Calculations

15

Assume x normal (\(\mu=4, \sigma=2\)). Find \(P(3 \le x \le 6)\).

0.1915

0.3413

0.5328

0.6915

Work Area

16

Find z for 5% area to the right.

z = -1.645

z = 1.645

z = 1.960

z = 2.326

17

Find z for middle 95% of curve area.

z = 1.282

z = 1.645

z = 1.960

z = 2.576

18

Healthy adults porphyrin (μ=38, σ=12). Probability adult is under 60? Note: P(z ≤ 1.83) = 0.9664

0.0336

0.4664

0.9332

0.9664

Work

Part V: Theory & Concepts

19 Sampling Distribution Definition

20 Histogram Purpose in CLT

Part VI: Sampling Applications

21

Heights normal (μ=68, σ=3). If one man is selected, find \(P(67 < x < 69)\).

P(z ≤ 0.33) = 0.6293 | P(z ≤ -0.33) = 0.3707

Work Area

0.2586

0.6293

0.3413

0.5000

22

Sample n = 9 men. Find \(P(67 < \bar{x} < 69)\).

P(z ≤ 1.00) = 0.8413 | P(z ≤ -1.00) = 0.1587

Work Area

0.3413

0.6826

0.9544

0.4772

23

Glucose μ=85, σ=25. SE for n=2?

25.00

17.68

12.50

5.59

Work

24

WBC μ=7500, σ=1750. P(single x < 3500)?

0.0110

0.9890

0.0985

0.1750

Work

25

Doe weights μ=63, σ=7.1. Probability one doe is < 54kg?

P(z ≤ -1.27) = 0.1020

Work Area

0.8980

0.1020

0.3936

0.0510

26

Incubation μ=16, σ=2. Calculate Standard Error for n=30 eggs.

2.000 d

0.365 d

0.067 d

1.095 d

Work Area

27

Returns μ=1.6%, σ=0.9%. Prob avg return n=24 is 1% to 2%?

P(z ≤ 2.18) = 0.9854 | P(z ≤ -3.27) = 0.0005

Work Area

0.9849

0.9995

0.0145

0.5000

Part VII: Inverse Normal (z to x)

28

Test score \(\mu = 100\), \(\sigma = 15\). Find score \(x\) for z = 2.00.

115

130

145

100

Work Area

29

Package weight \(\mu = 500\text{g}\), \(\sigma = 20\text{g}\). Find \(x\) for z = -1.50.

470g

485g

530g

480g

Work Area

30

Temp \(\mu=70^\circ\), \(\sigma=4^\circ\). Find actual temp \(x\) for z = 0.75.

73.0°

74.0°

71.5°

76.0°

Work Area

End of Comprehensive Assessment • Statistics Mastery • 2026
12

Find raw value x for z = -1.12 (μ=4400, σ=620).

3705.6

5094.4

4400.0

3120.2

Work Area

13

Count 9,000 (μ=7500, σ=1750). What is z?

z = 0.86

z = 1.15

z = -0.86

z = 1.50

14

z = -2.25 (μ=4.8, σ=0.3). Interpretation?

A. Extremely close to average

B. 2.25 mil higher than avg

C. Unusually low count

D. Non-normal distribution

Part IV: Probability Calculations

15

Assume x normal (μ=4, σ=2). Find \(P(3 \le x \le 6)\).

0.1915

0.3413

0.5328

0.6915

Work Area

16

Find z for 5% area to the right.

z = -1.645

z = 1.645

z = 1.960

z = 2.326

17

Find z for middle 95% of curve area.

z = 1.282

z = 1.645

z = 1.960

z = 2.576

18

Healthy adults porphyrin (μ=38, σ=12). Probability adult is under 60? Note: P(z ≤ 1.83) = 0.9664

0.0336

0.4664

0.9332

0.9664

Calculation Area

Part V: Theory & Concepts

19 Sampling Dist Definition

20 Histogram Purpose in CLT

Part VI: Sampling Applications

21

Heights normal (μ=68, σ=3). If one man is selected, find \(P(67 < x < 69)\).

P(z ≤ 0.33) = 0.6293 | P(z ≤ -0.33) = 0.3707

Work Area

0.2586

0.6293

0.3413

0.5000

22

Sample n = 9 men. Find \(P(67 < \bar{x} < 69)\).

P(z ≤ 1.00) = 0.8413 | P(z ≤ -1.00) = 0.1587

Work Area

0.3413

0.6826

0.9544

0.4772

23

Glucose μ=85, σ=25. SE for n=2?

25.00

17.68

12.50

5.59

Work Area

24

WBC μ=7500, σ=1750. P(single x < 3500)?

0.0110

0.9890

0.0985

0.1750

Work Area

25

Doe weights μ=63, σ=7.1. Probability one doe is < 54kg?

P(z ≤ -1.27) = 0.1020

Calculation Work

0.8980

0.1020

0.3936

0.0510

26

Incubation μ=16, σ=2. Calculate Standard Error for n=30 eggs.

2.000 d

0.365 d

0.067 d

1.095 d

Work Area

27

Returns μ=1.6%, σ=0.9%. Prob avg return n=24 is 1% to 2%?

P(z ≤ 2.18) = 0.9854
P(z ≤ -3.27) = 0.0005

Calculation Work

0.9849

0.9995

0.0145

0.5000

Part VII: Inverse Normal (z to x)

28

Test score μ = 100, σ = 15. Find score x for z = 2.00.

115

130

145

100

Work Area

29

Package μ = 500g, σ = 20g. Find x for z = -1.50.

470g

485g

530g

480g

Work Area

30

Temp μ=70°, σ=4°. Find raw temp x for z = 0.75.

73.0°

74.0°

71.5°

76.0°

Work Area

End of Comprehensive Assessment • Statistics Mastery • 2026
You might also like

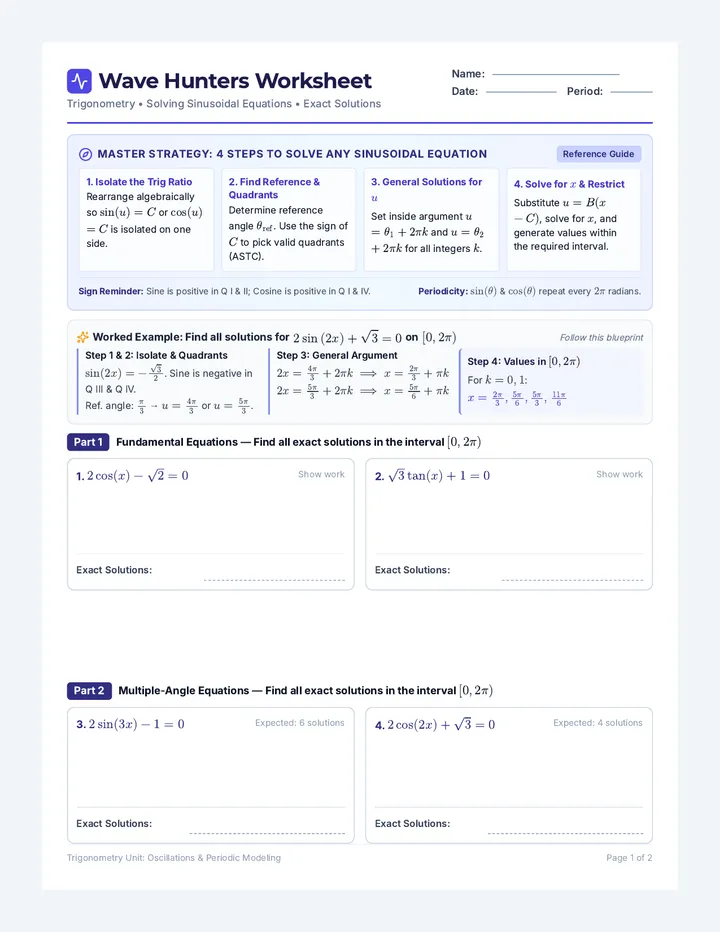
Wave Hunters Worksheet

Math and Economics

A secondary curriculum sequence covering advanced mathematical modeling alongside foundational economic systems and financial literacy concepts.

JT

Jasia Tahir

4
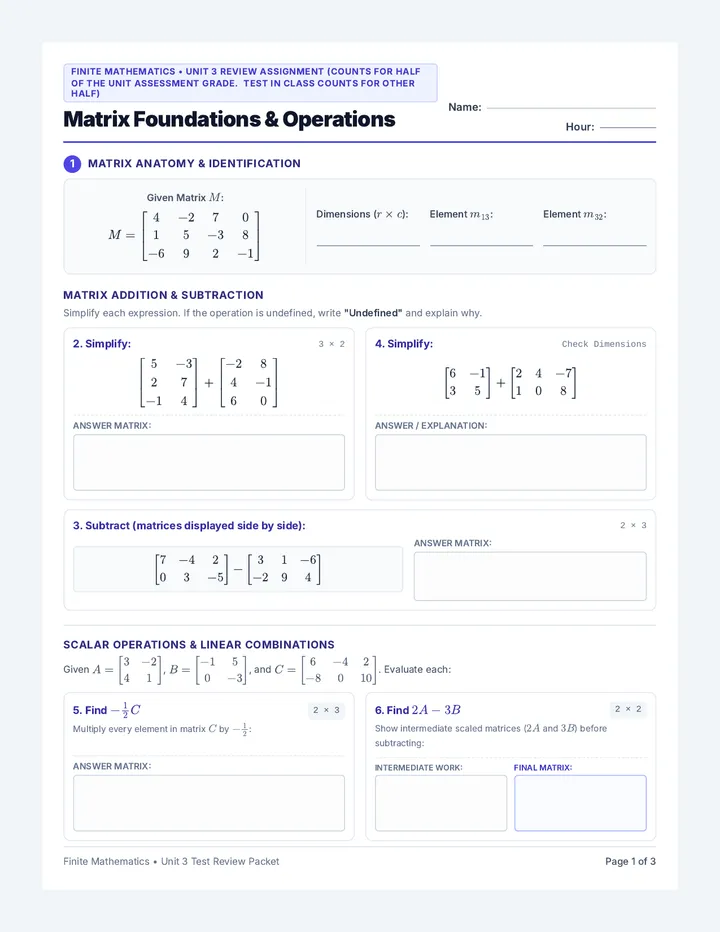
Matrix Systems Review Worksheet

Matrix Mastery

A high school finite mathematics unit review introducing matrix anatomy, operations, matrix multiplication, linear systems solved by graphing and elimination, and augmented matrices with calculator-based RREF applications.

RB

Ronald Berg

2
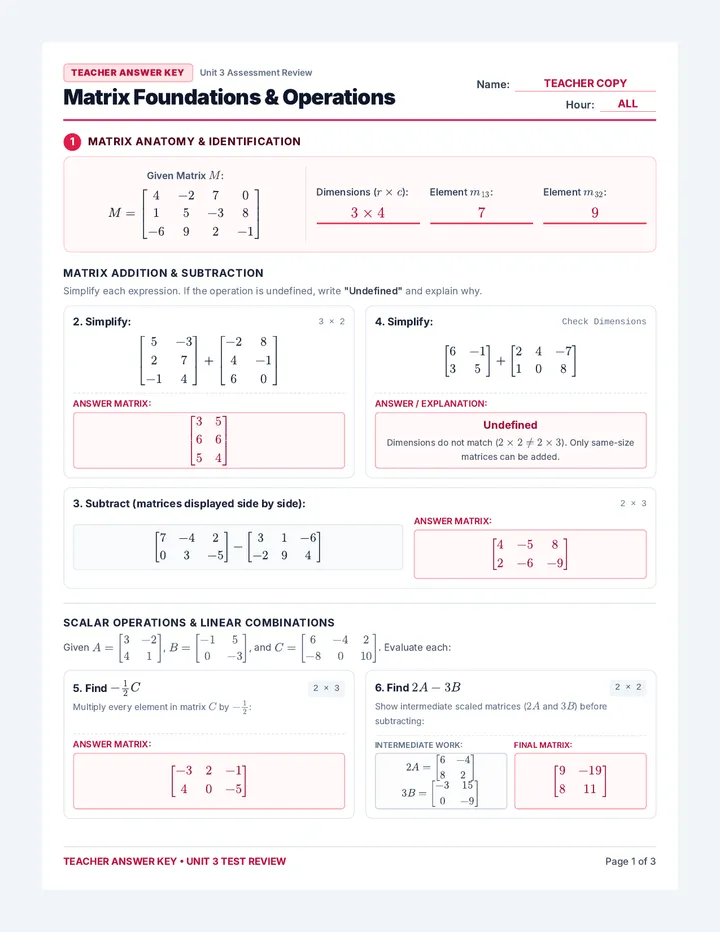
Matrix Systems Answer Key

Matrix Systems Answer Key

Teacher answer key for the 3-page Matrix Systems Review Worksheet, providing complete step-by-step solutions, intermediate matrix calculations, plotted graphing lines with coordinates, RREF output matrices, and final solutions for all 14 problems.

RB

Ronald Berg

Integer Addition Blueprint Notes Sheet

Integer Operations Mastery

A comprehensive 9th-grade algebra readiness sequence covering addition with regrouping and conceptual integer multiplication through skip counting and repeated addition.

S

Shannon

3
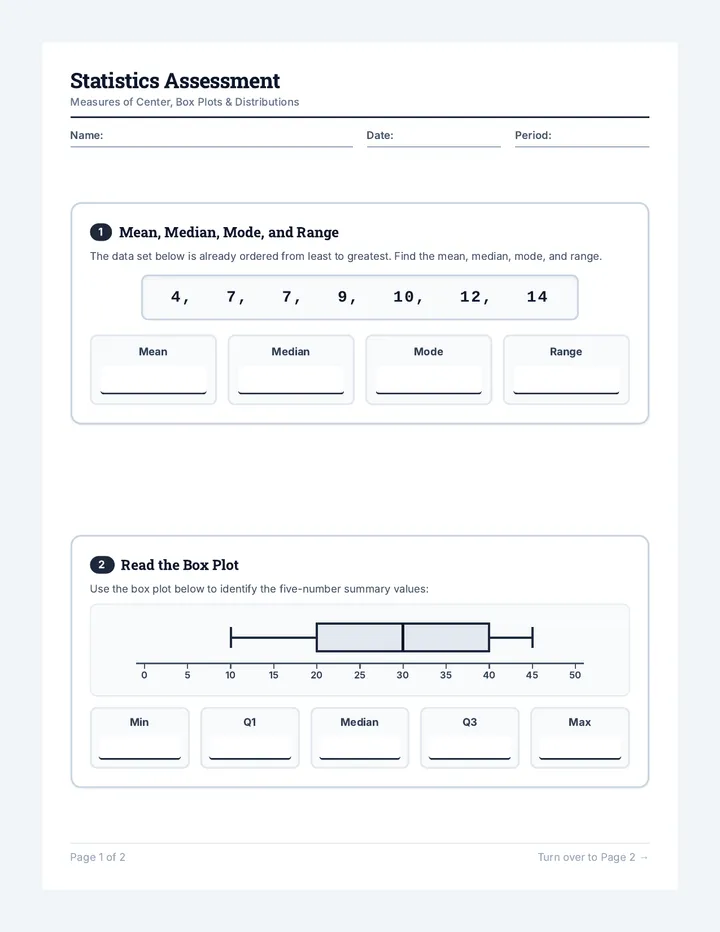
Data Detective Assessment

Statistics Foundations

A foundational statistics lesson focusing on calculating measures of center and spread, constructing and interpreting box plots, and recognizing distribution shapes.

CF

Chad Forde

2
Matrix Systems Review Worksheet

Matrix Systems Review Worksheet

A streamlined 3-page test review assignment worksheet for high school finite mathematics covering matrix features, operations, multiplication, systems by graphing and elimination, augmented matrices with RREF technology, and an applied word problem. Page 1 header updated to remove the Date field and provide an extended Name line with a dedicated Hour line.

RB

Ronald Berg

Graph Steepness Slides

Rise and Run

A hands-on, two-part unit exploring slope as a rate of change, visual steepness on coordinate planes, and algebraic calculations using coordinate pairs. Students transition smoothly from counting rise and run on graphs to mastering the slope formula in real-world contexts.

K

kstanfield

6
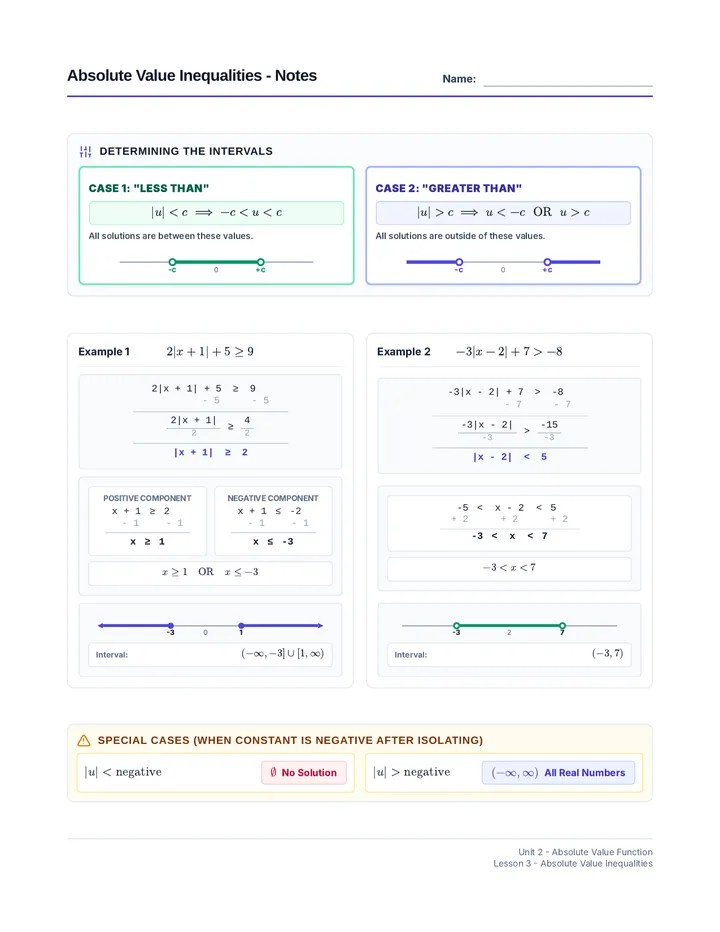
Absolute Value Inequalities Notes

Absolute Value Inequalities

A focused lesson on solving and graphing absolute value inequalities. Students explore distance-based conceptual representations, algebraic isolation techniques, compound inequality splits, and interval notation.

MA

Mary Ann Valiente

4
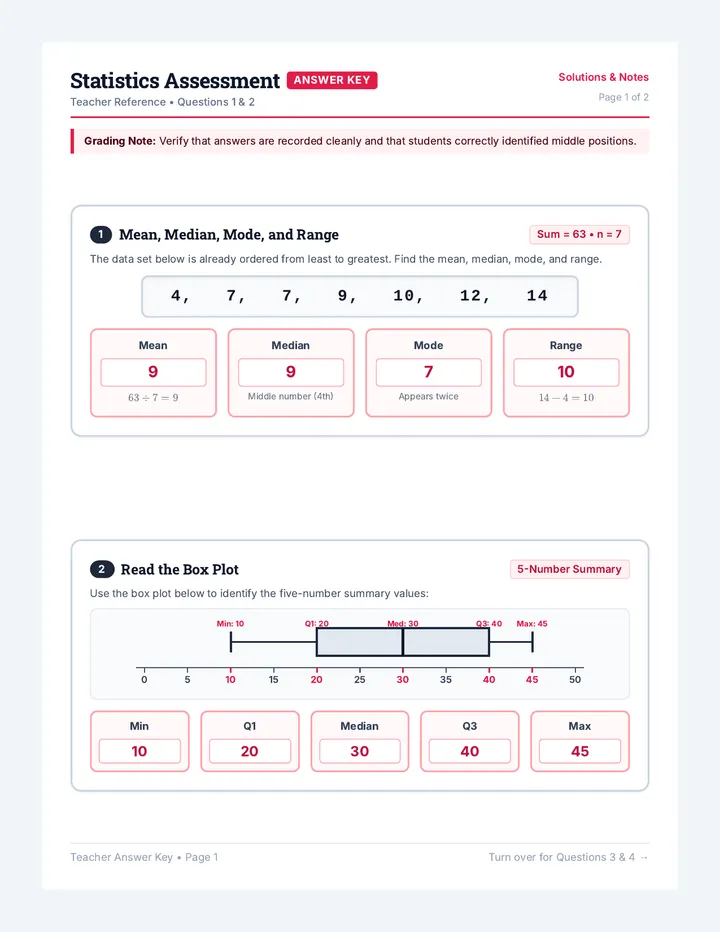
Data Detective Answer Key

Data Detective Answer Key

A complete two-page teacher answer key for the Data Detective Assessment with all solutions, calculations, and the completed box plot.

CF

Chad Forde

Circle Dynamics Lesson Plan

Trig Arc

A complete 10-day Precalculus trigonometry unit for 12th grade spanning two weeks of daily classes, covering radian foundations, unit circle values, sinusoidal graphs and transformations, periodic modeling, analytical identities, and equation solving.

JT

Jasia Tahir

24
Graph Detectives Practice Worksheet

Graph Detectives

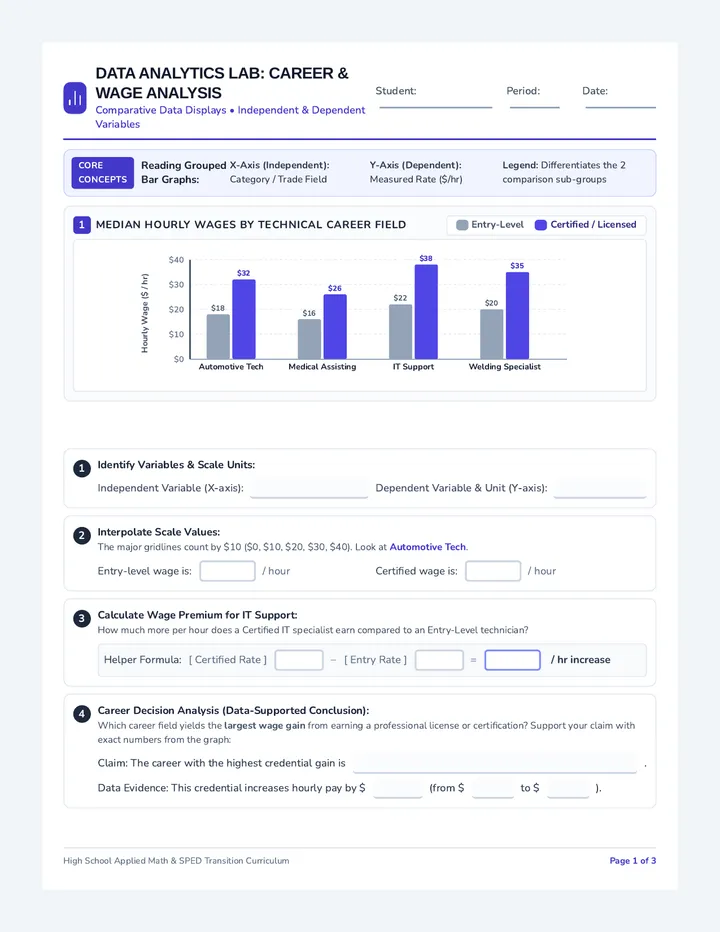
A high school special education math lesson focused on mastering real-world data literacy, including grouped career bar graphs, independent living circle graphs, and business break-even line graphs.

T

timothy.nixon

2
Data Detective Assessment

Data Detective Assessment

A simple, clean four-question, two-page statistics assessment covering mean, median, mode, and range; reading a box plot; creating a box plot from ordered data; and identifying distribution shapes.

CF

Chad Forde