Students use T-charts and Venn diagrams to compare and contrast concepts, organizing data for clearer analysis.
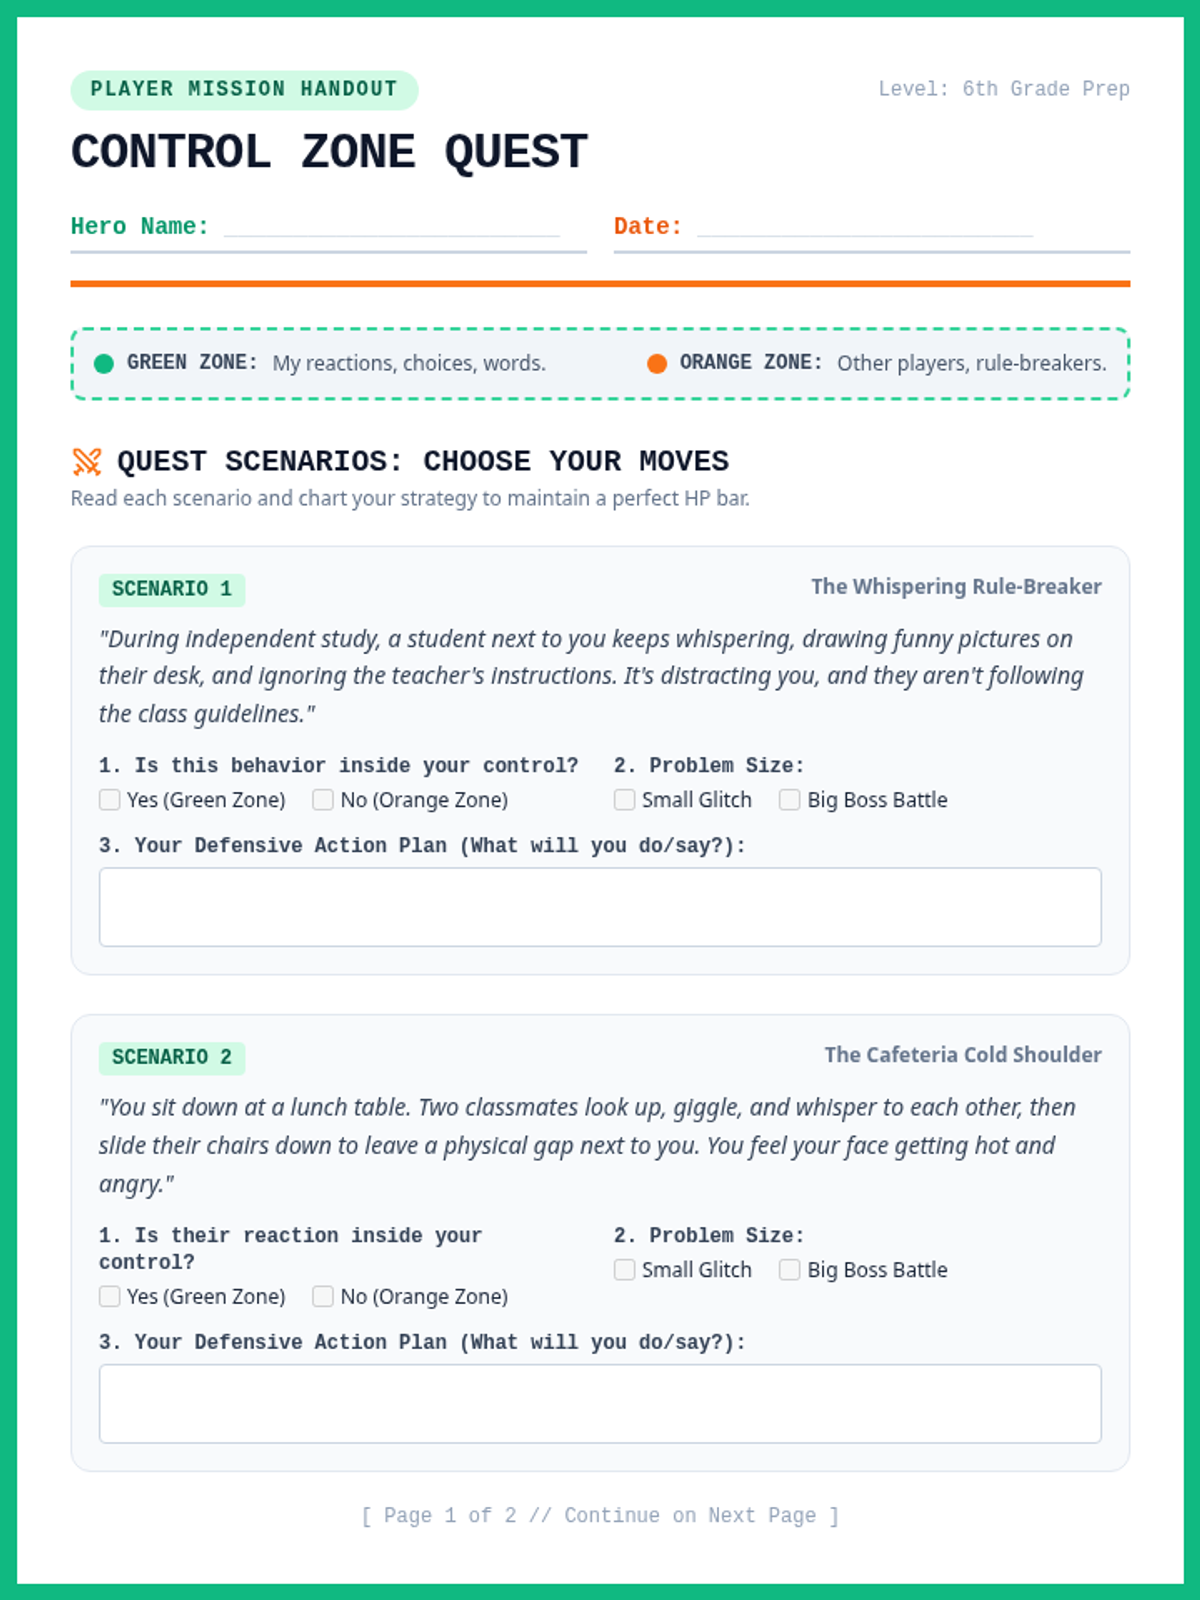
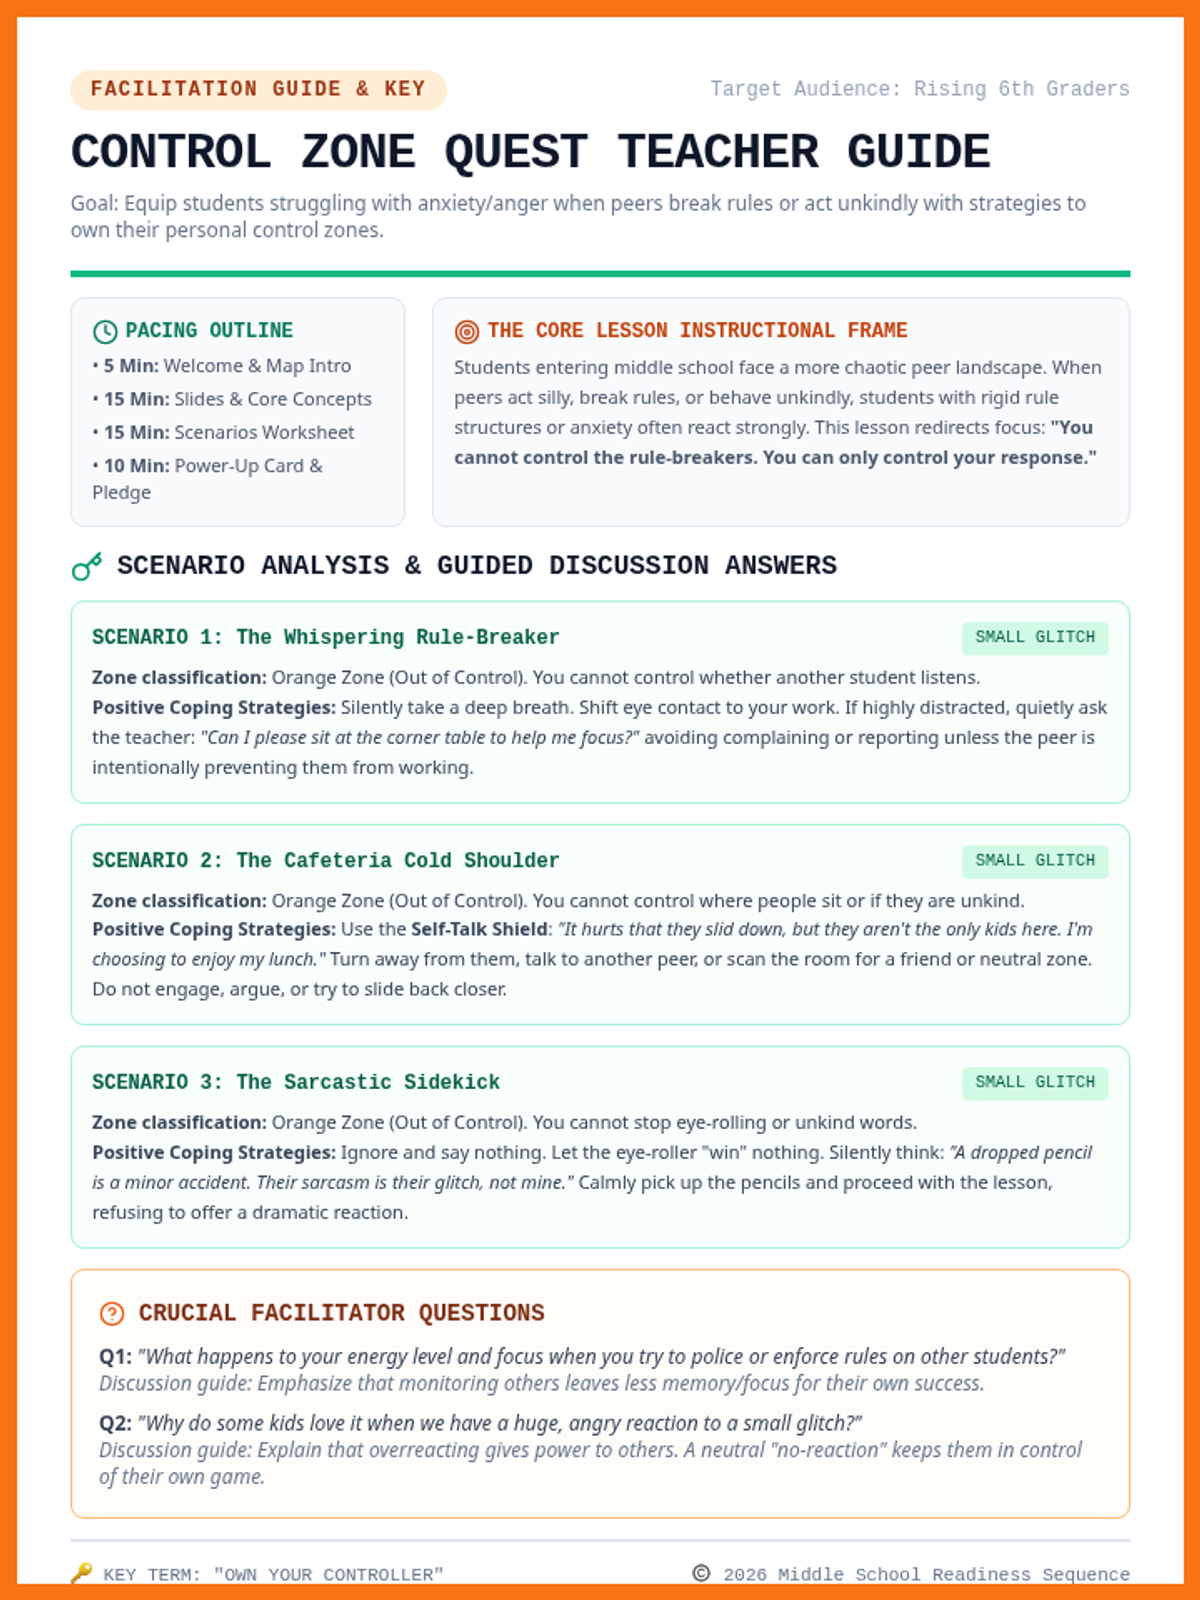
A transition lesson for rising sixth graders to master the Circle of Control and distinguish between big and small problems. Students learn practical coping strategies for peer conflicts and rule-breaking using a gamified quest theme.
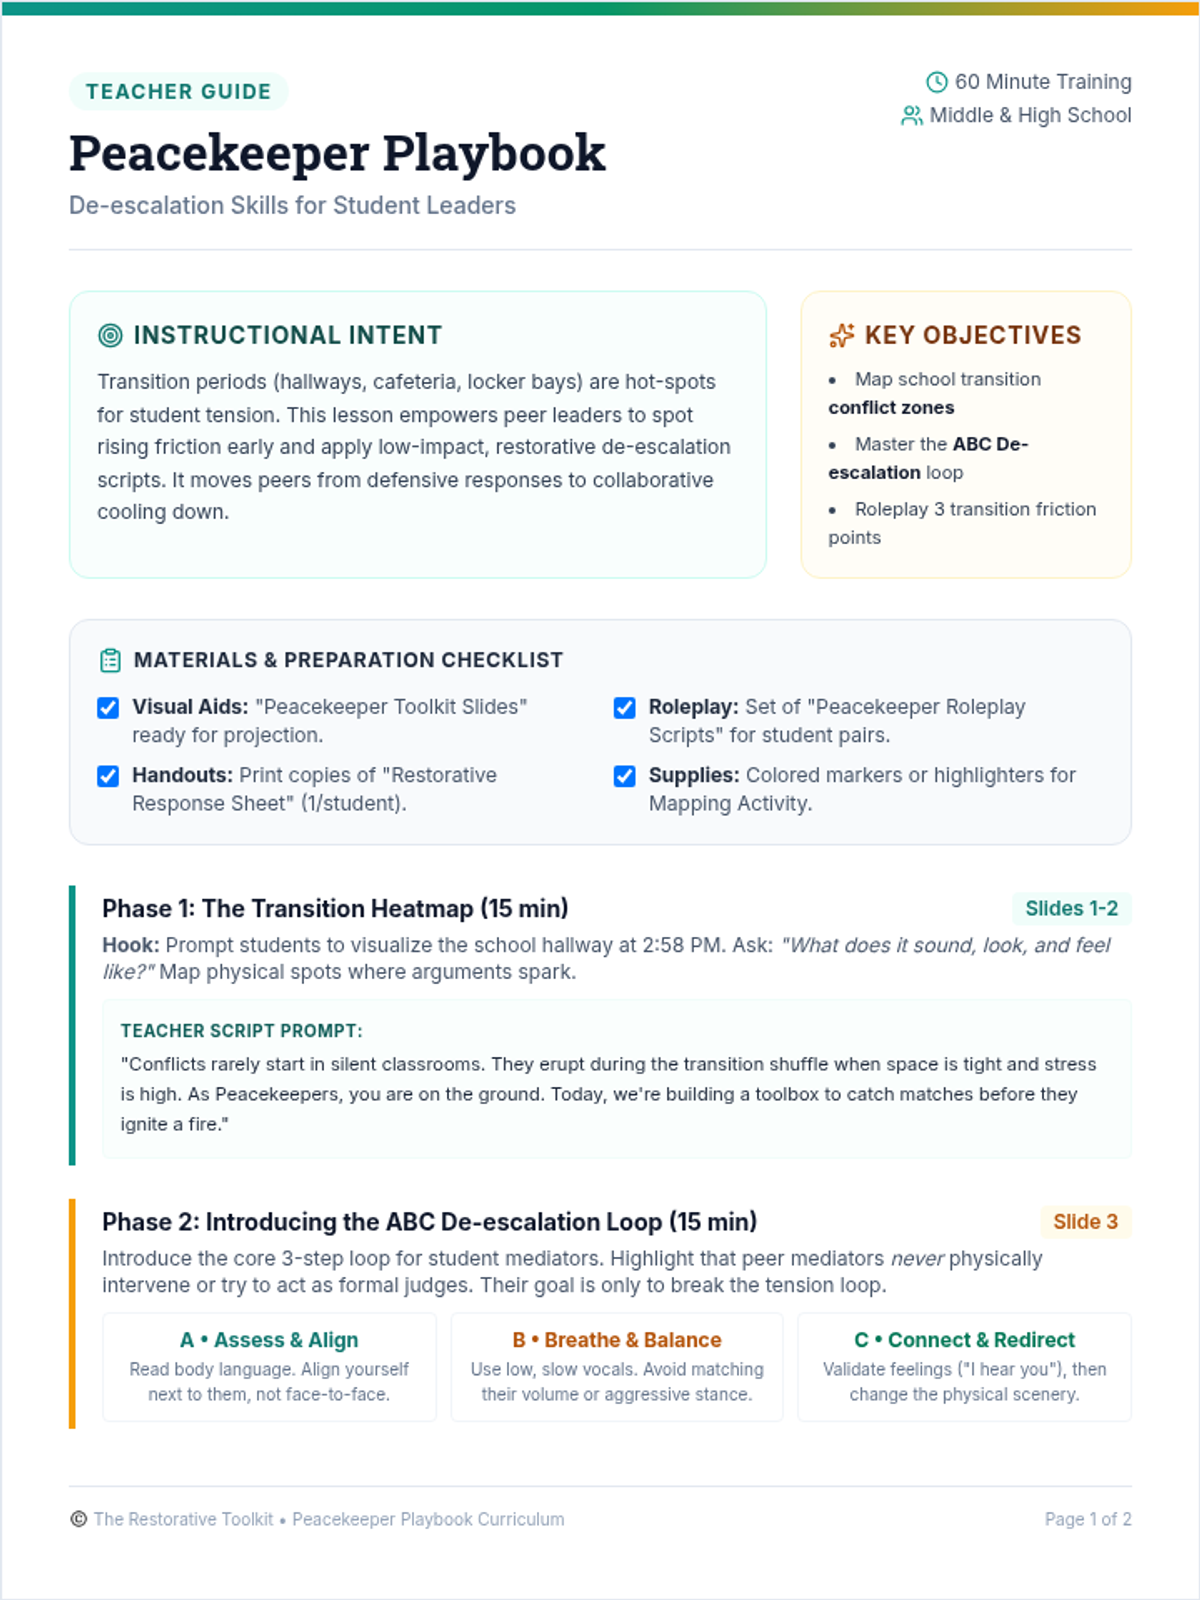
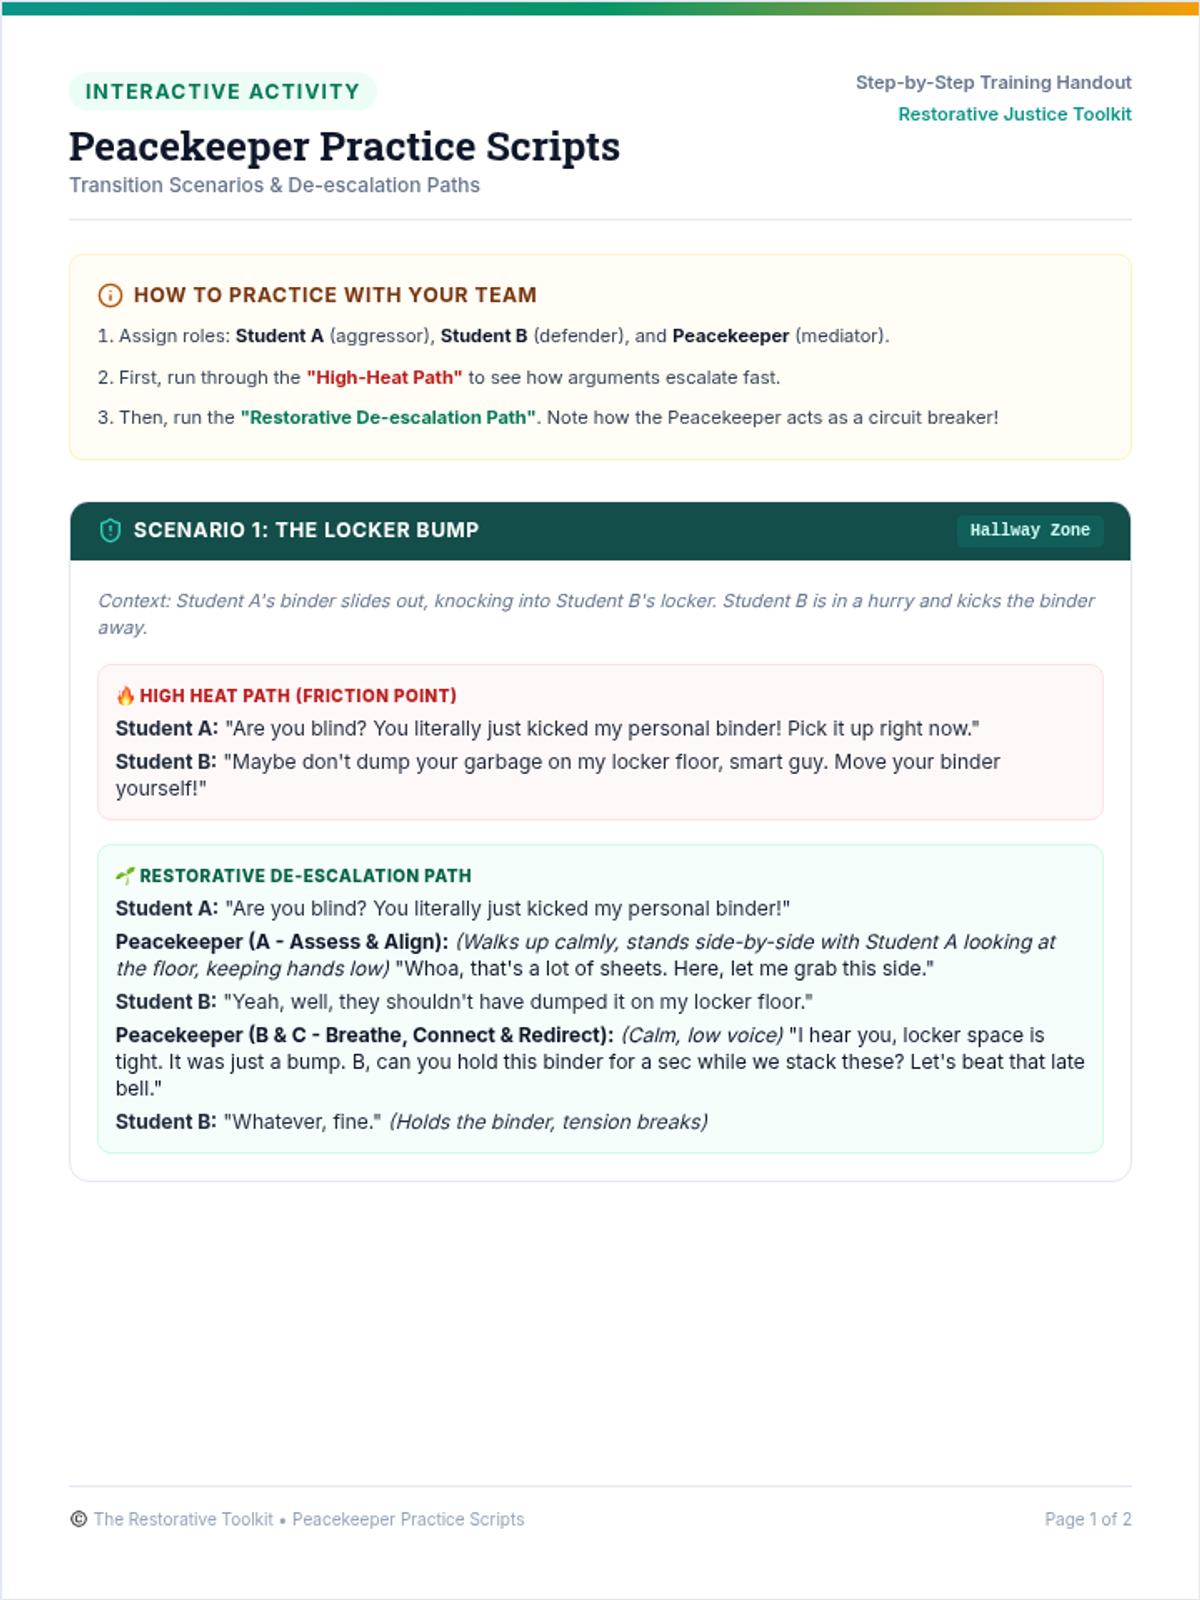
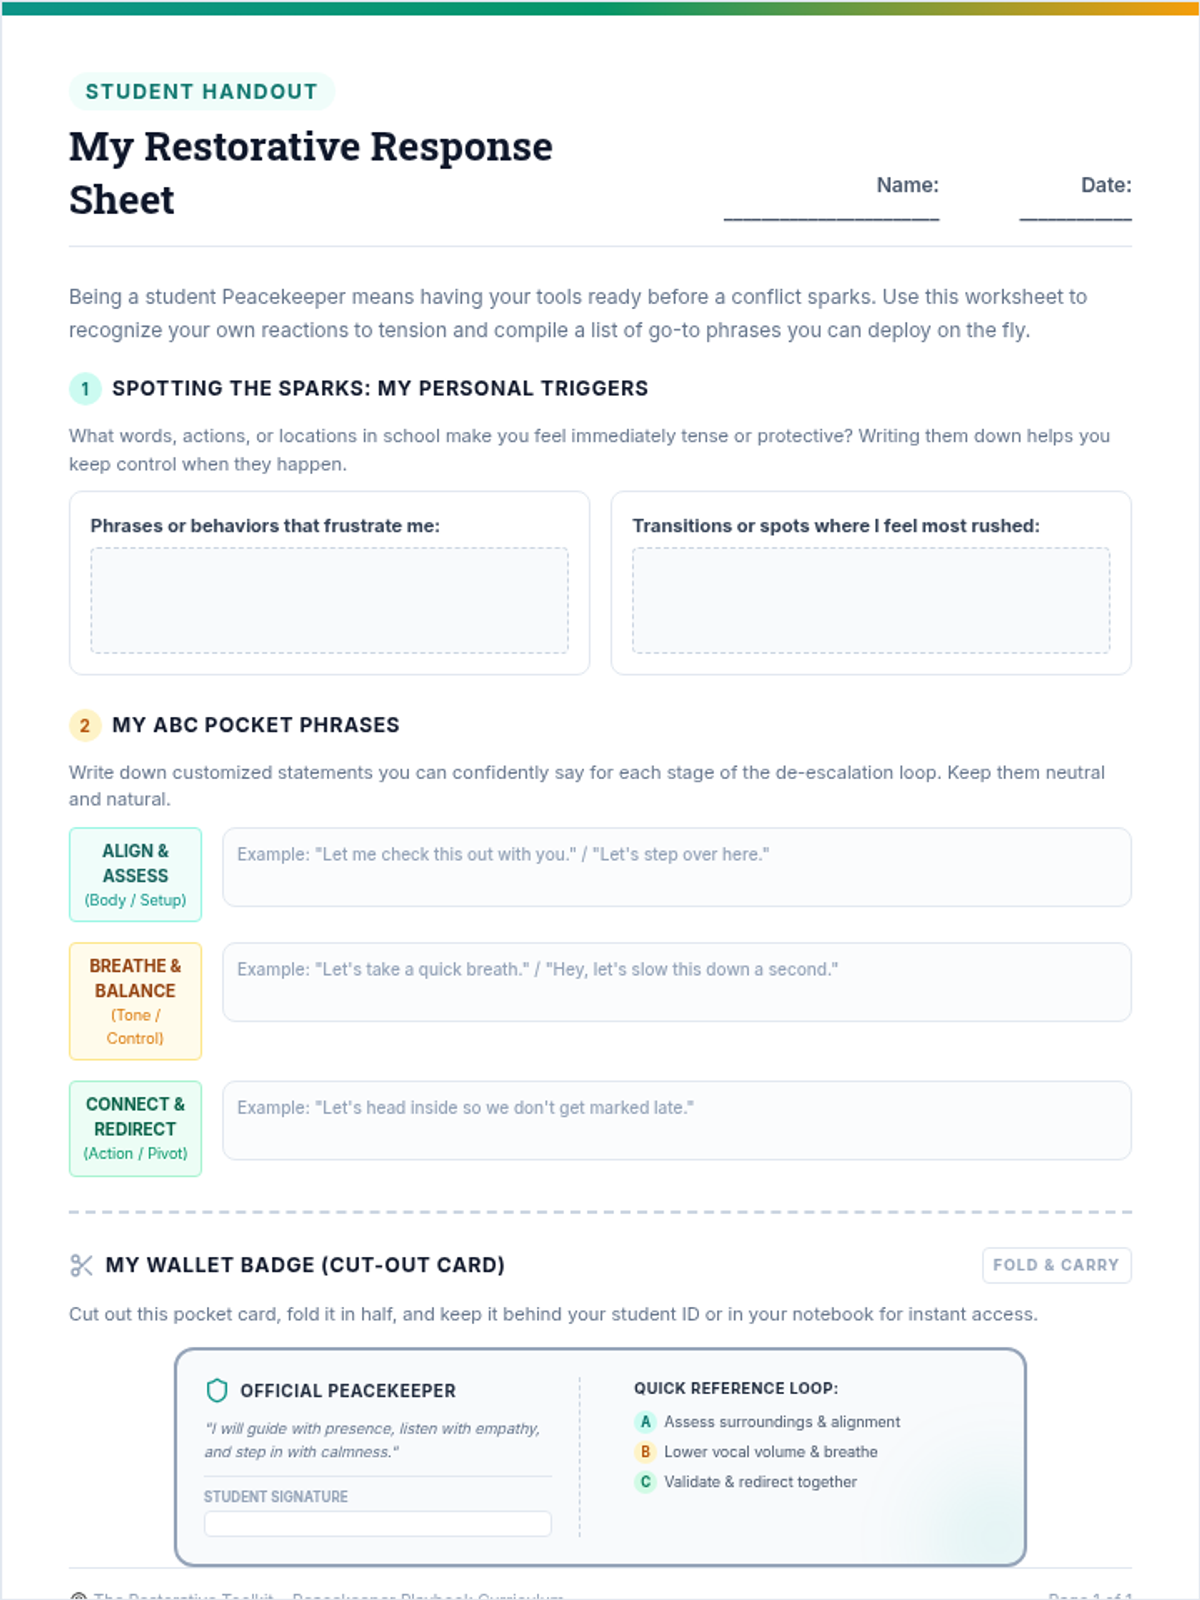
An interactive, student-led curriculum empowering middle and high school leaders to de-escalate minor peer conflicts during high-stress transition periods, building sustainable restorative justice skills.
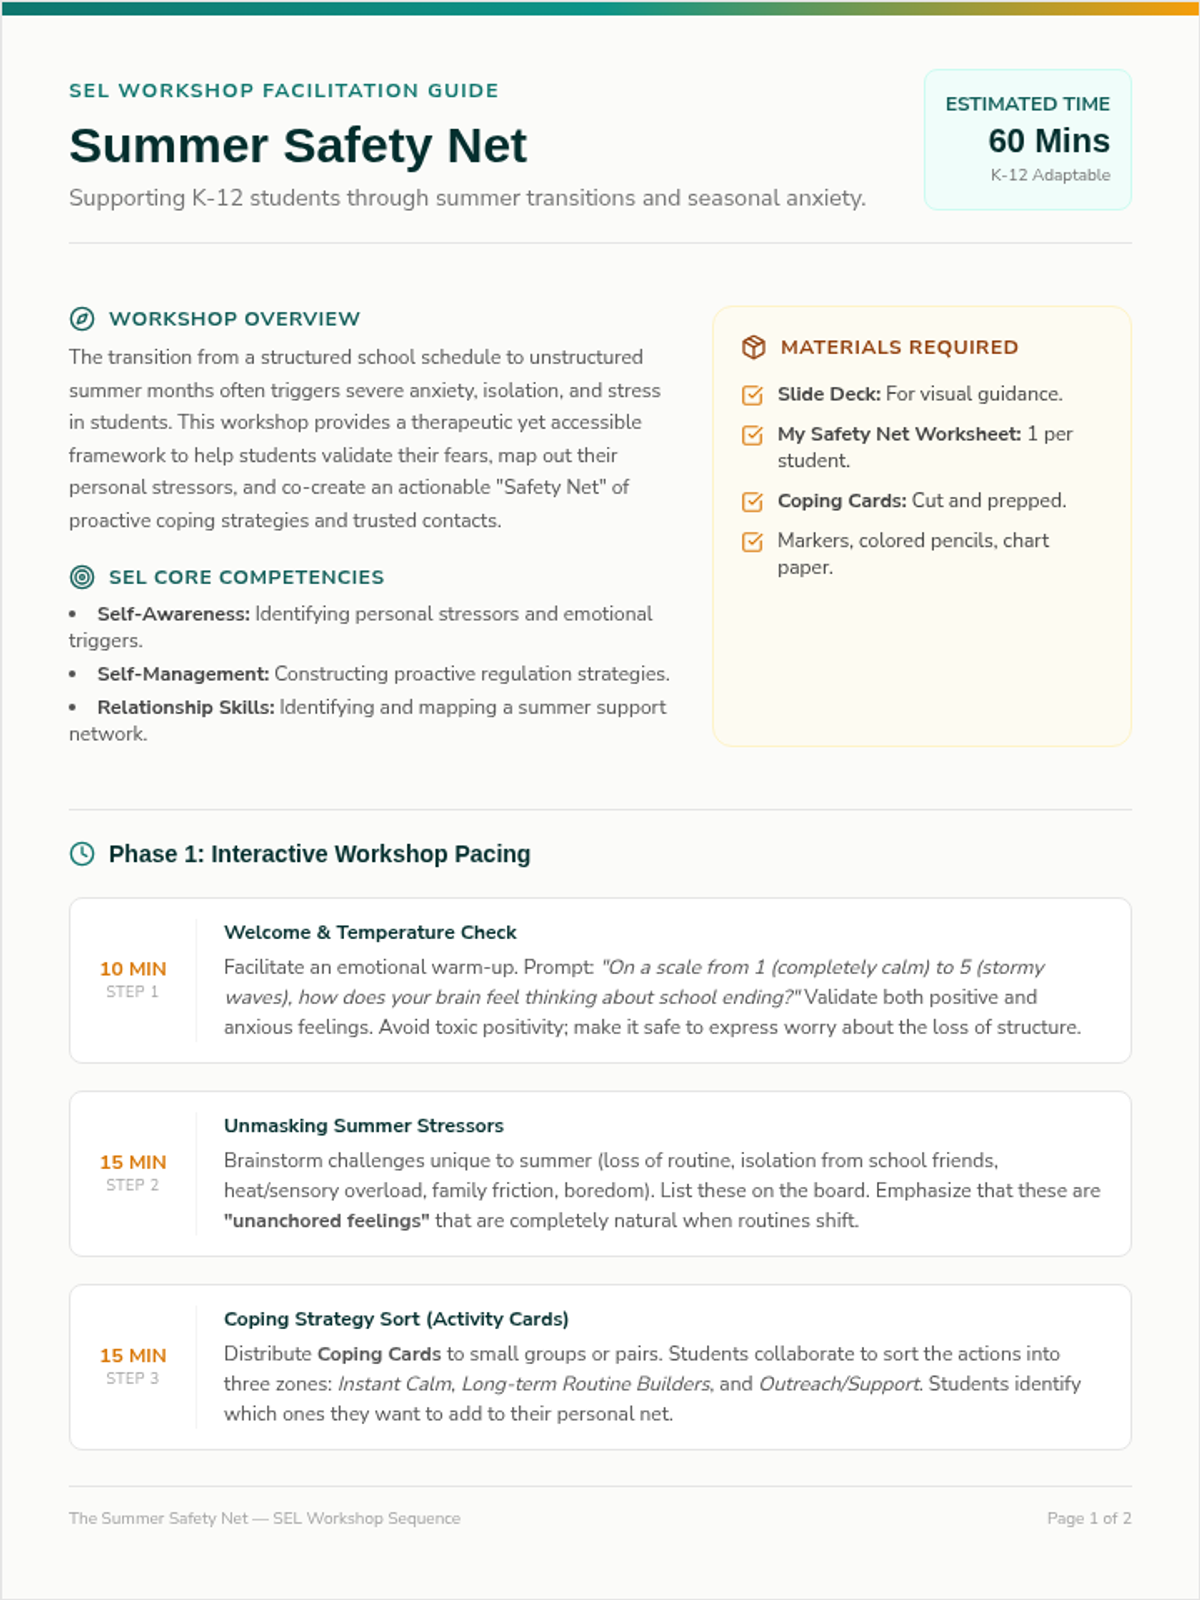
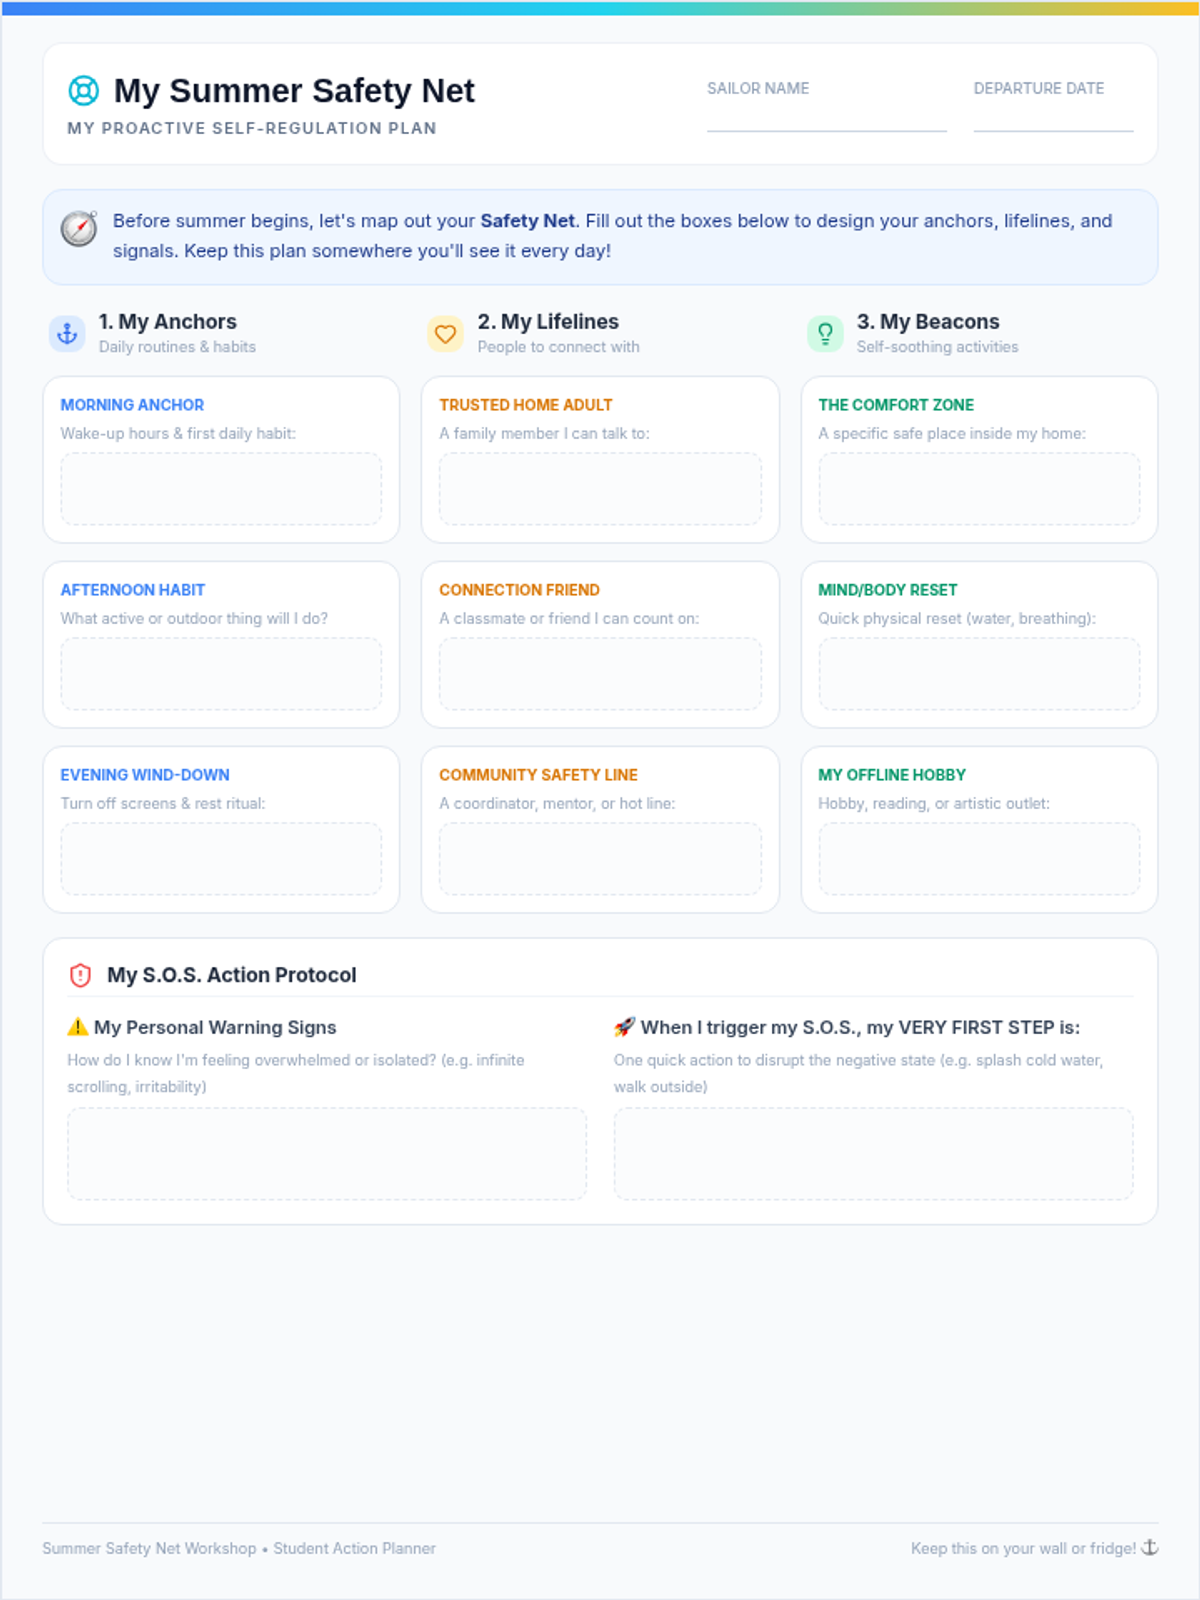
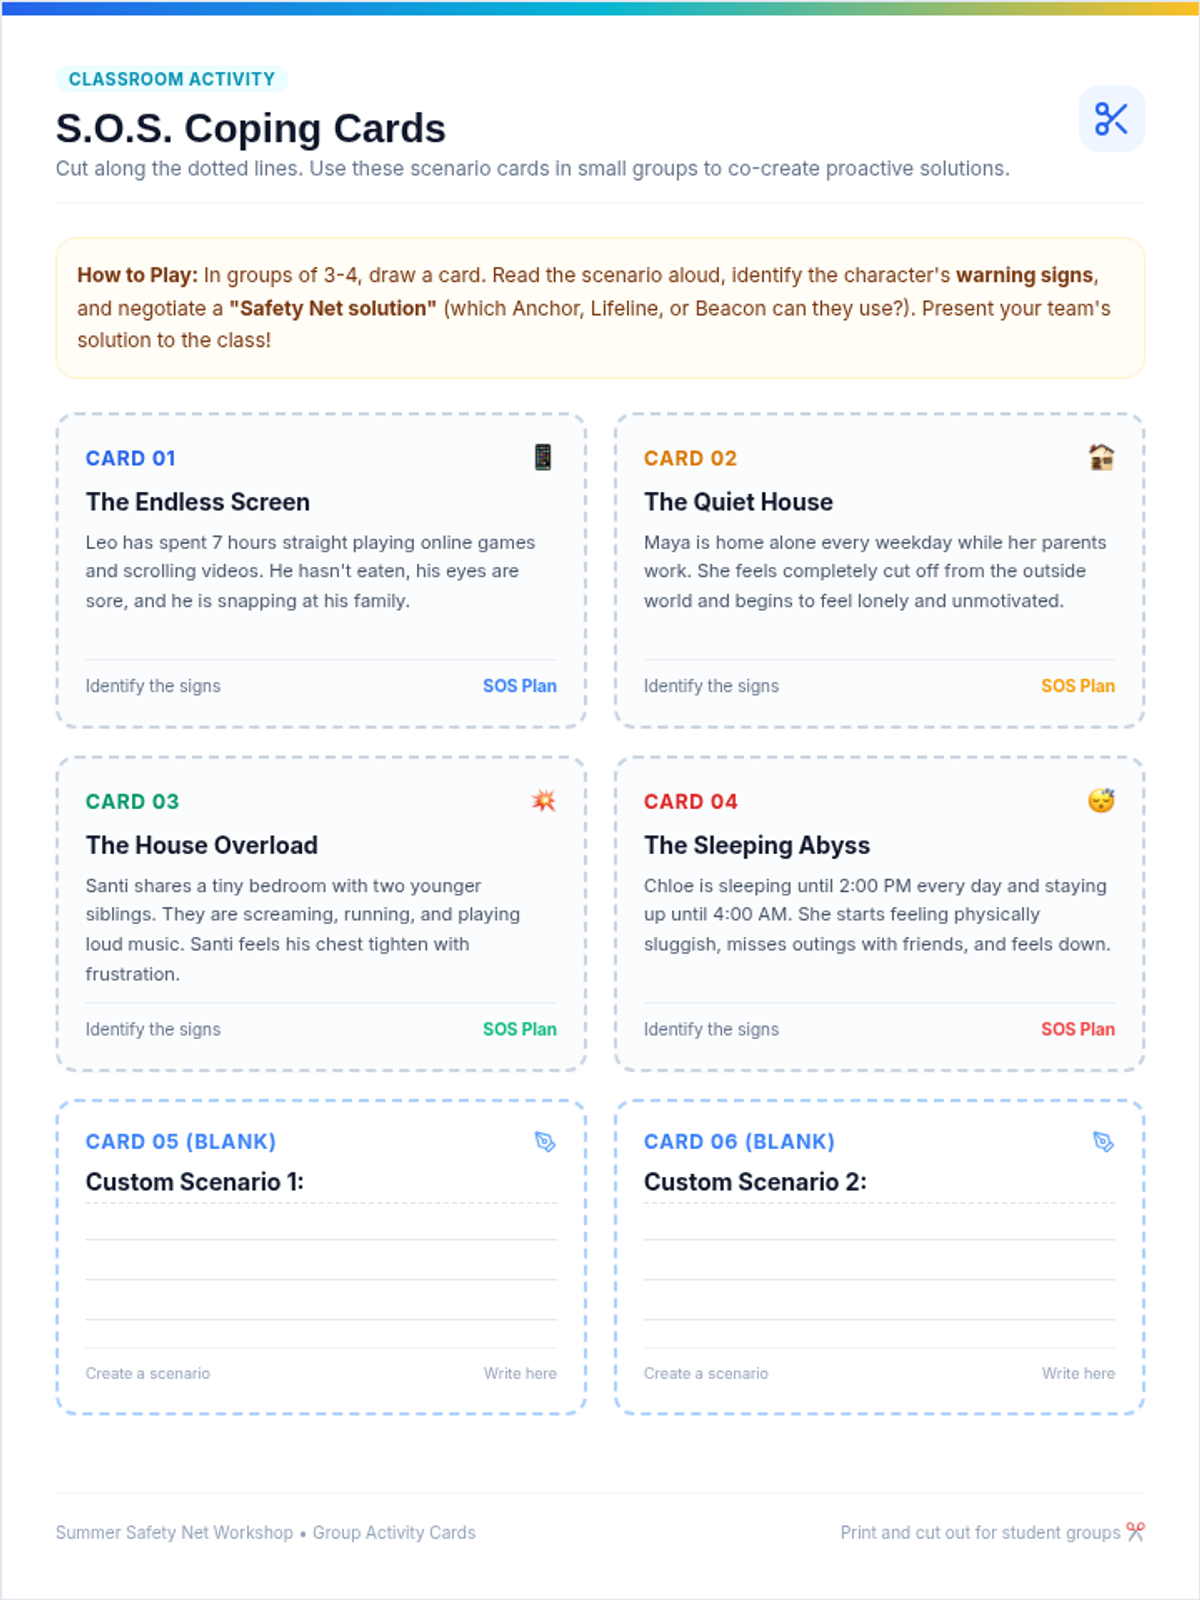
A collaborative mental health workshop designed to help students navigate summer transition anxiety by identifying stressors, mapping coping strategies, and co-creating a personalized proactive emotional regulation plan.
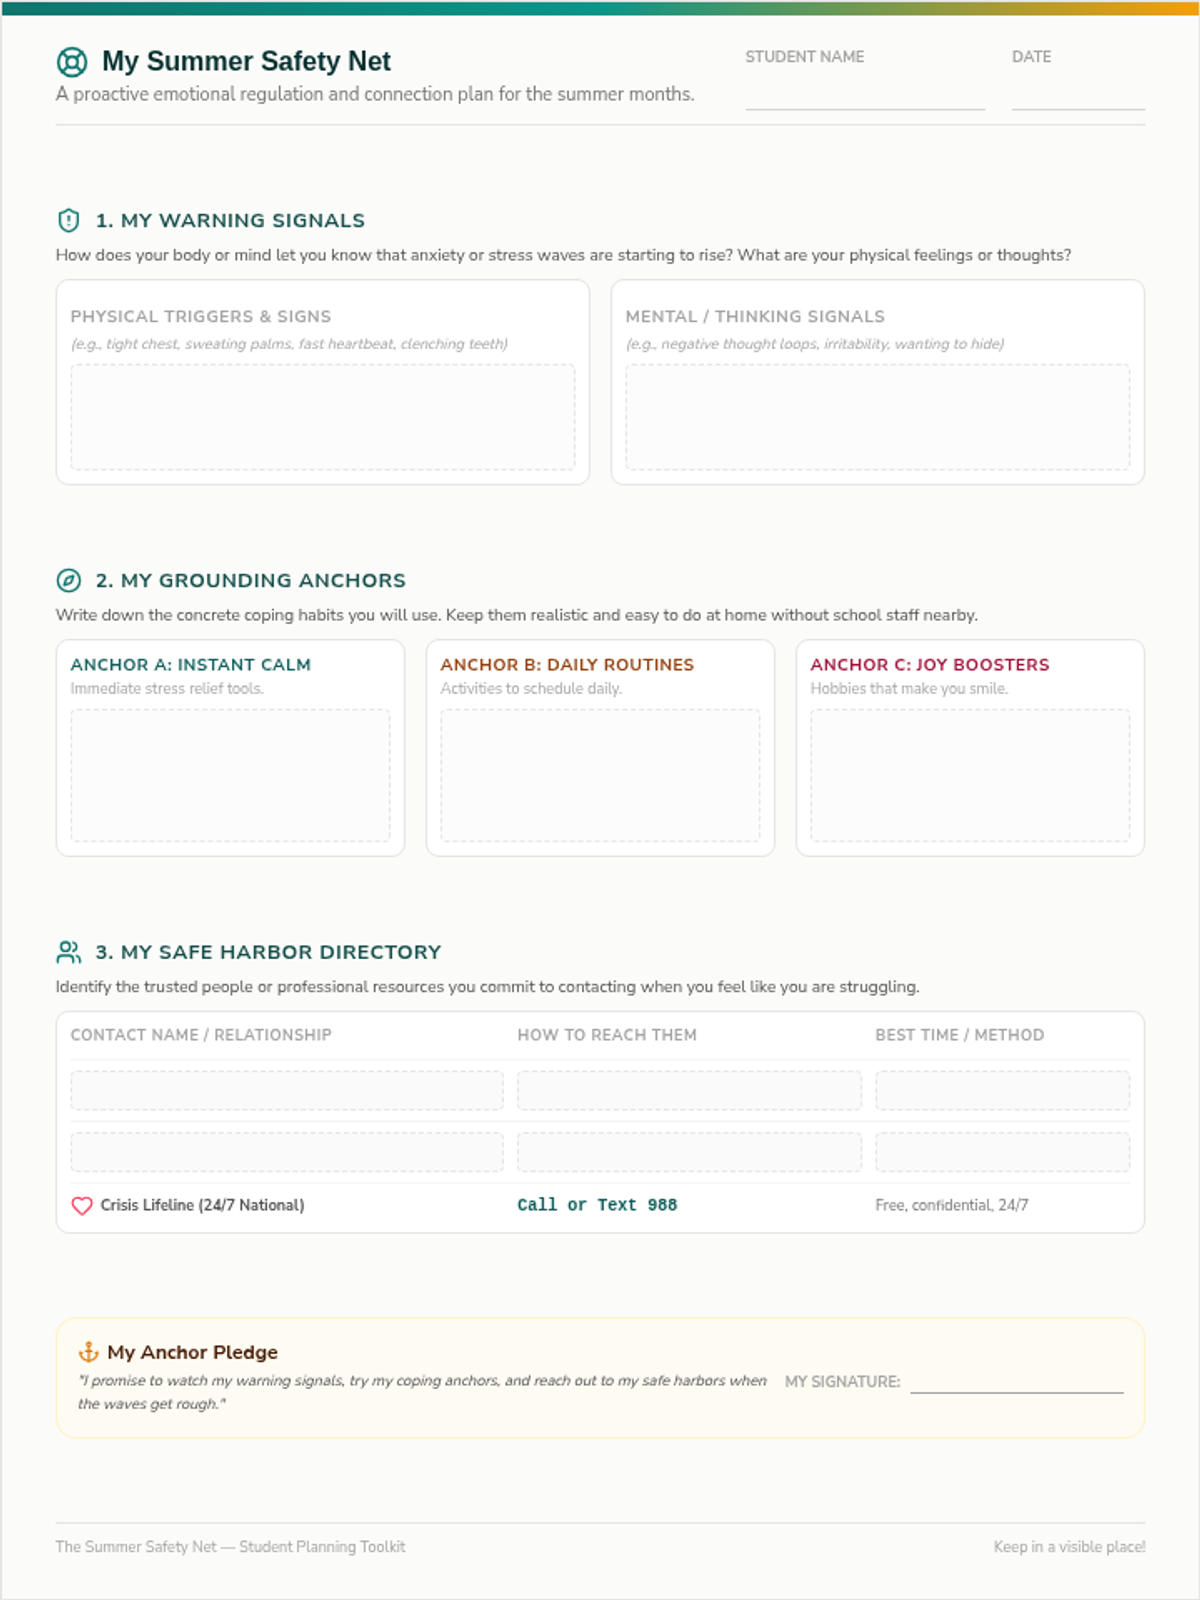
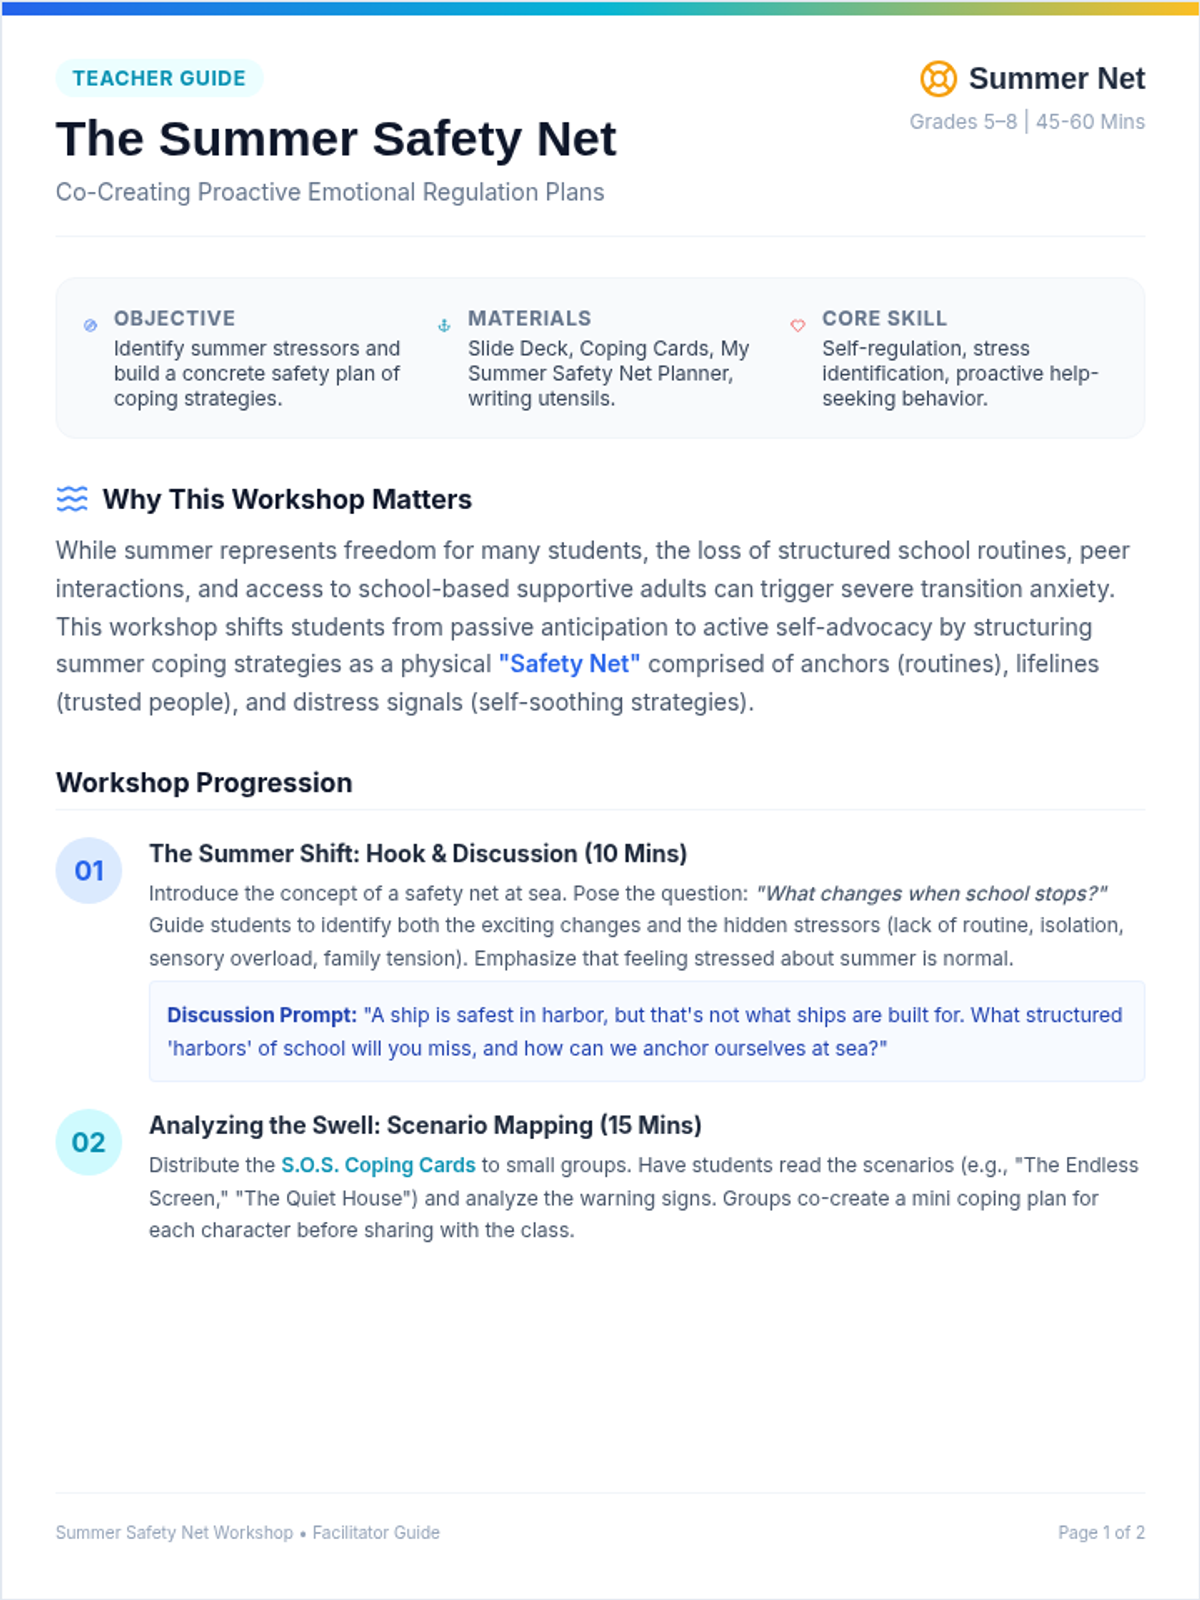
A collaborative workshop designed to help students identify summer stressors and co-create proactive plans for emotional regulation outside of school. This lesson builds concrete coping strategies and 'safety nets' for students transitioning to summer break.
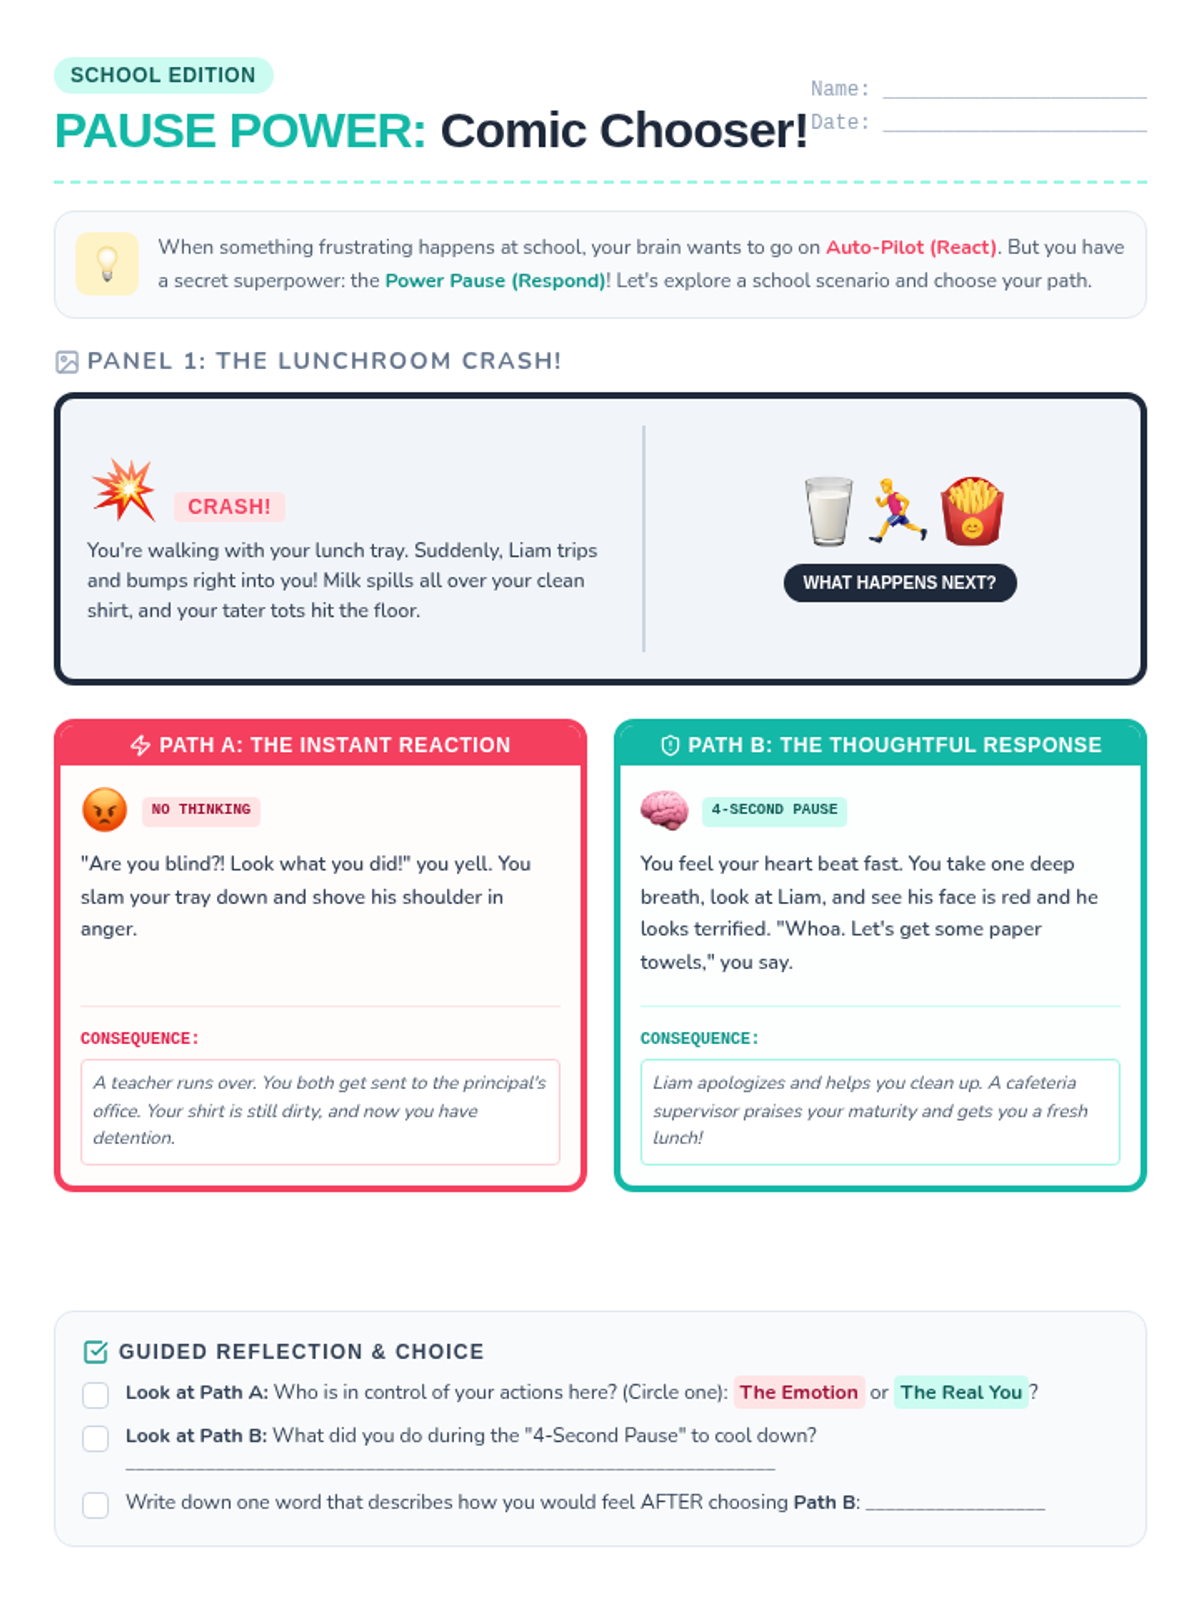
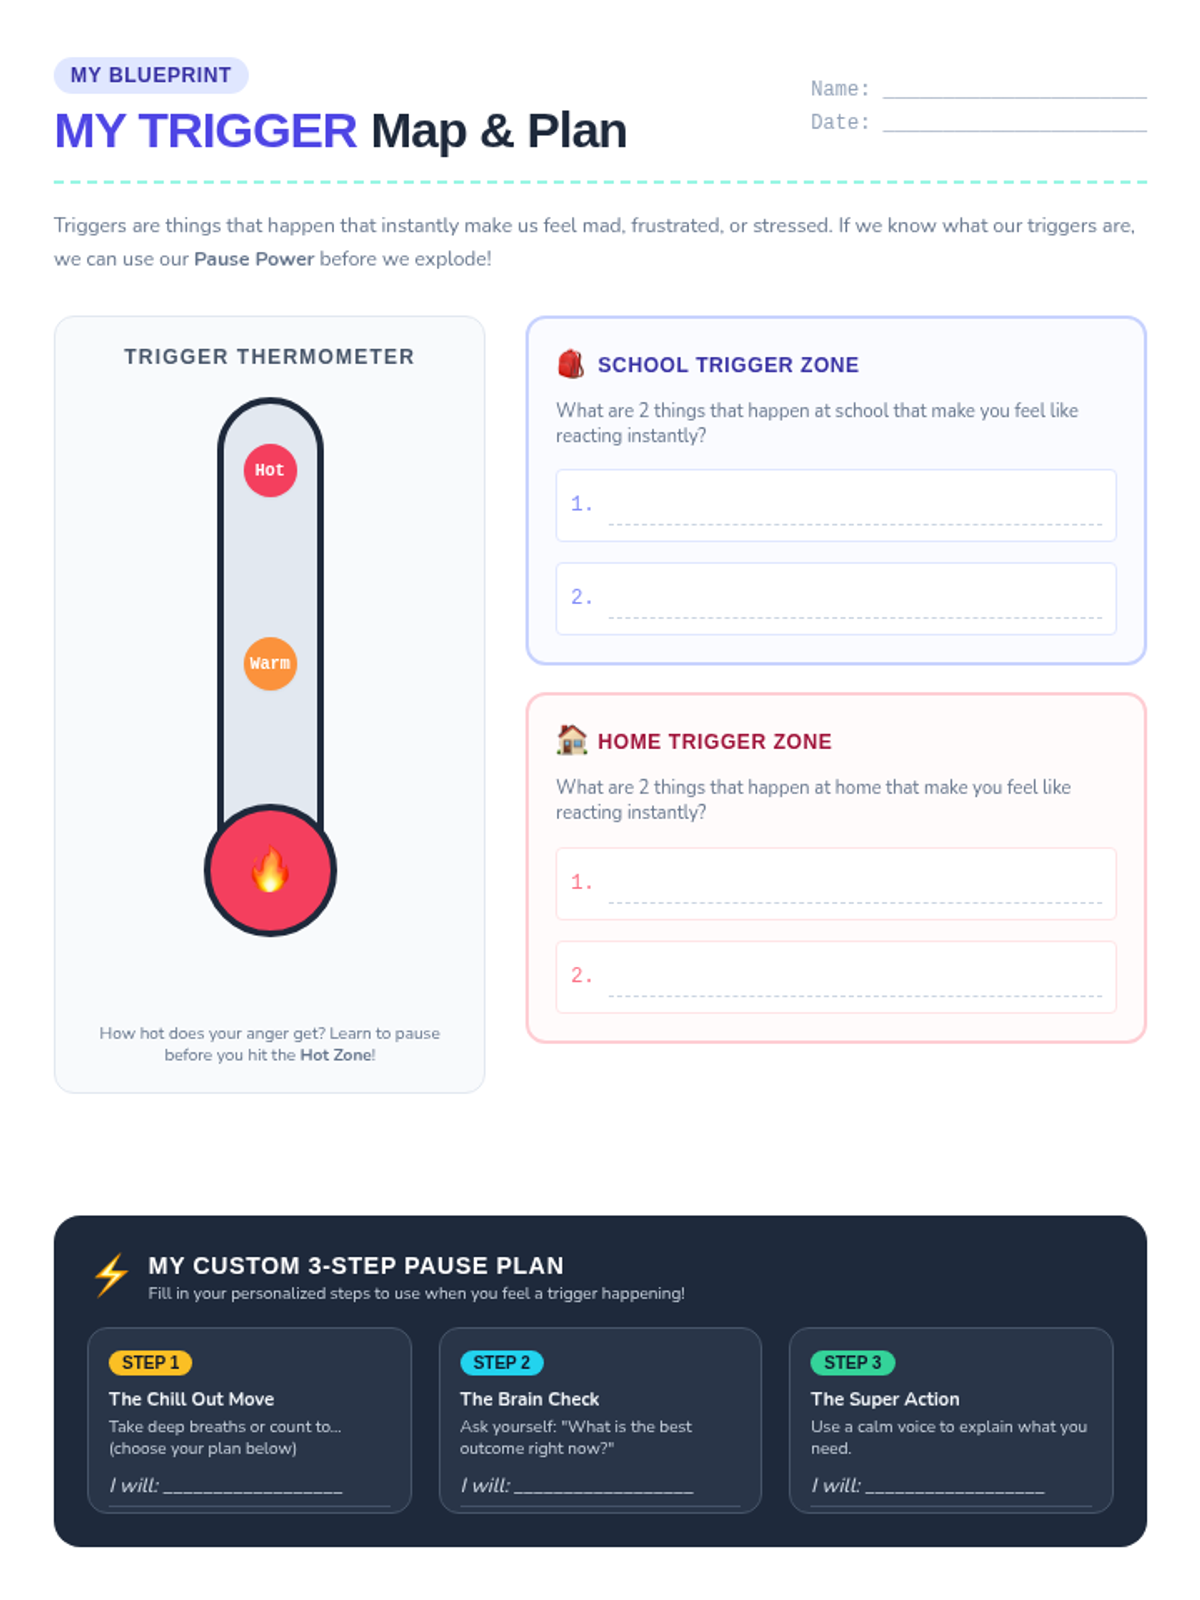
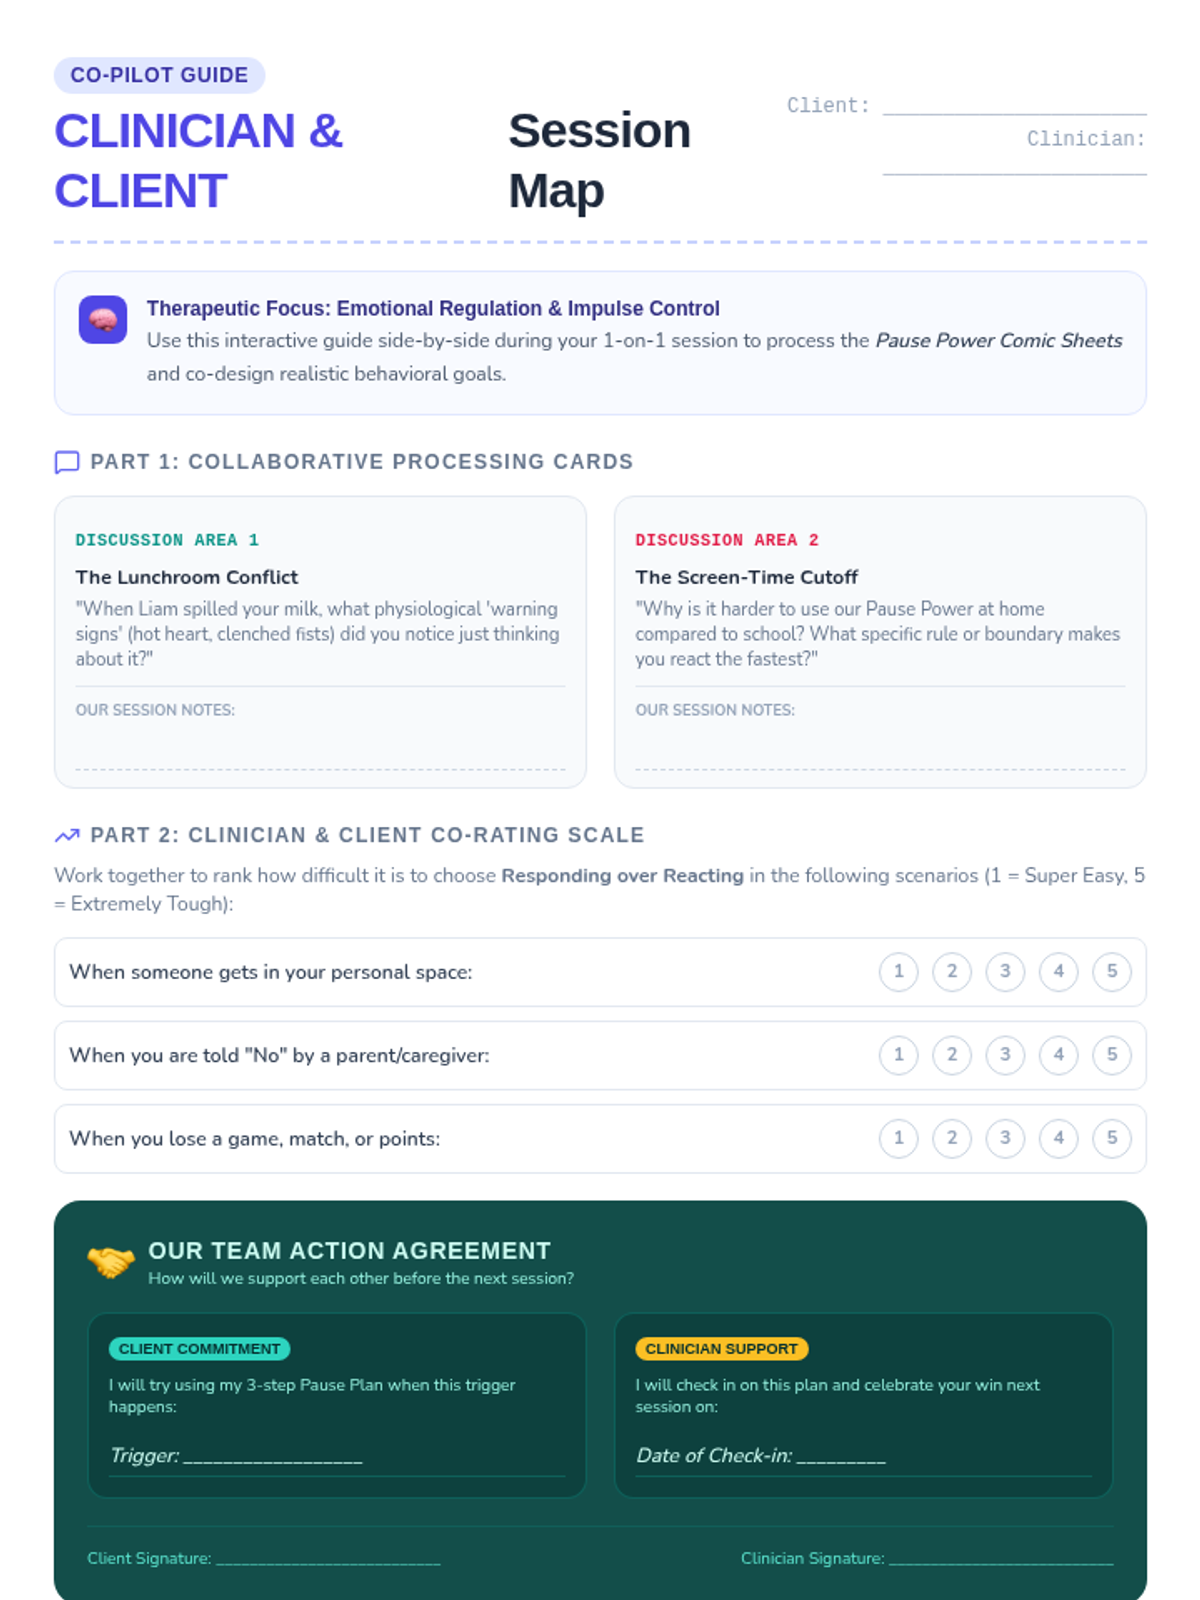
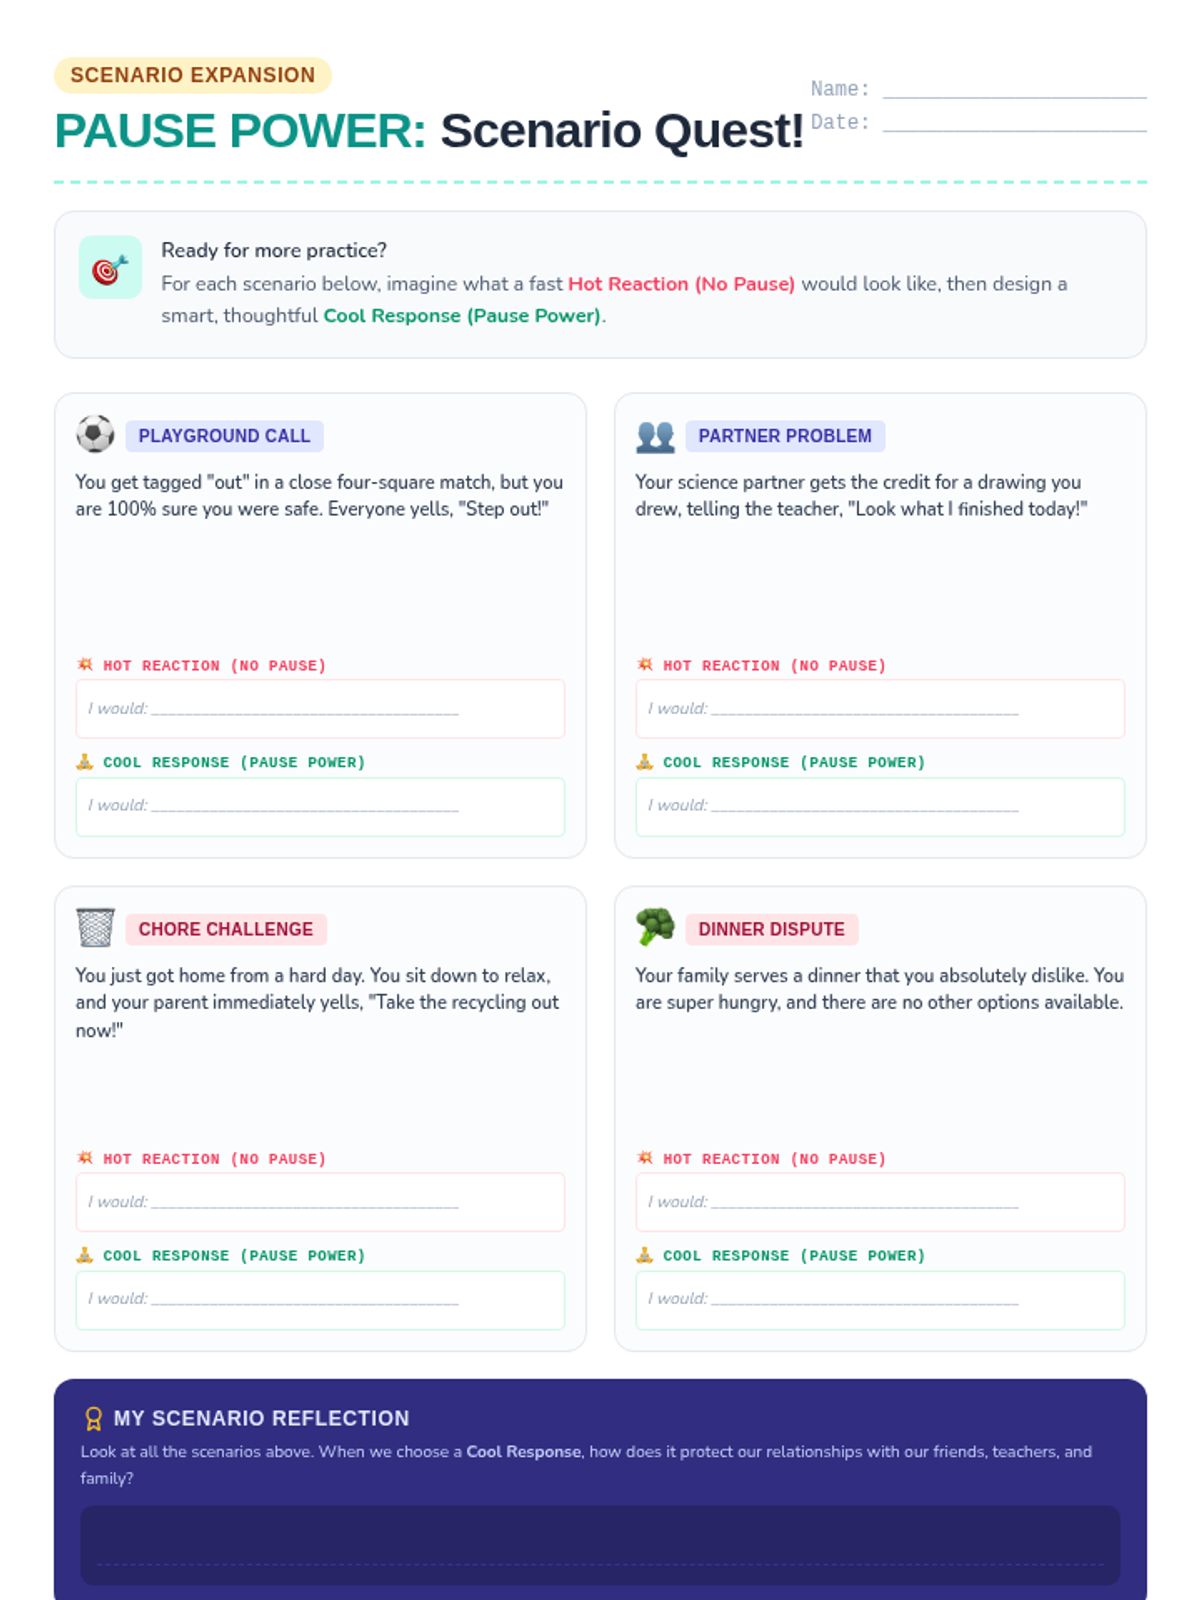
A visual, guided lesson for 5th graders to learn the difference between automatic reactions and thoughtful responses in school and home environments, using comic strips, scenario paths, and personal trigger maps.
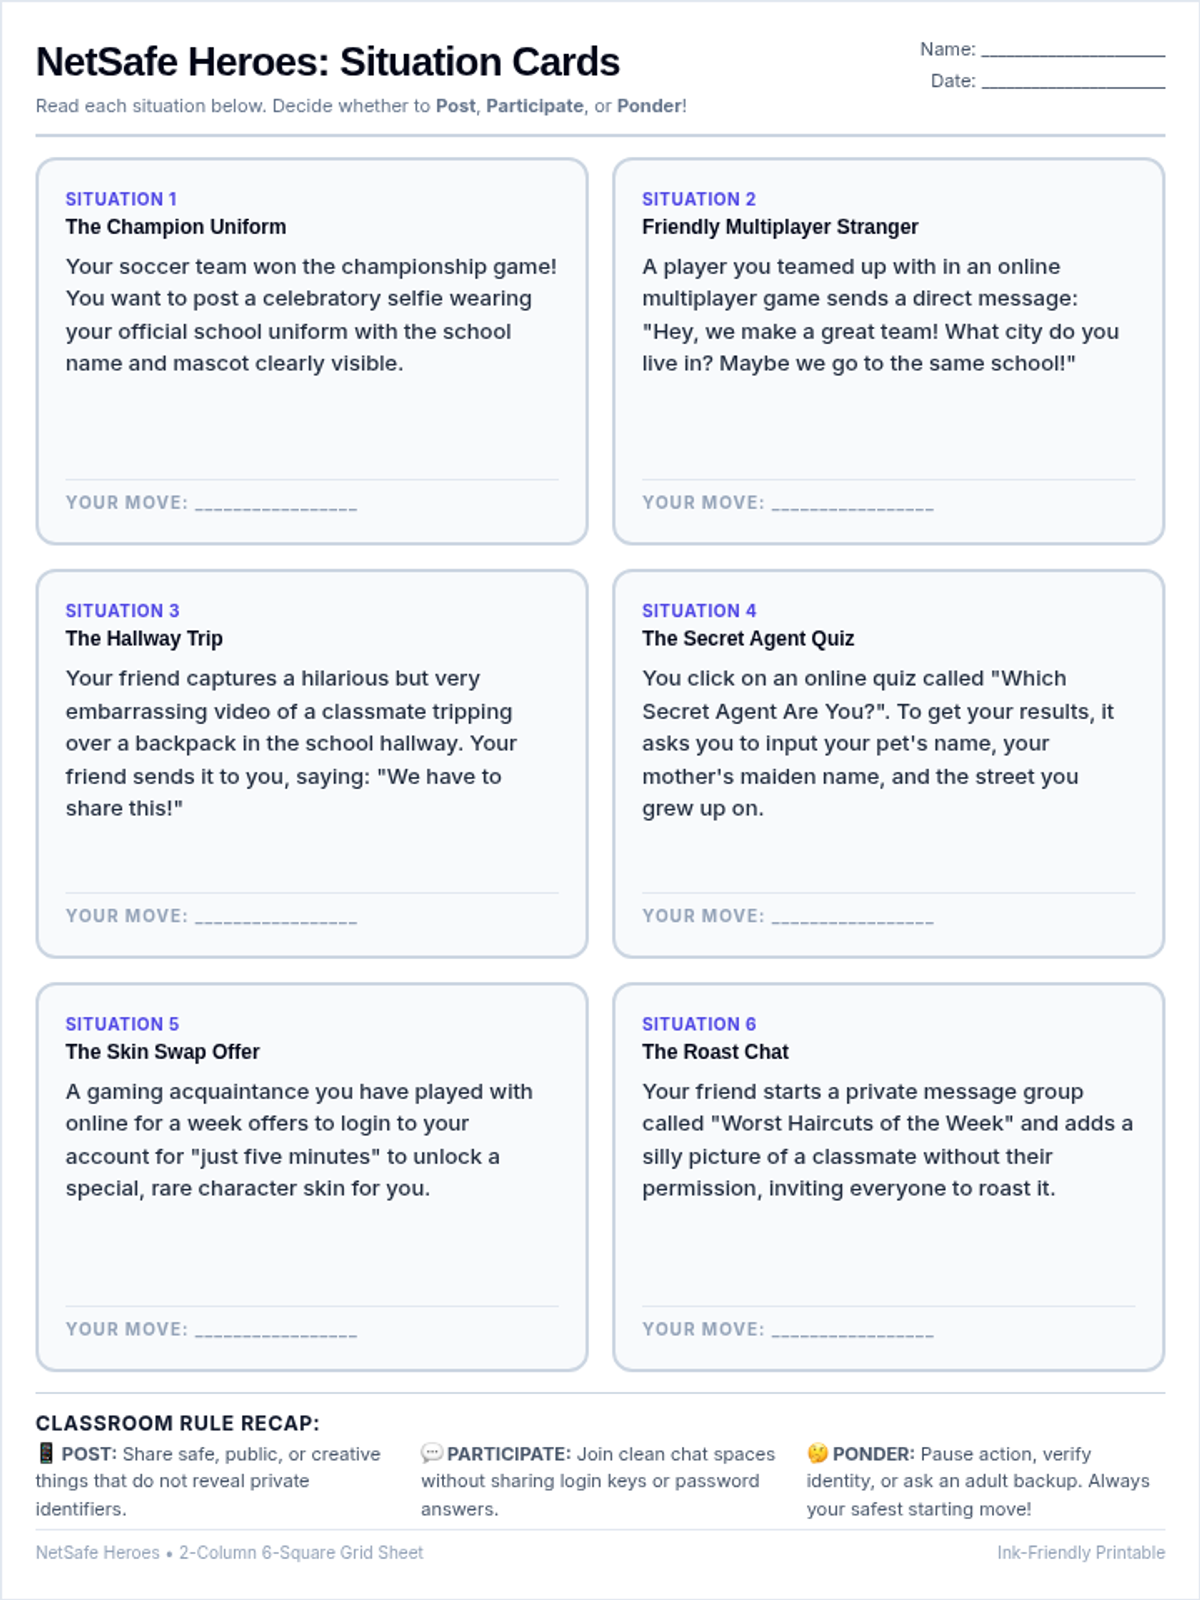
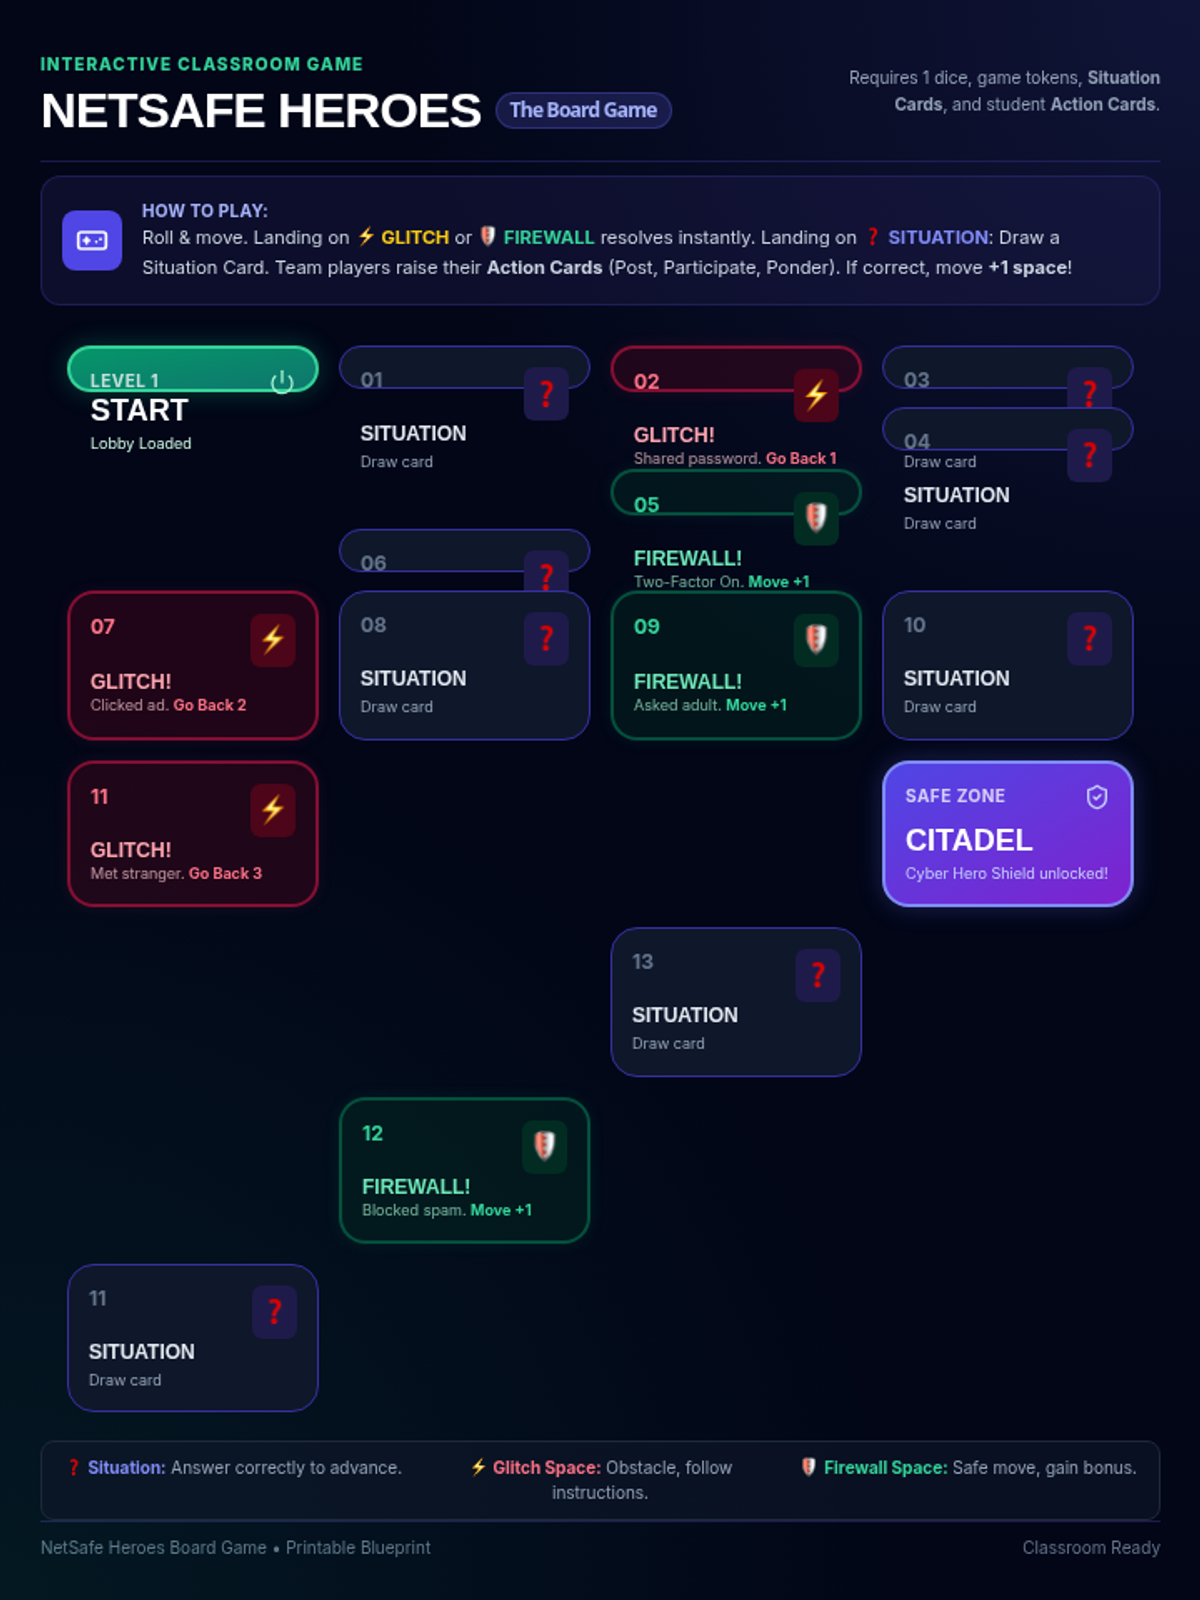
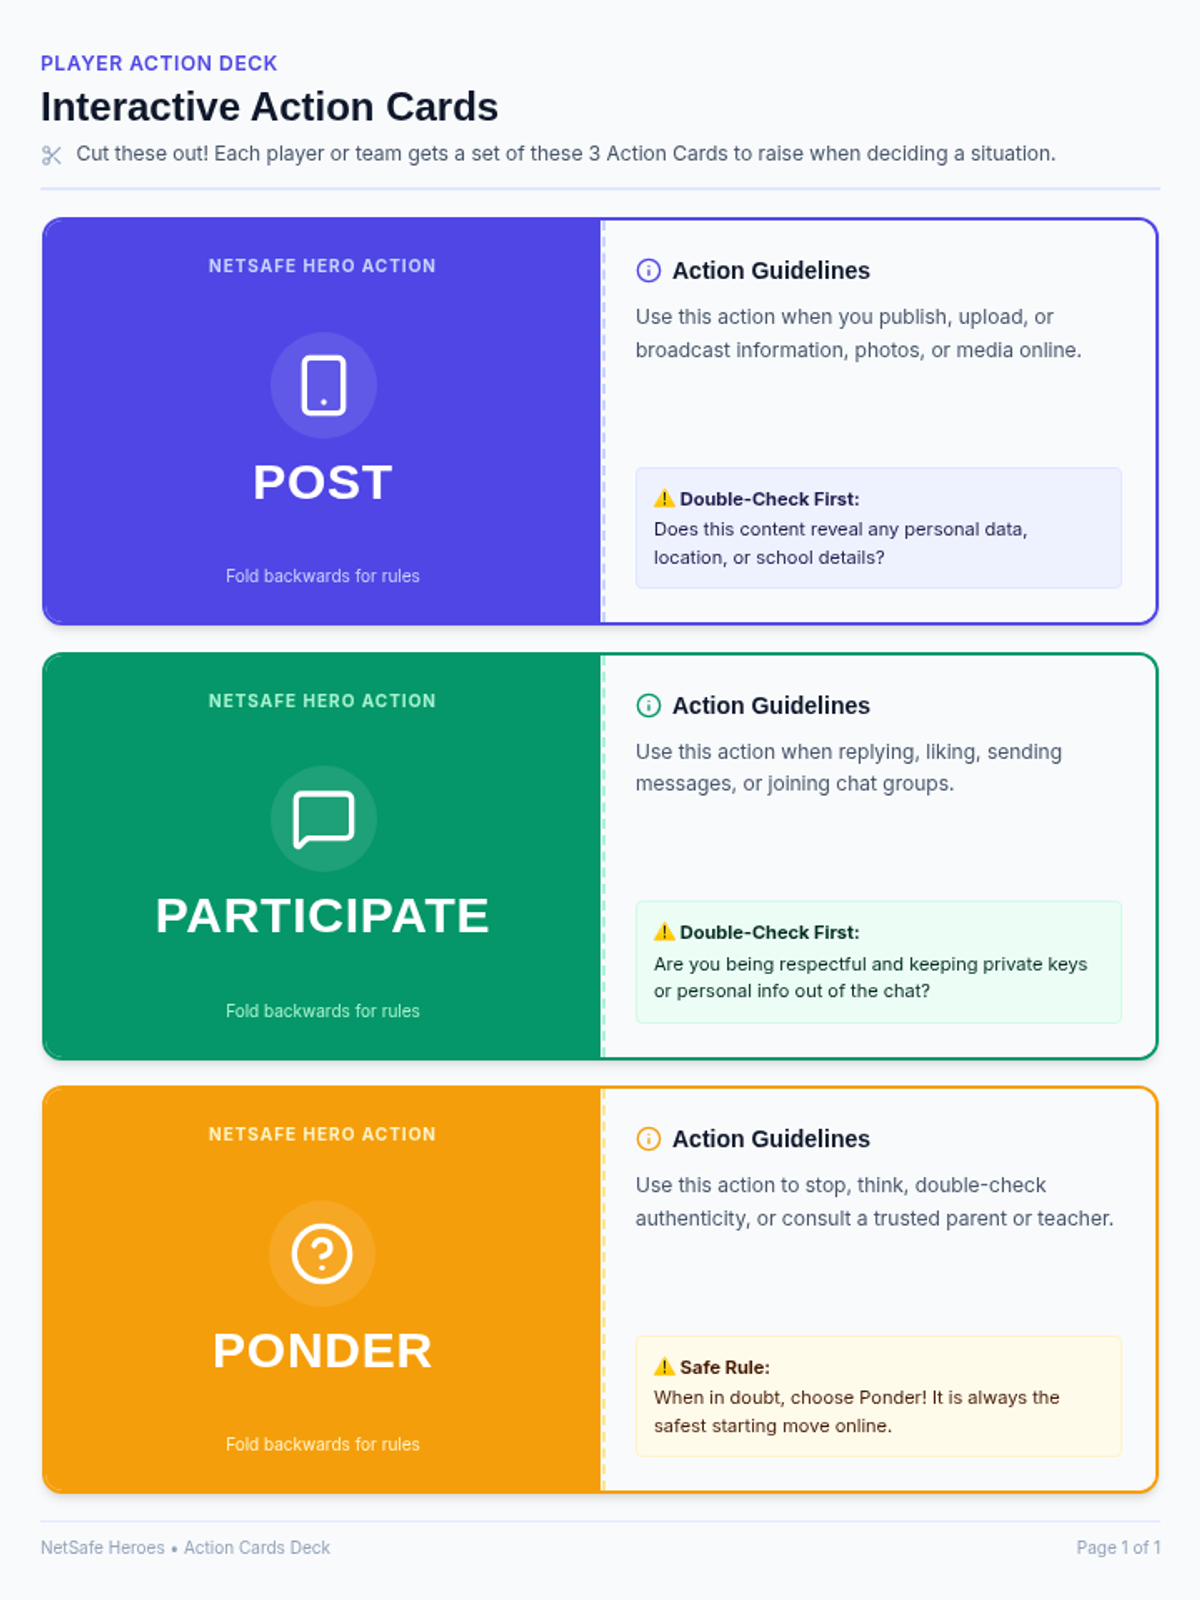
A lesson focusing on critical digital citizenship skills, helping students navigate the web safely and make informed choices when posting, interacting, or pondering online situations.
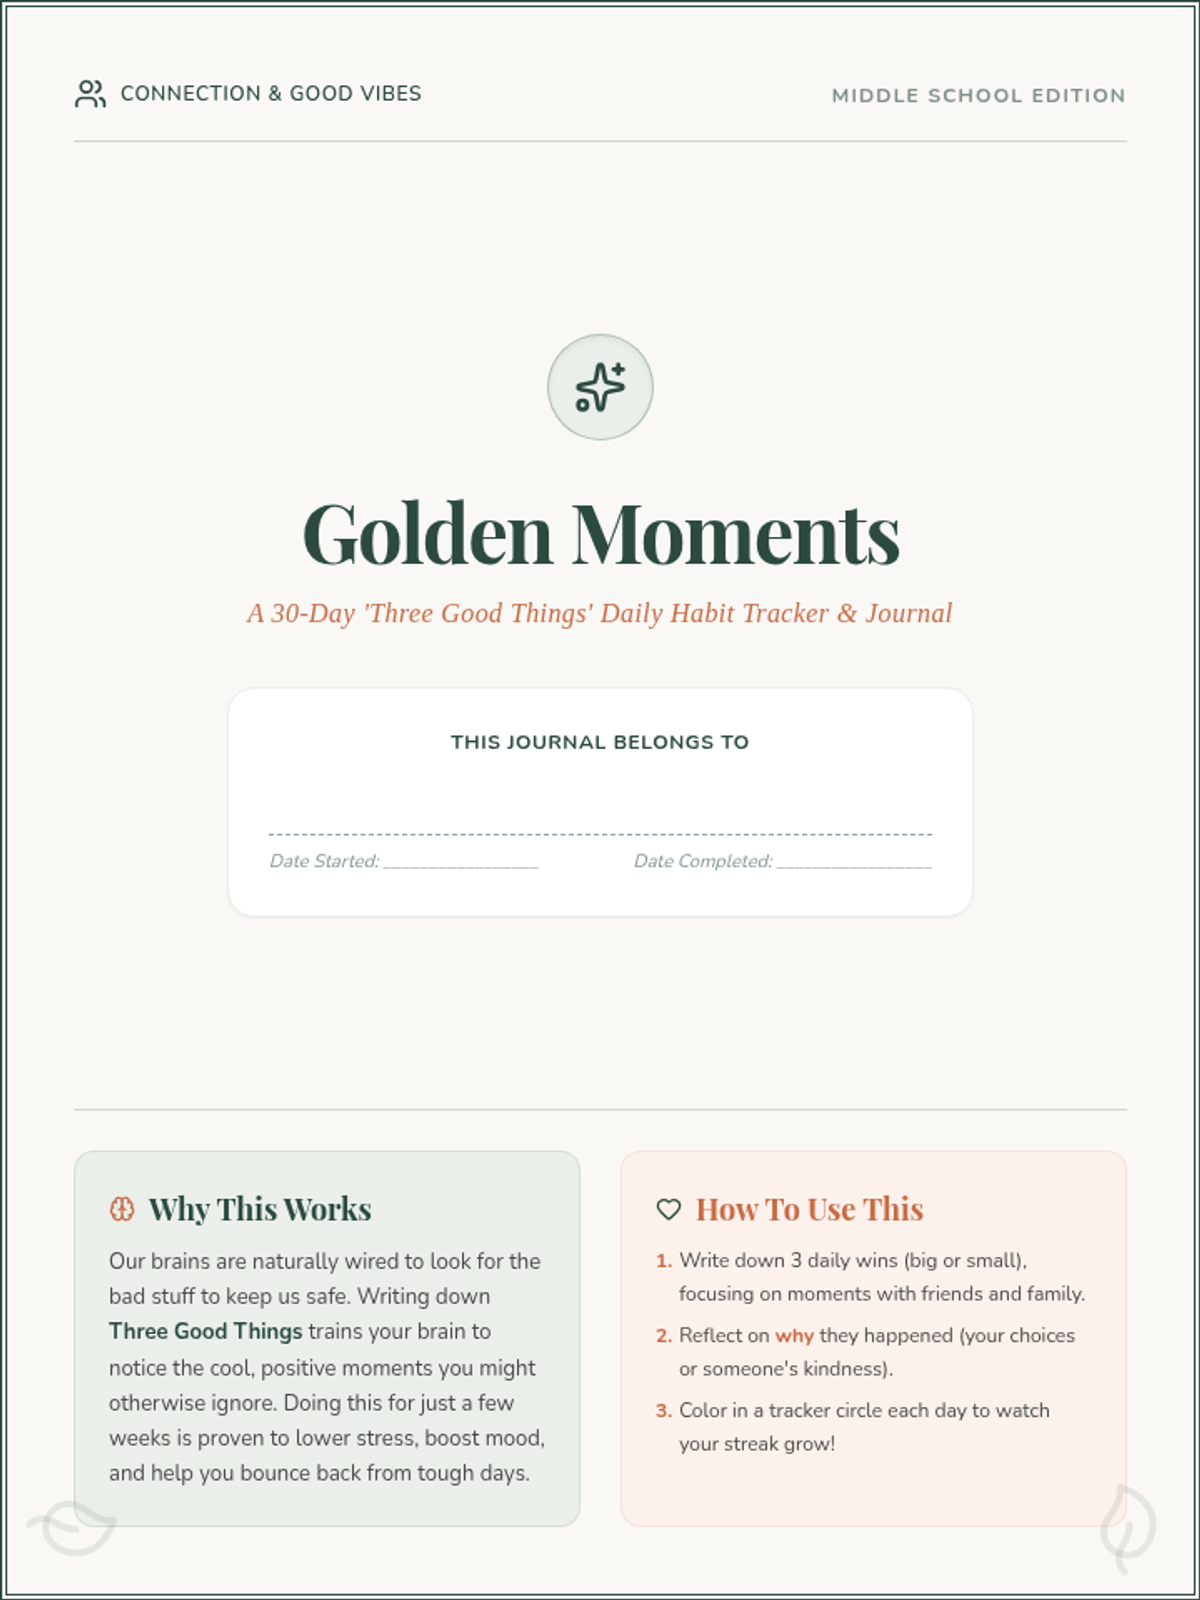
A transformative lesson introducing students to the psychological science of gratitude, centered on the 'Three Good Things' daily habit to build mental resilience, optimism, and emotional wellbeing.
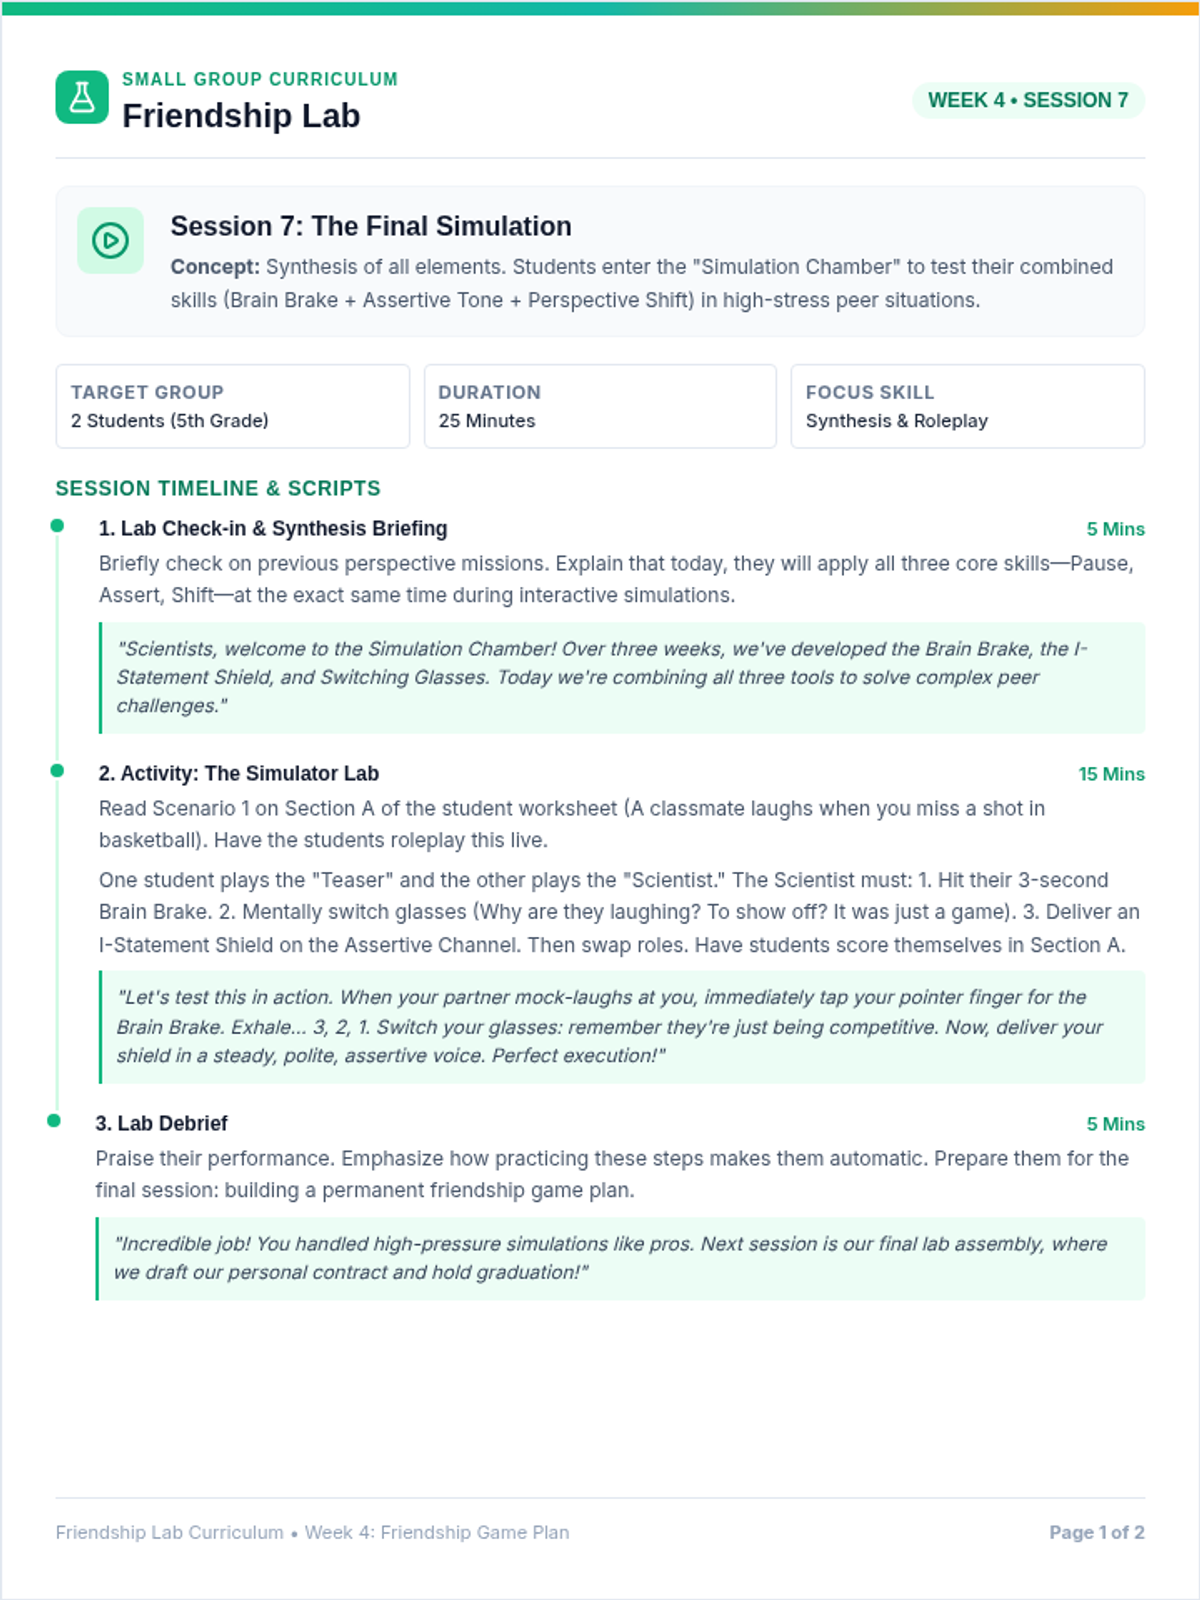
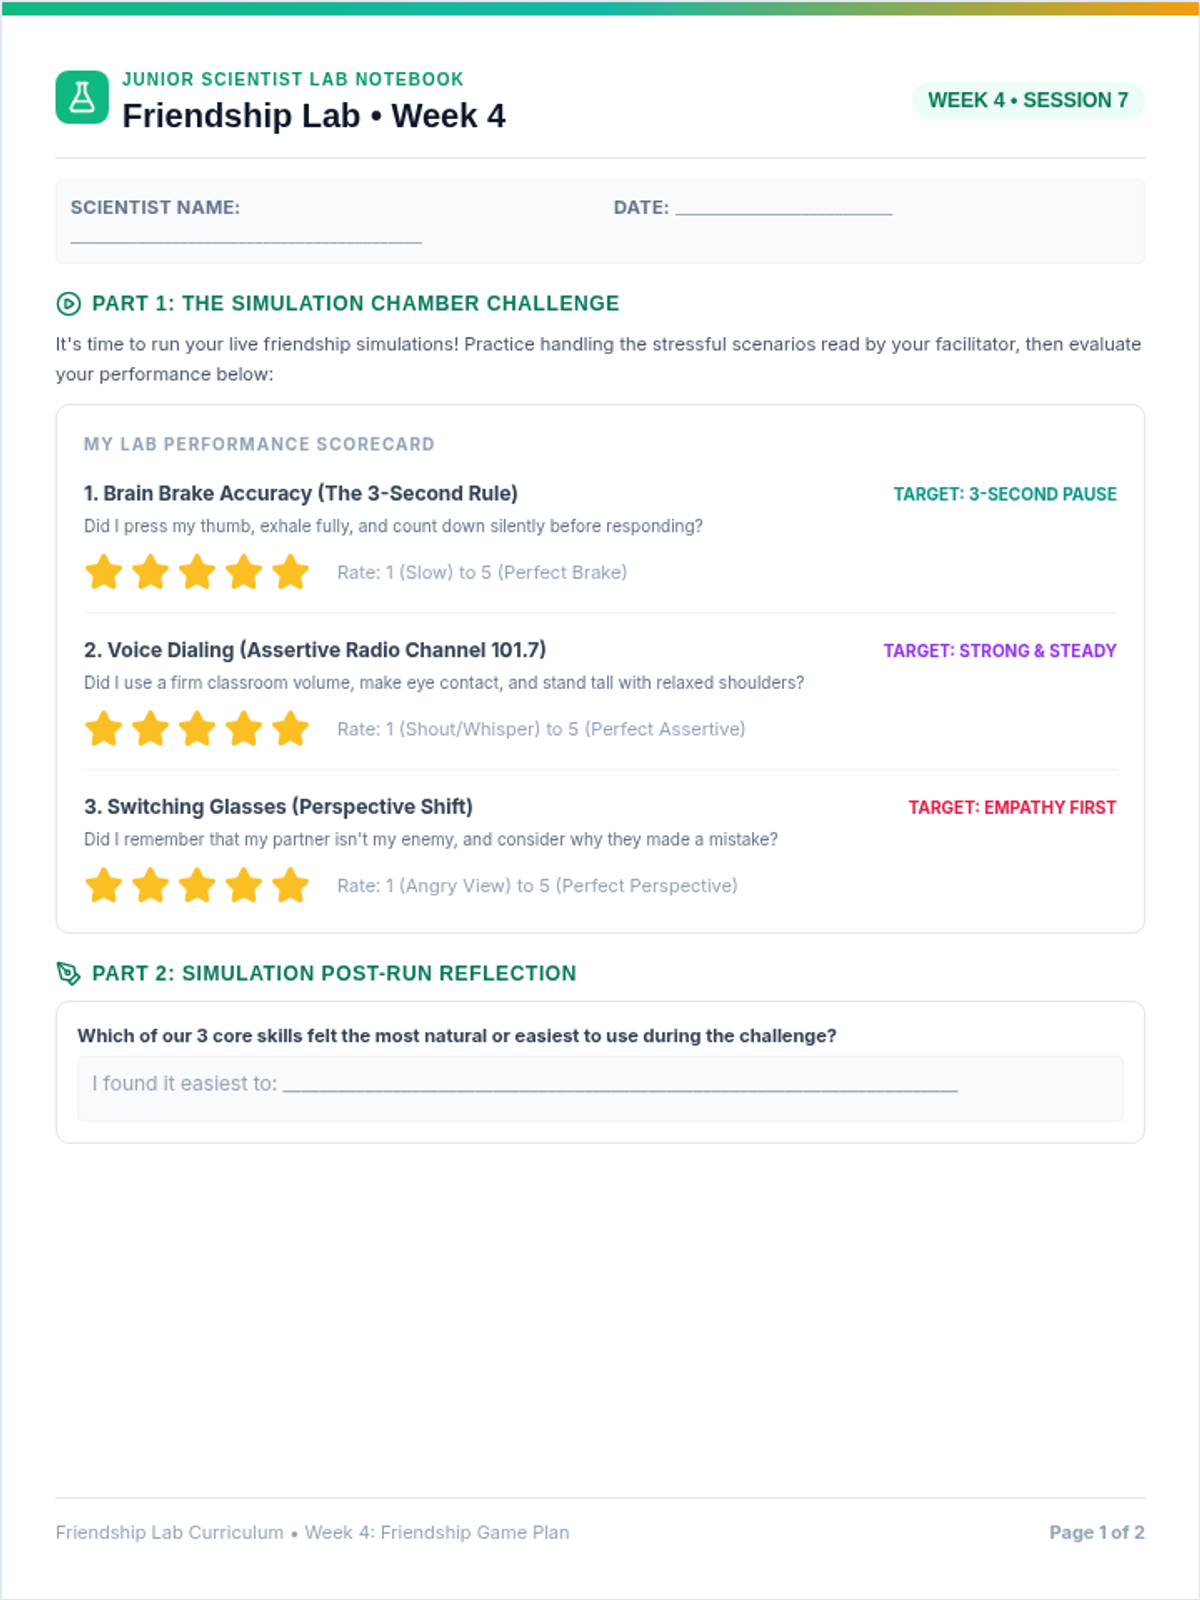
Week 4 of the program, focusing on real-world practice, synthesizing pause strategies and assertive communication, and creating a shared friendship blueprint for future interactions.
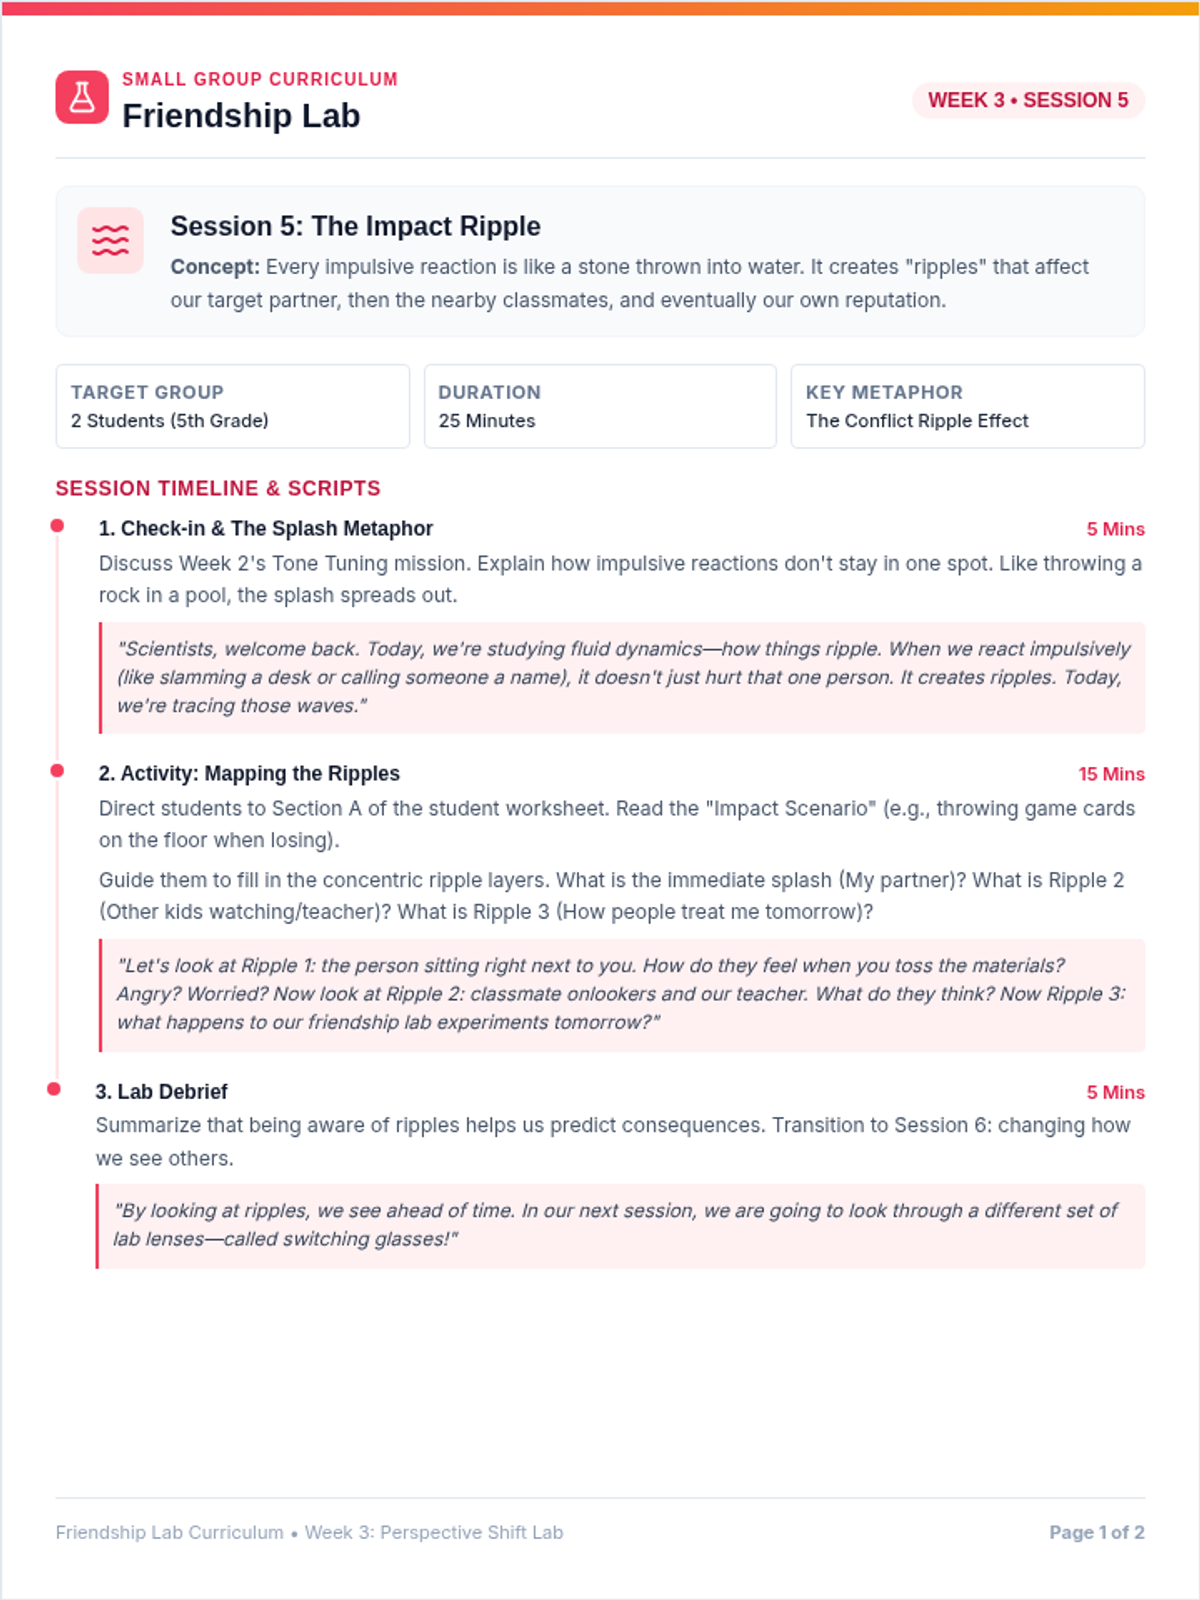
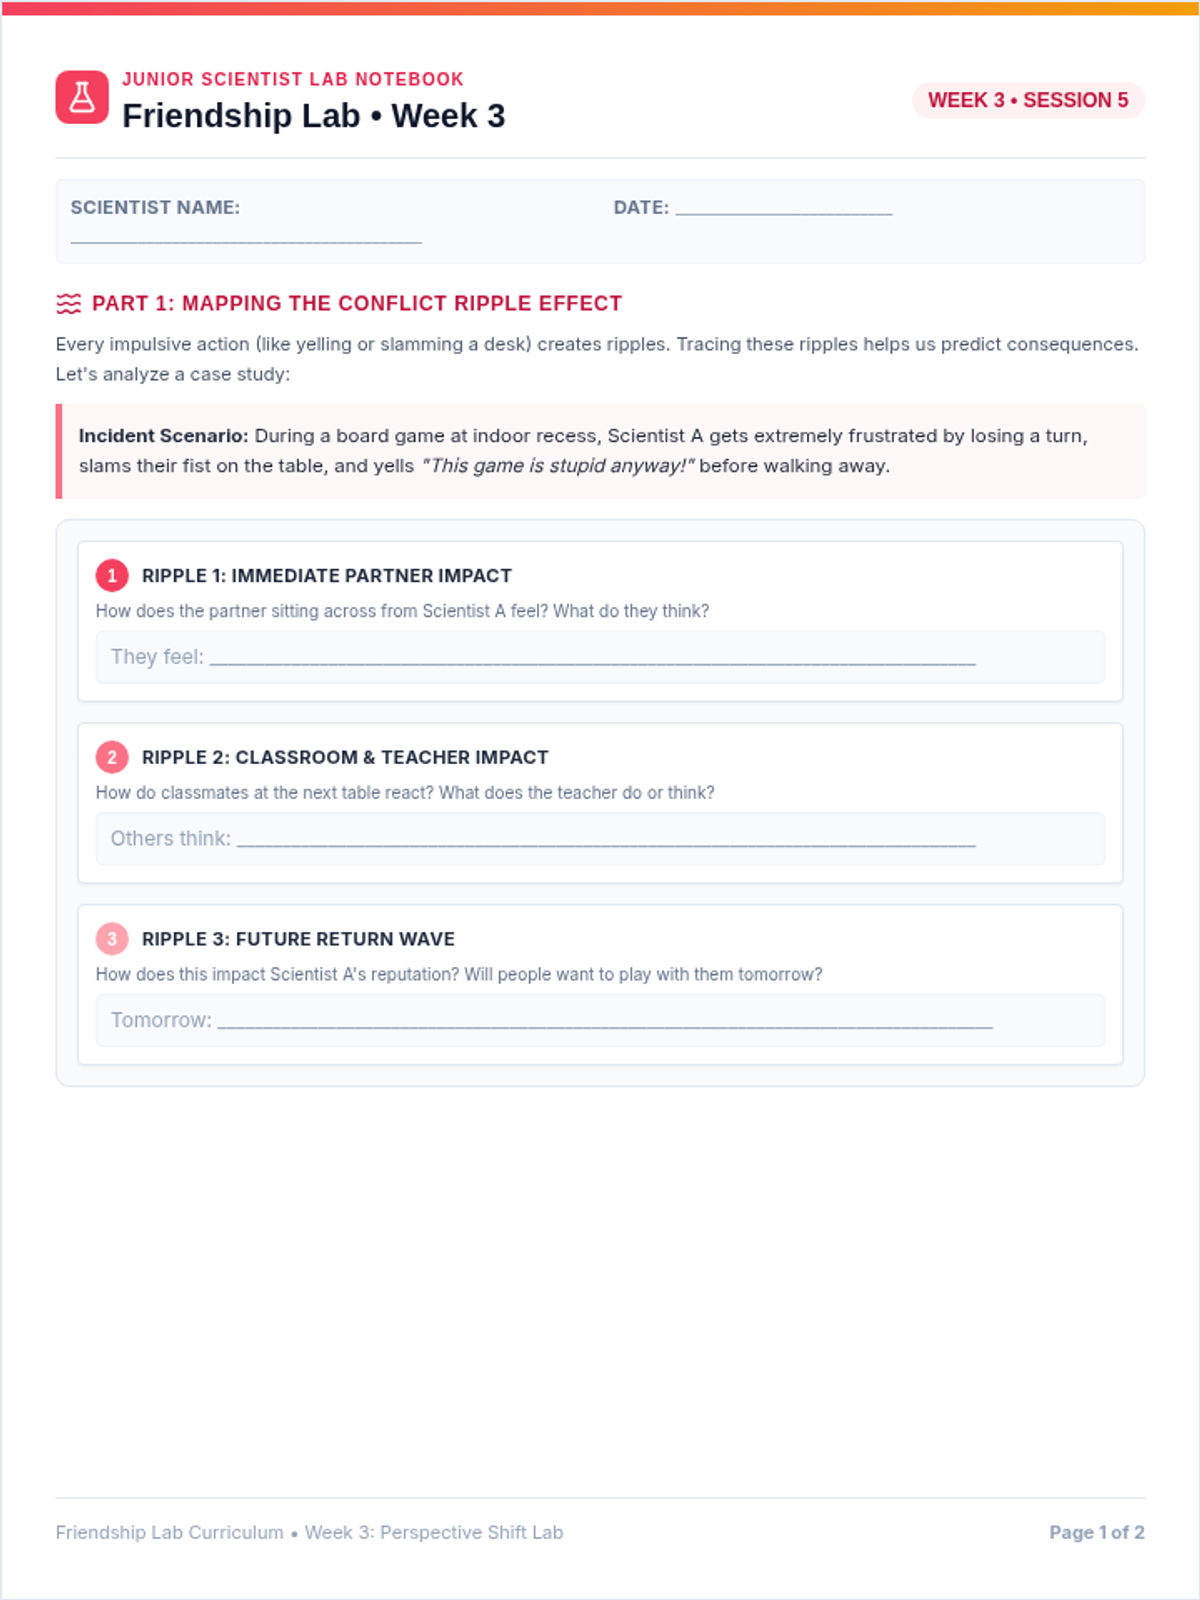
Week 3 of the program, focusing on perspective-taking activities to help students understand how their impulsive actions affect their partner's feelings and ripple out.
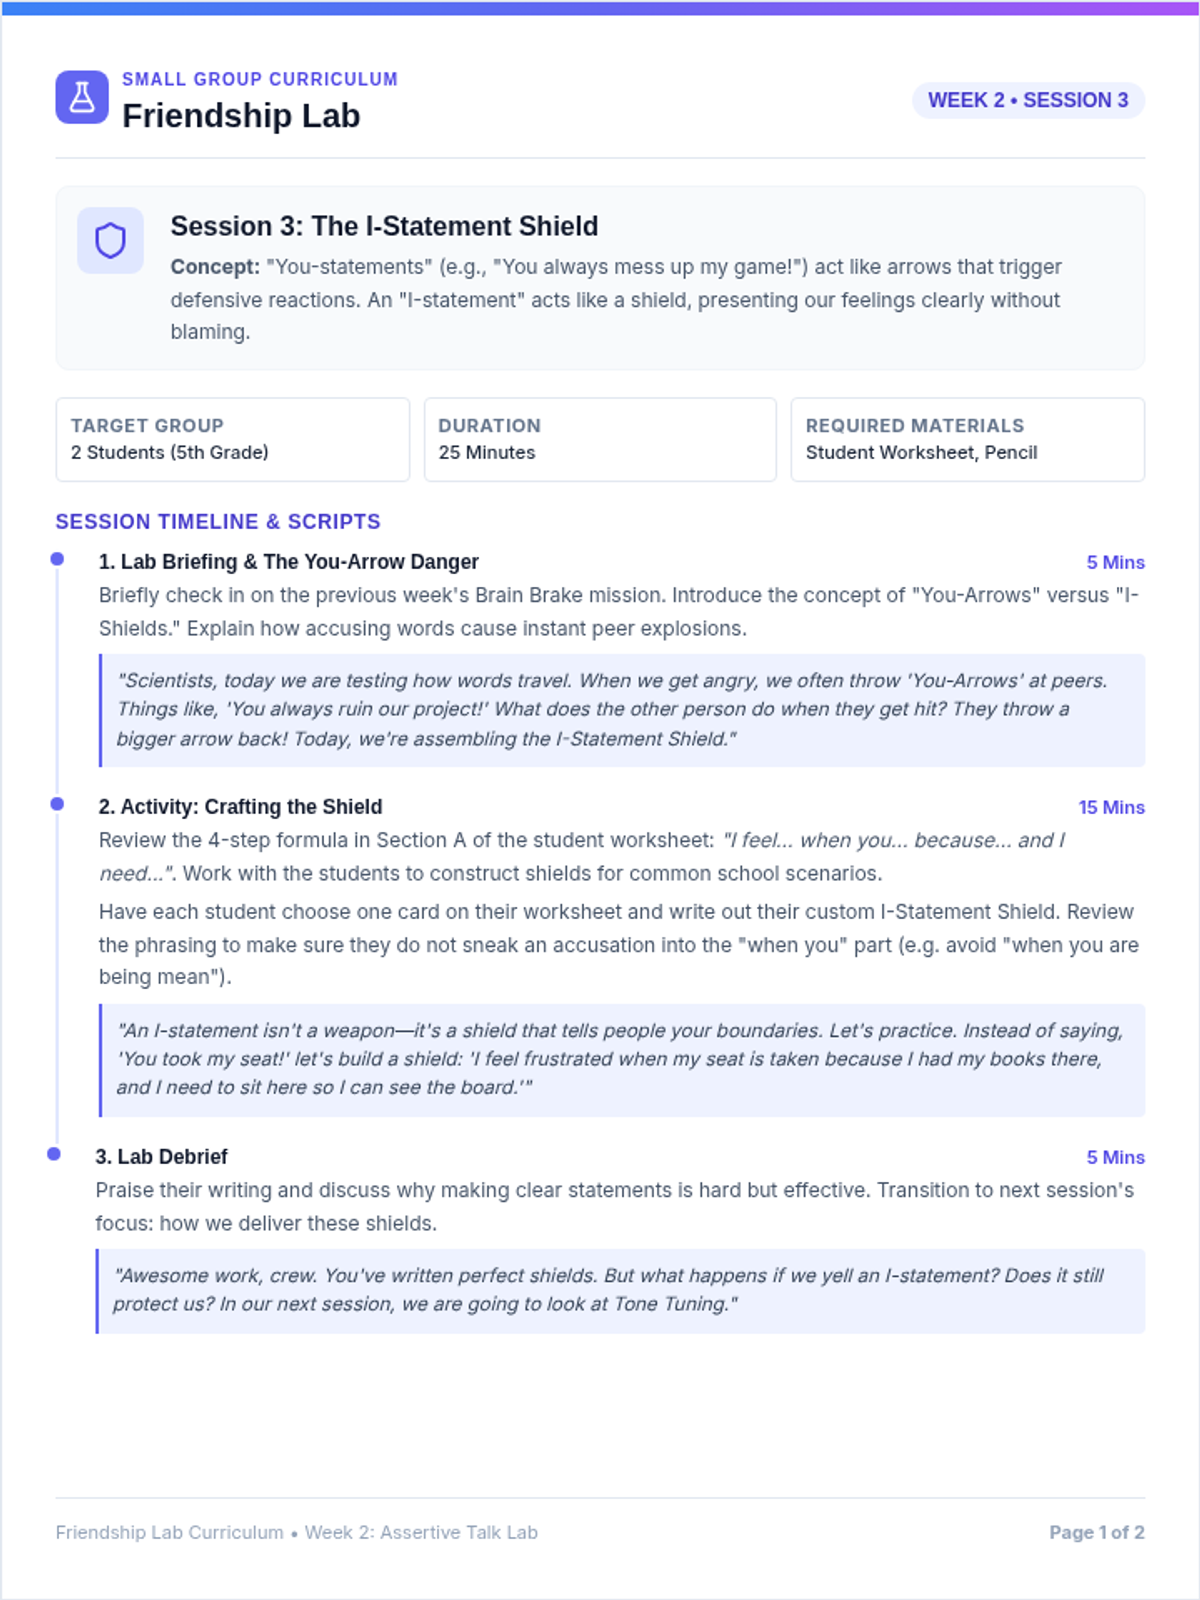
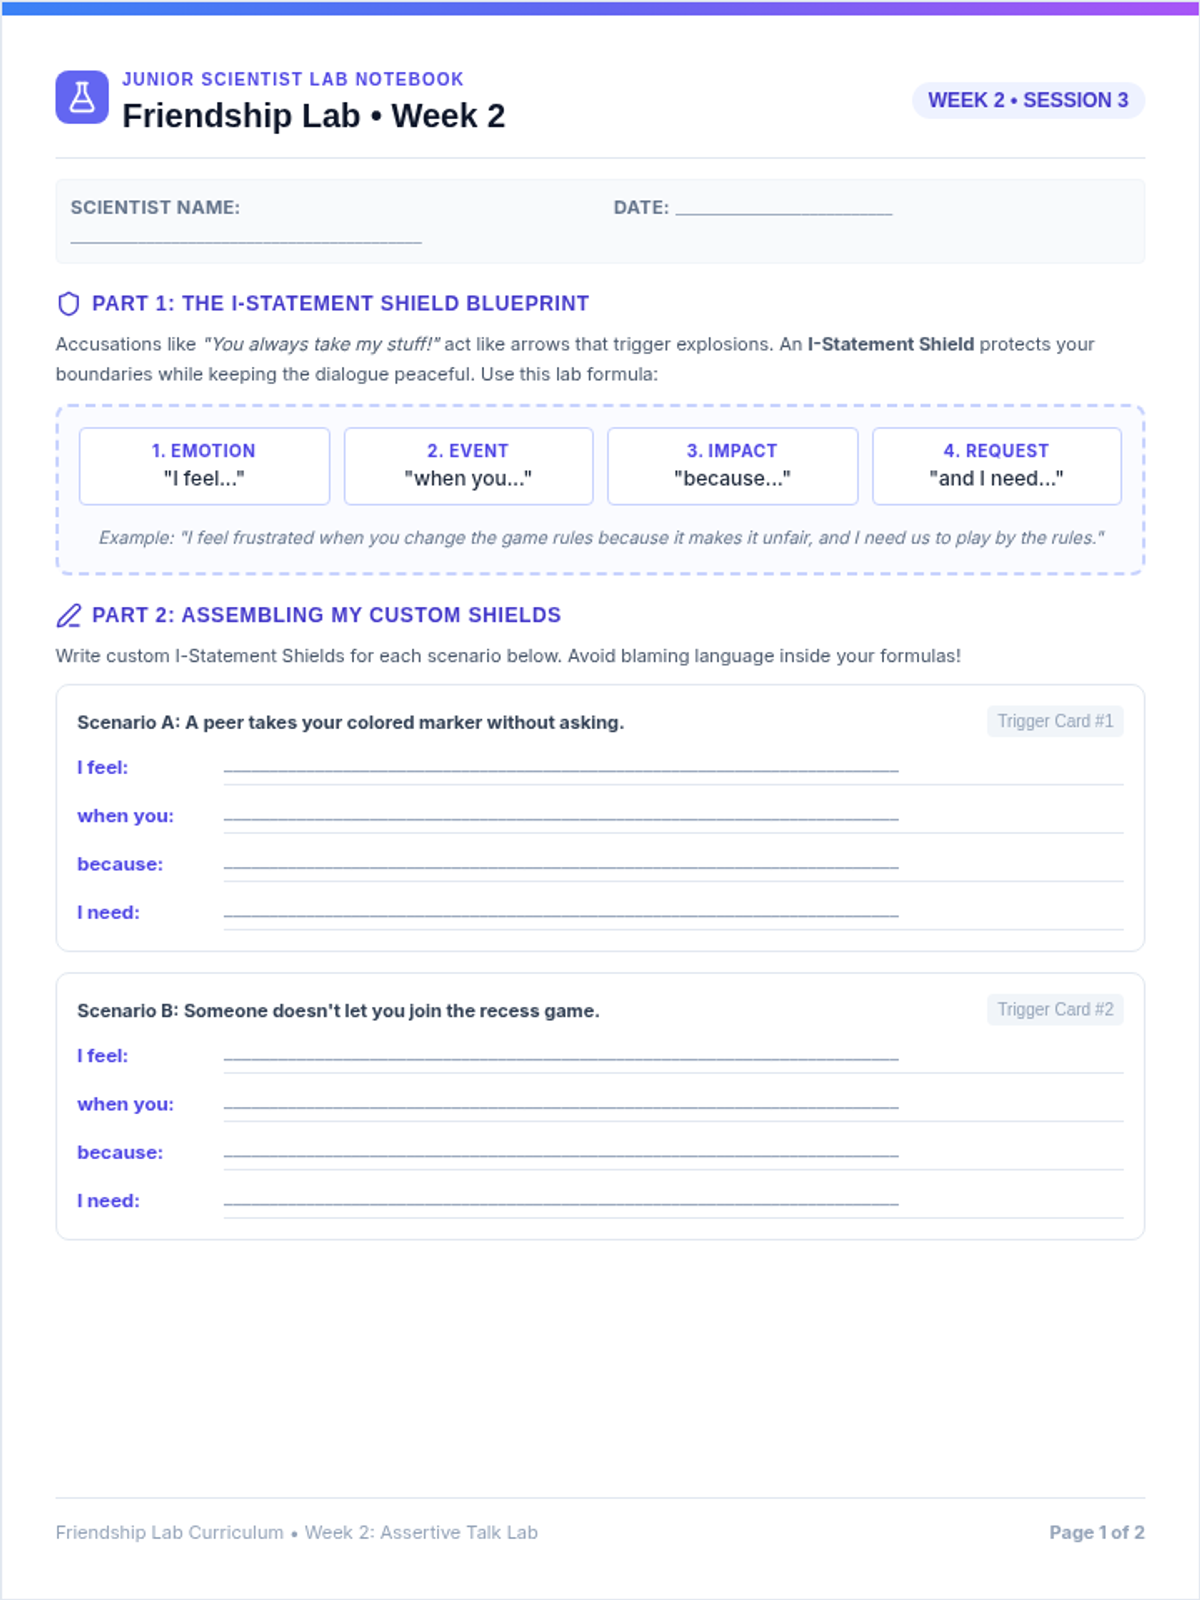
Week 2 of the program, focusing on learning and practicing assertive communication skills, specifically crafting and using 'I-statements' and modulating tone/posture to prevent conflicts.
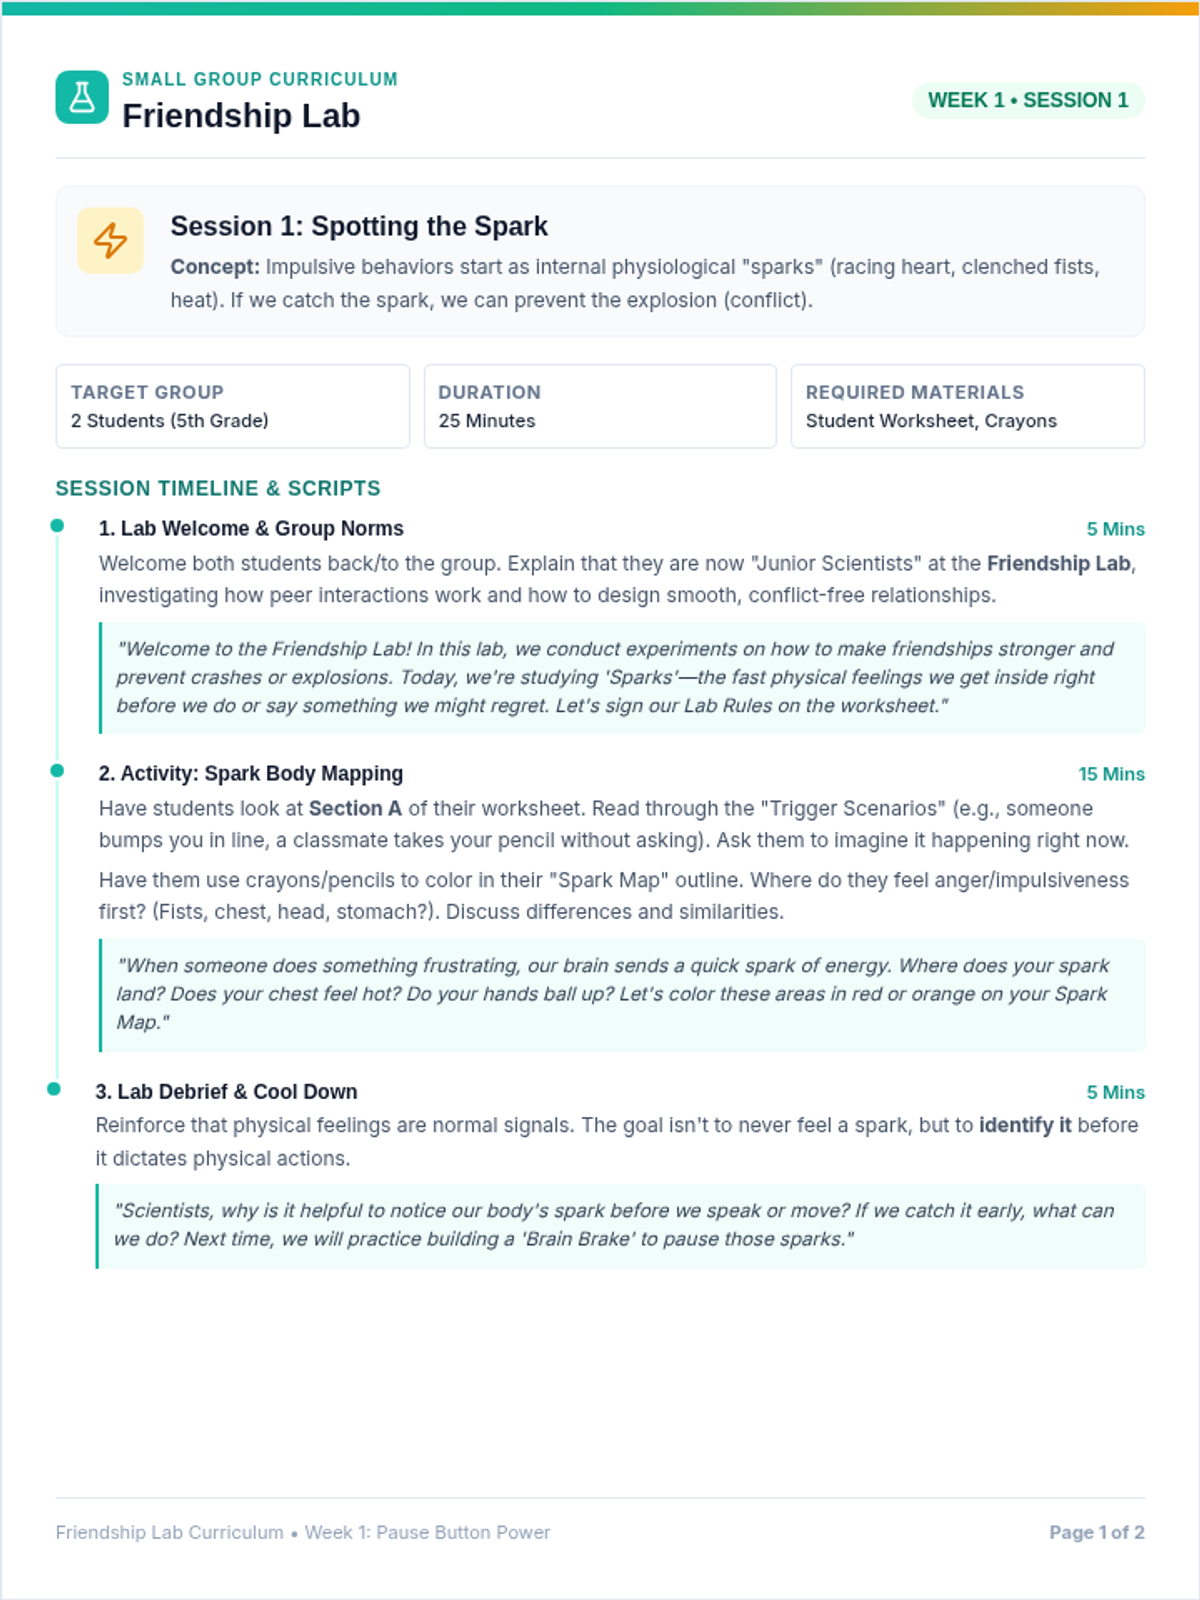
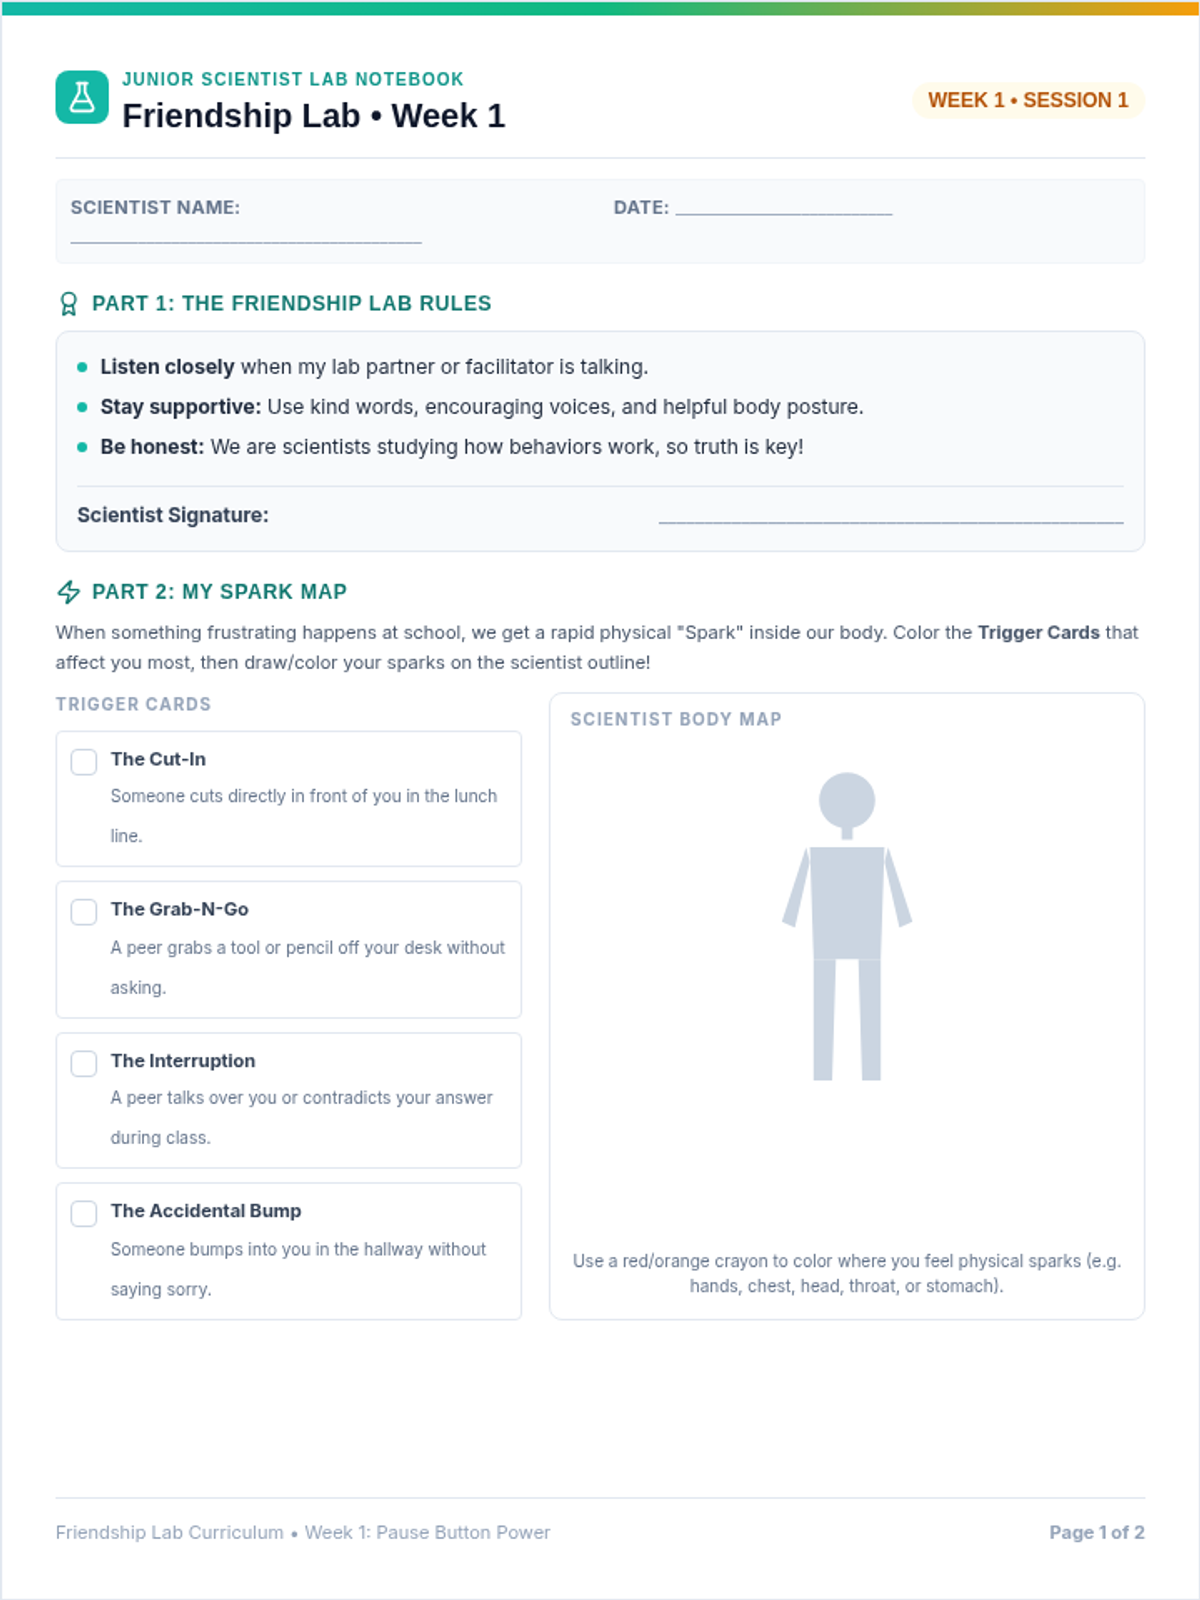
Week 1 of the program, focusing on identifying internal physical 'sparks' of anger/impulsivity and applying physical and mental 'stop' cues (the 3-second pause) before reacting to peers.
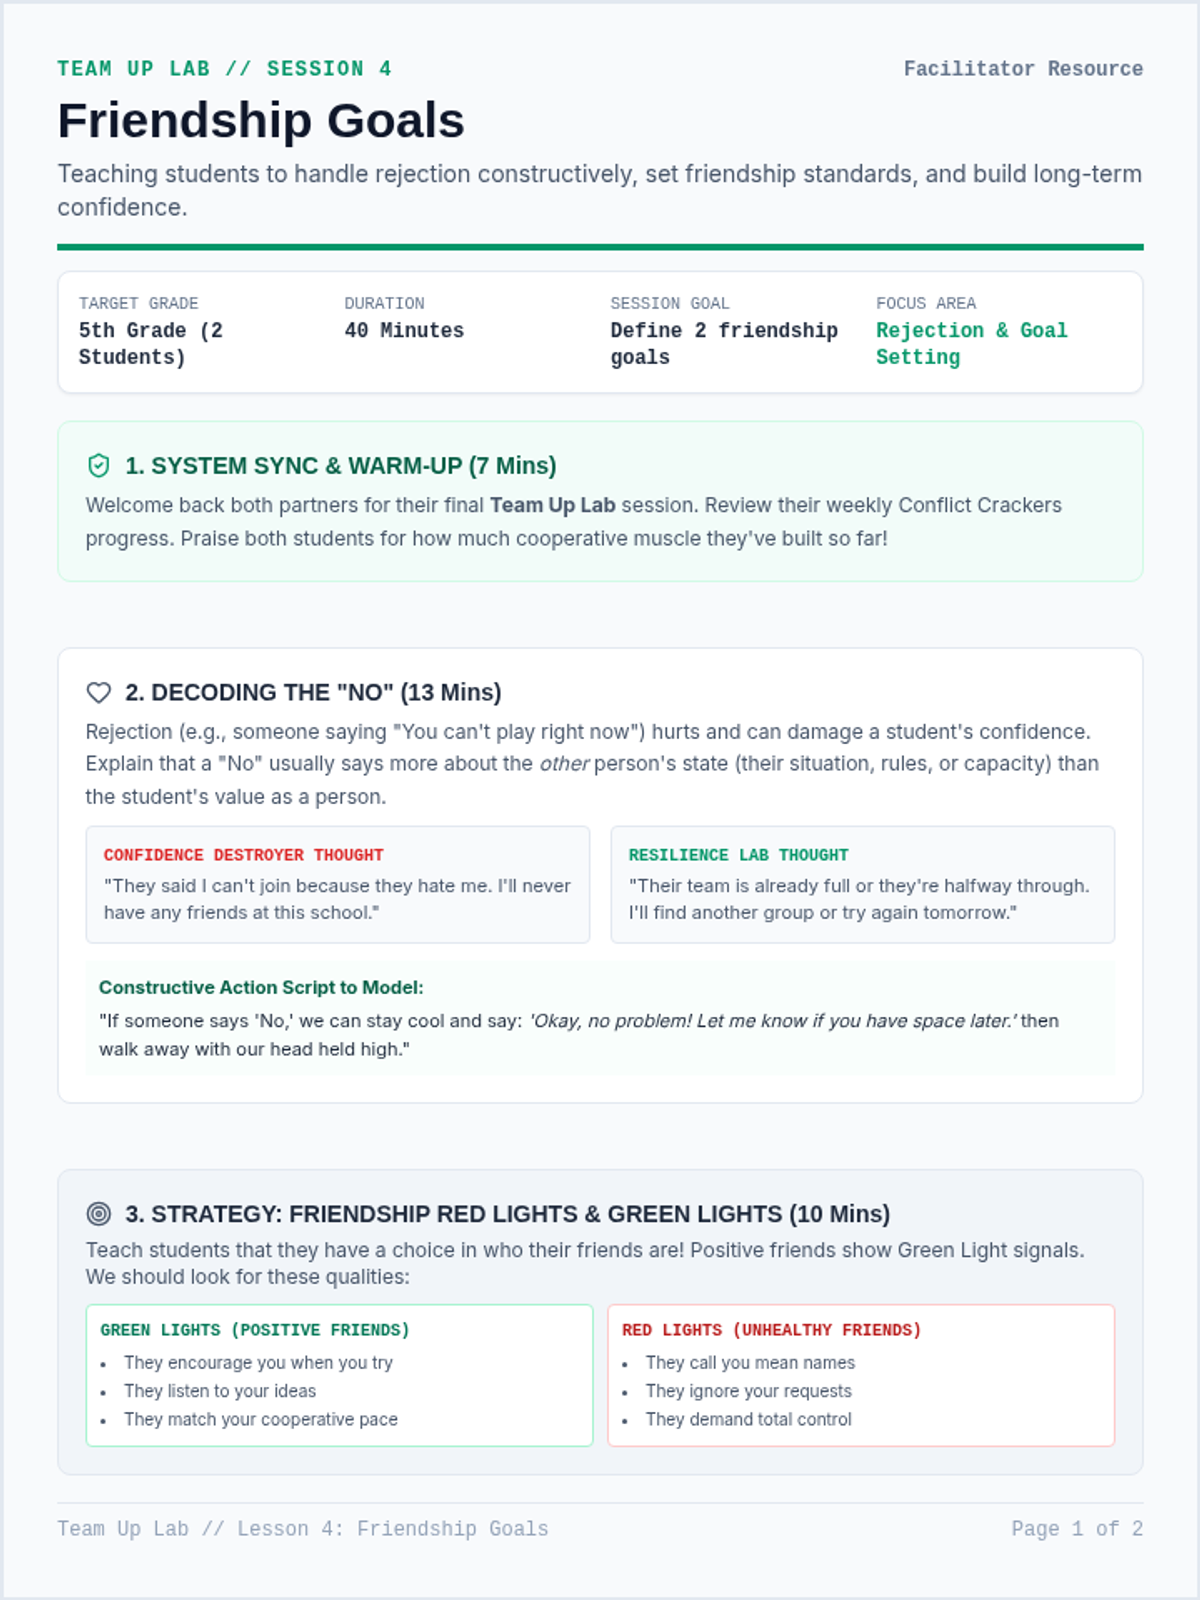
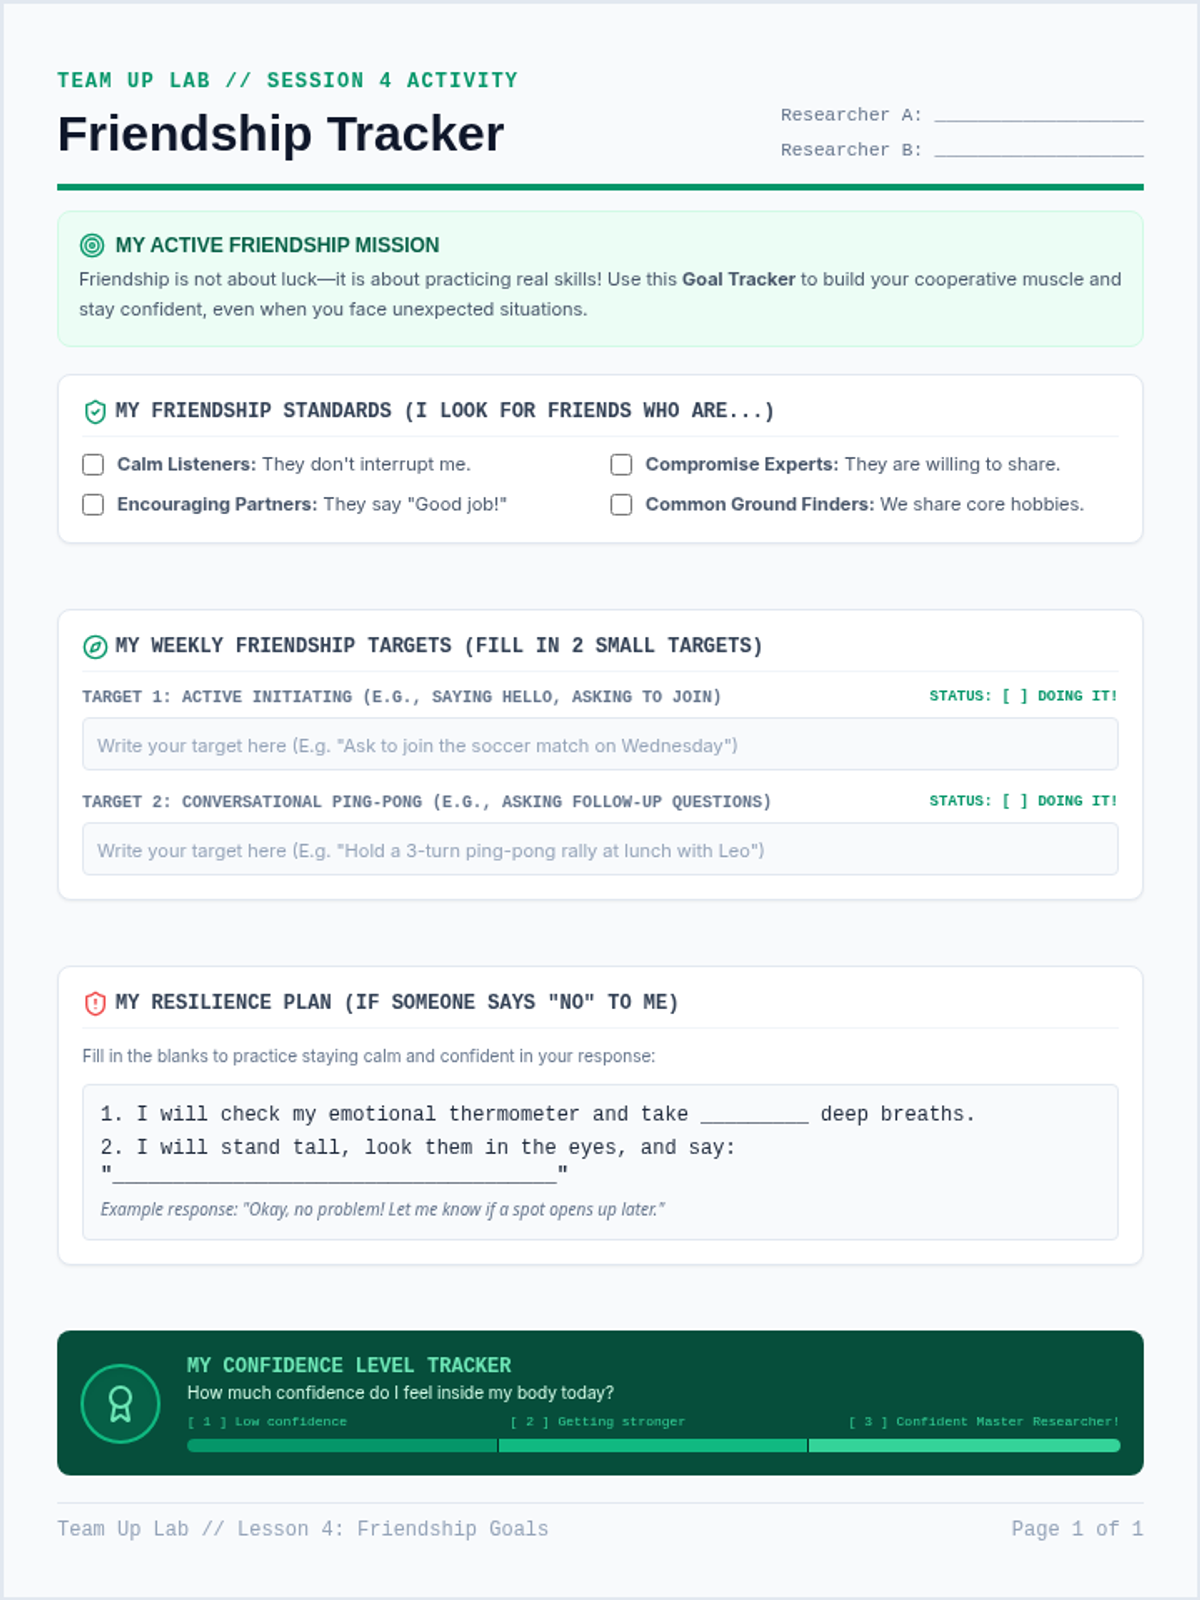
Empowers students to respond constructively to peer rejection, set realistic friendship goals, and track their self-confidence.
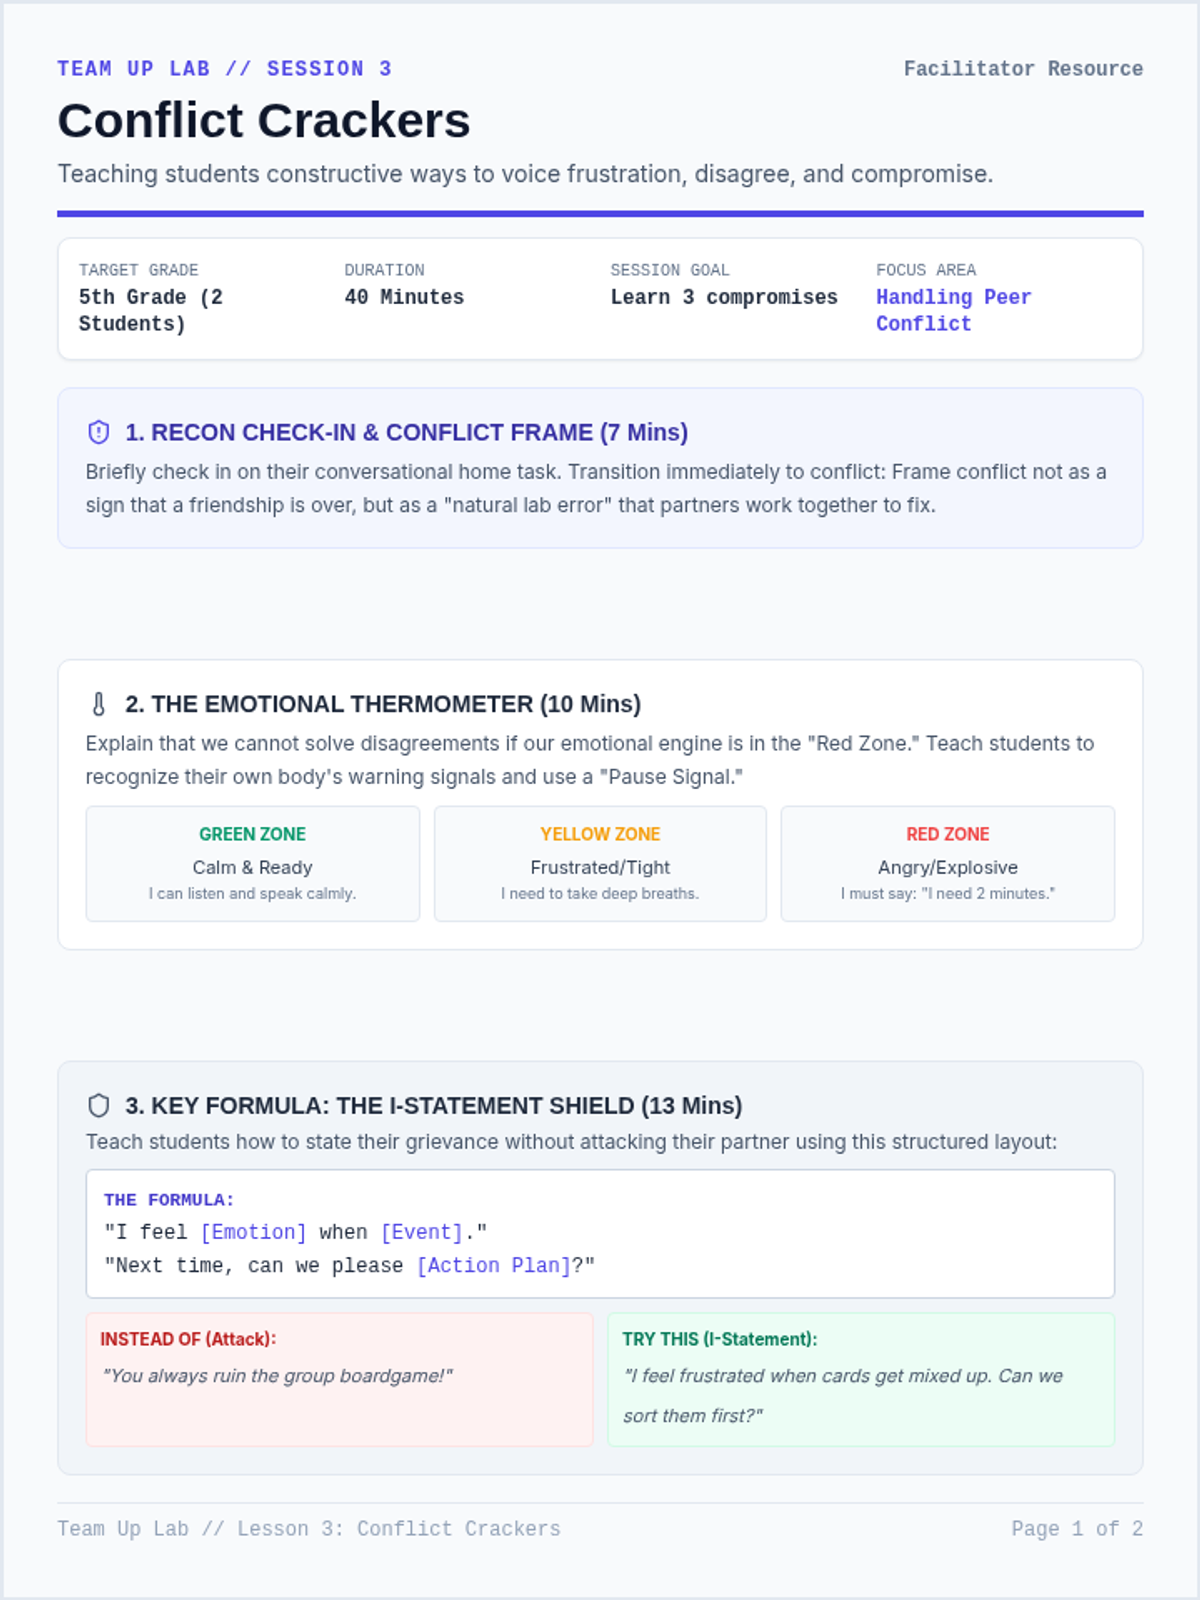
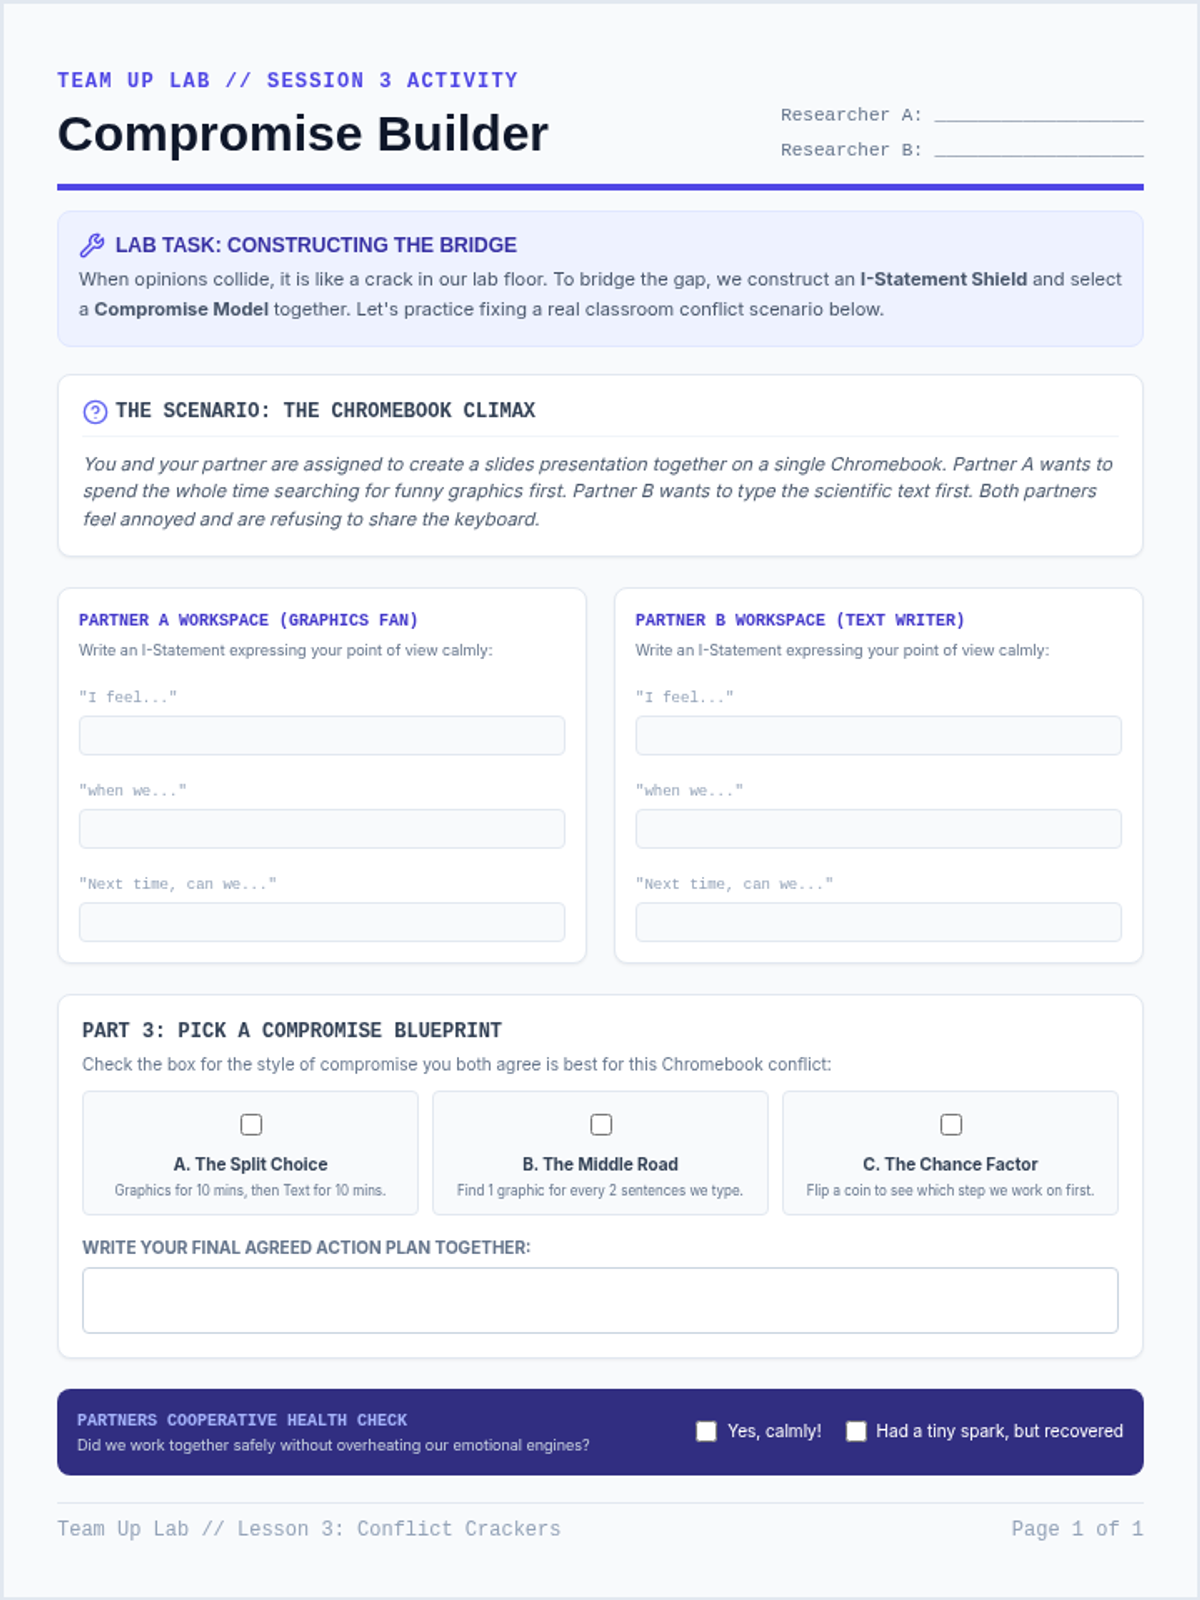
Equips students with practical tools to manage disagreements, practice compromise, and express frustration constructively.
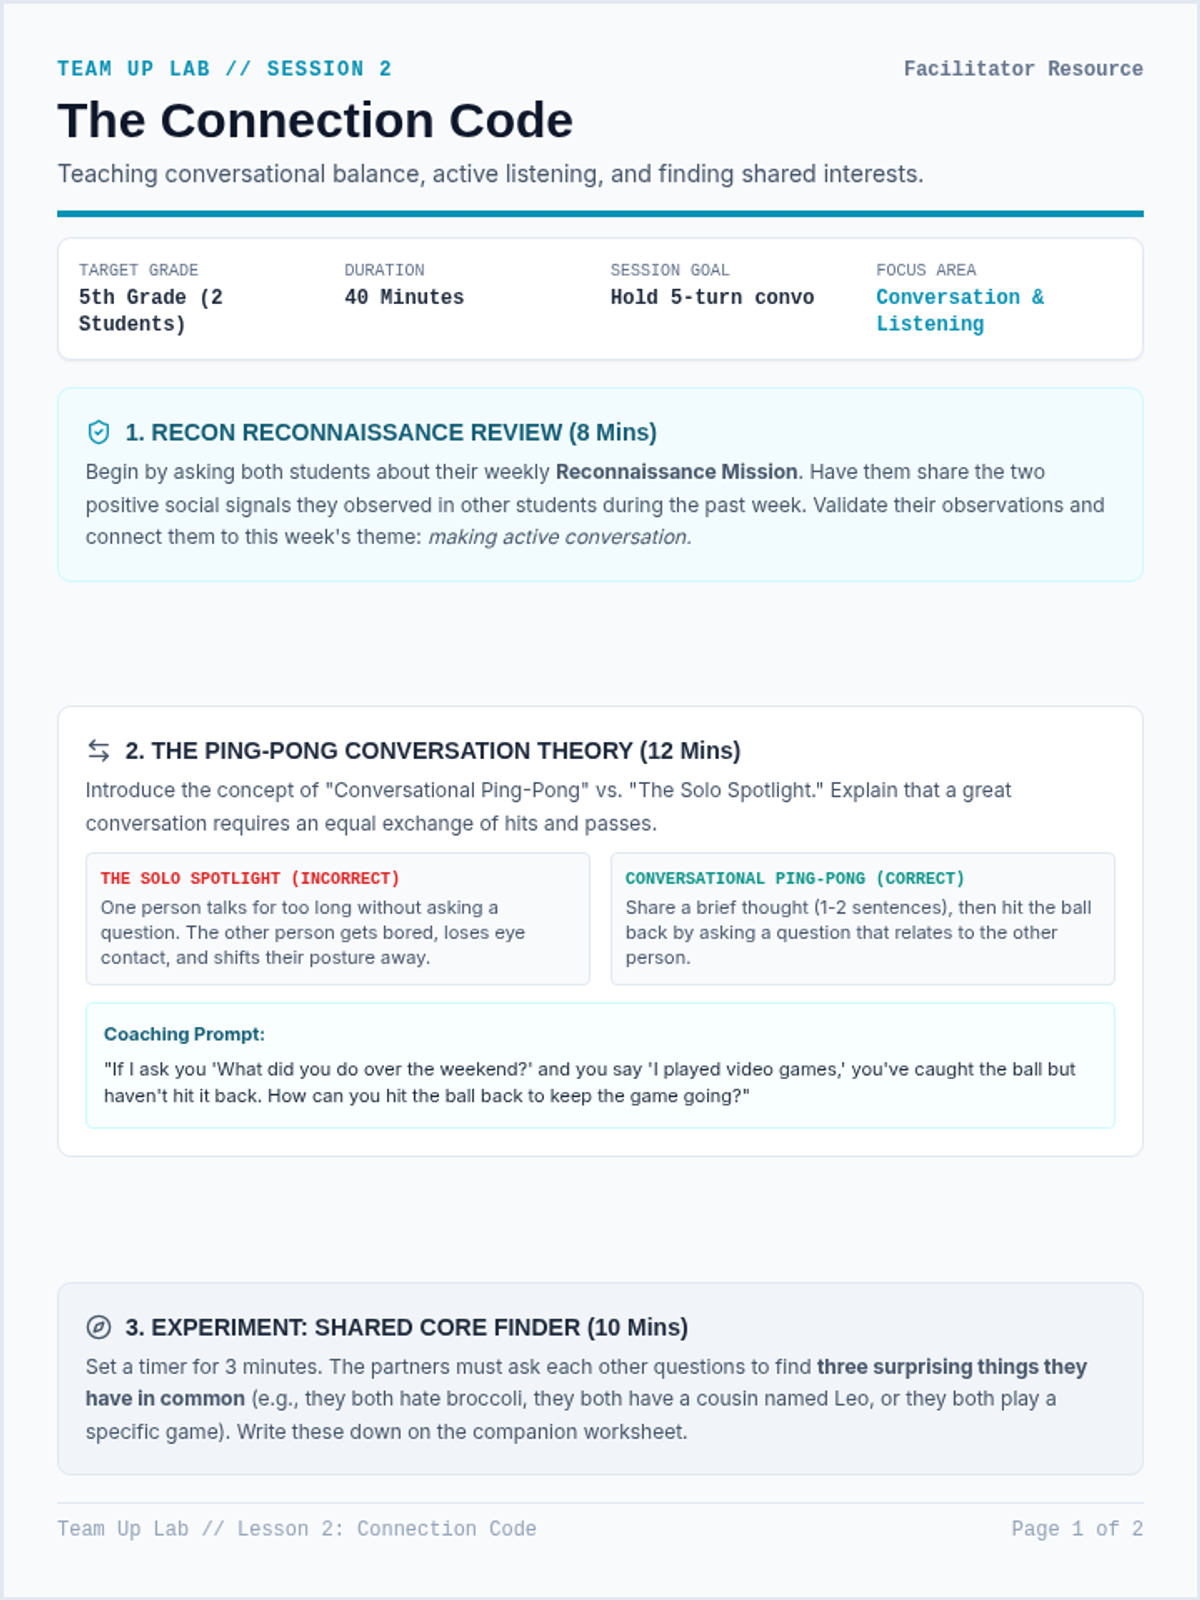
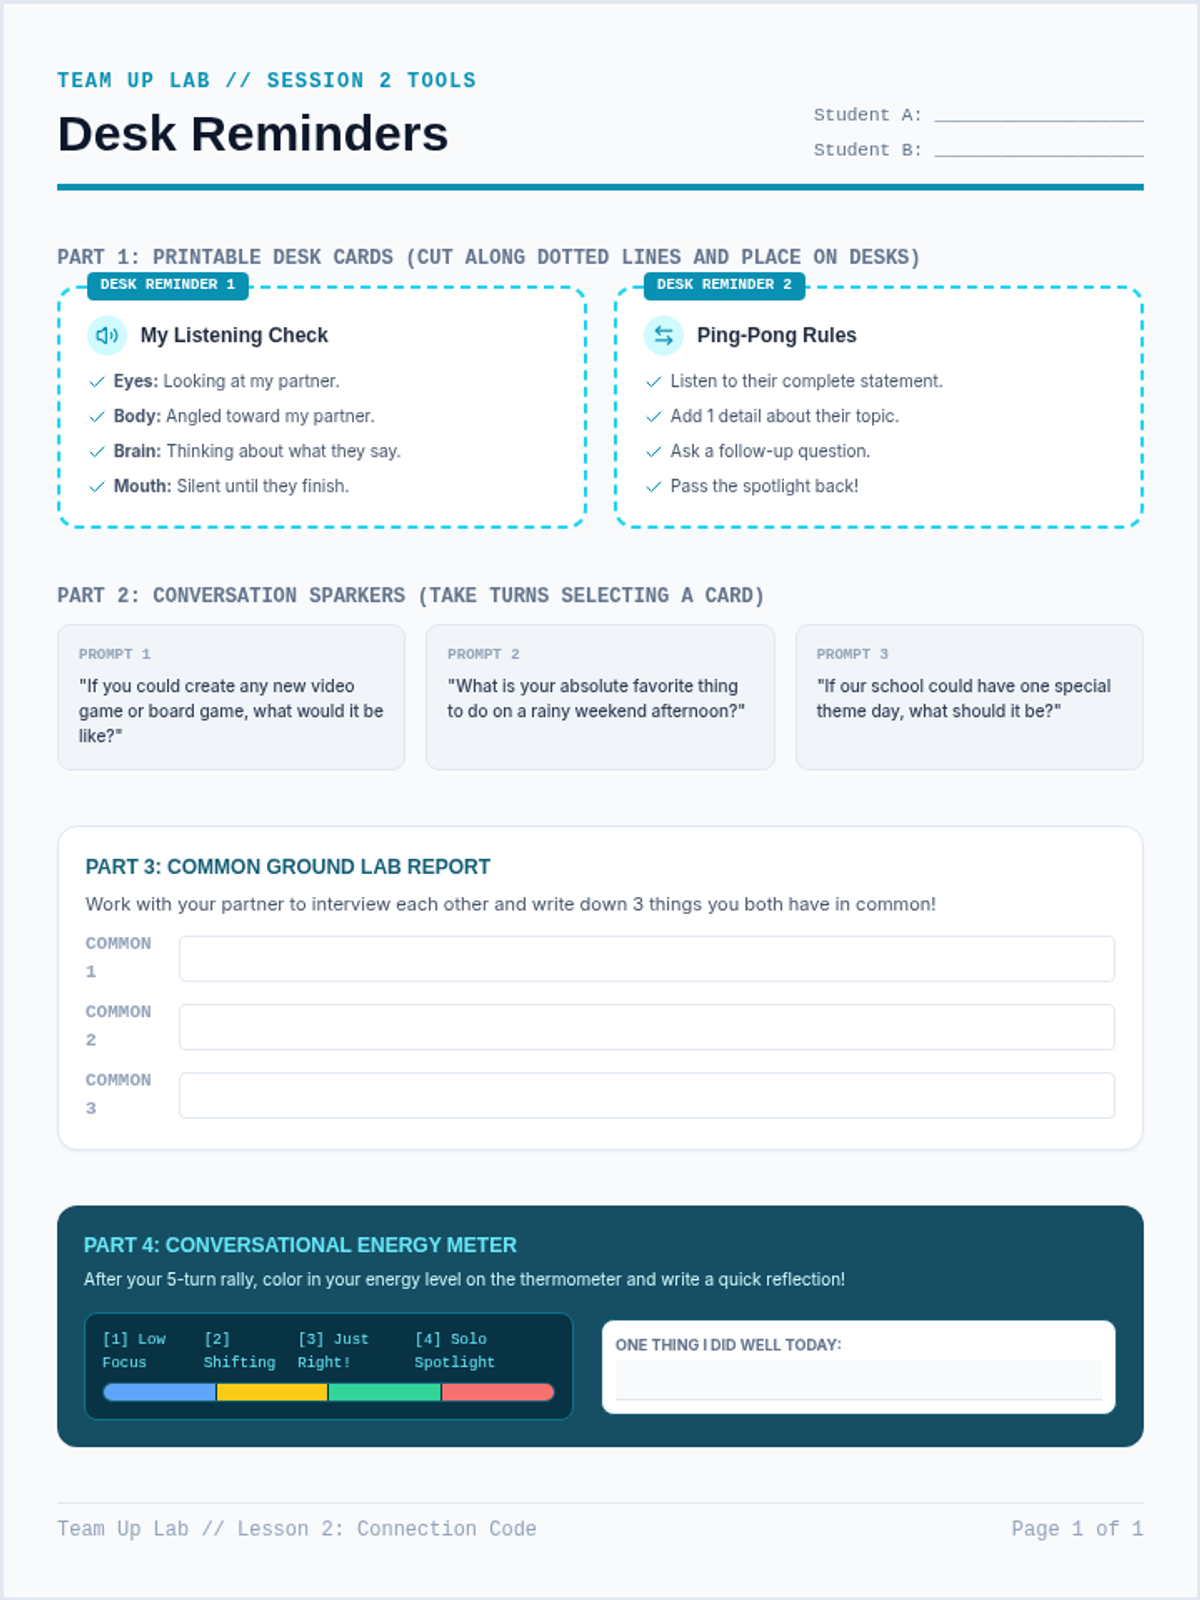
Teaches the mechanics of conversational exchange, finding common interests, and using visual desk reminders for active listening.
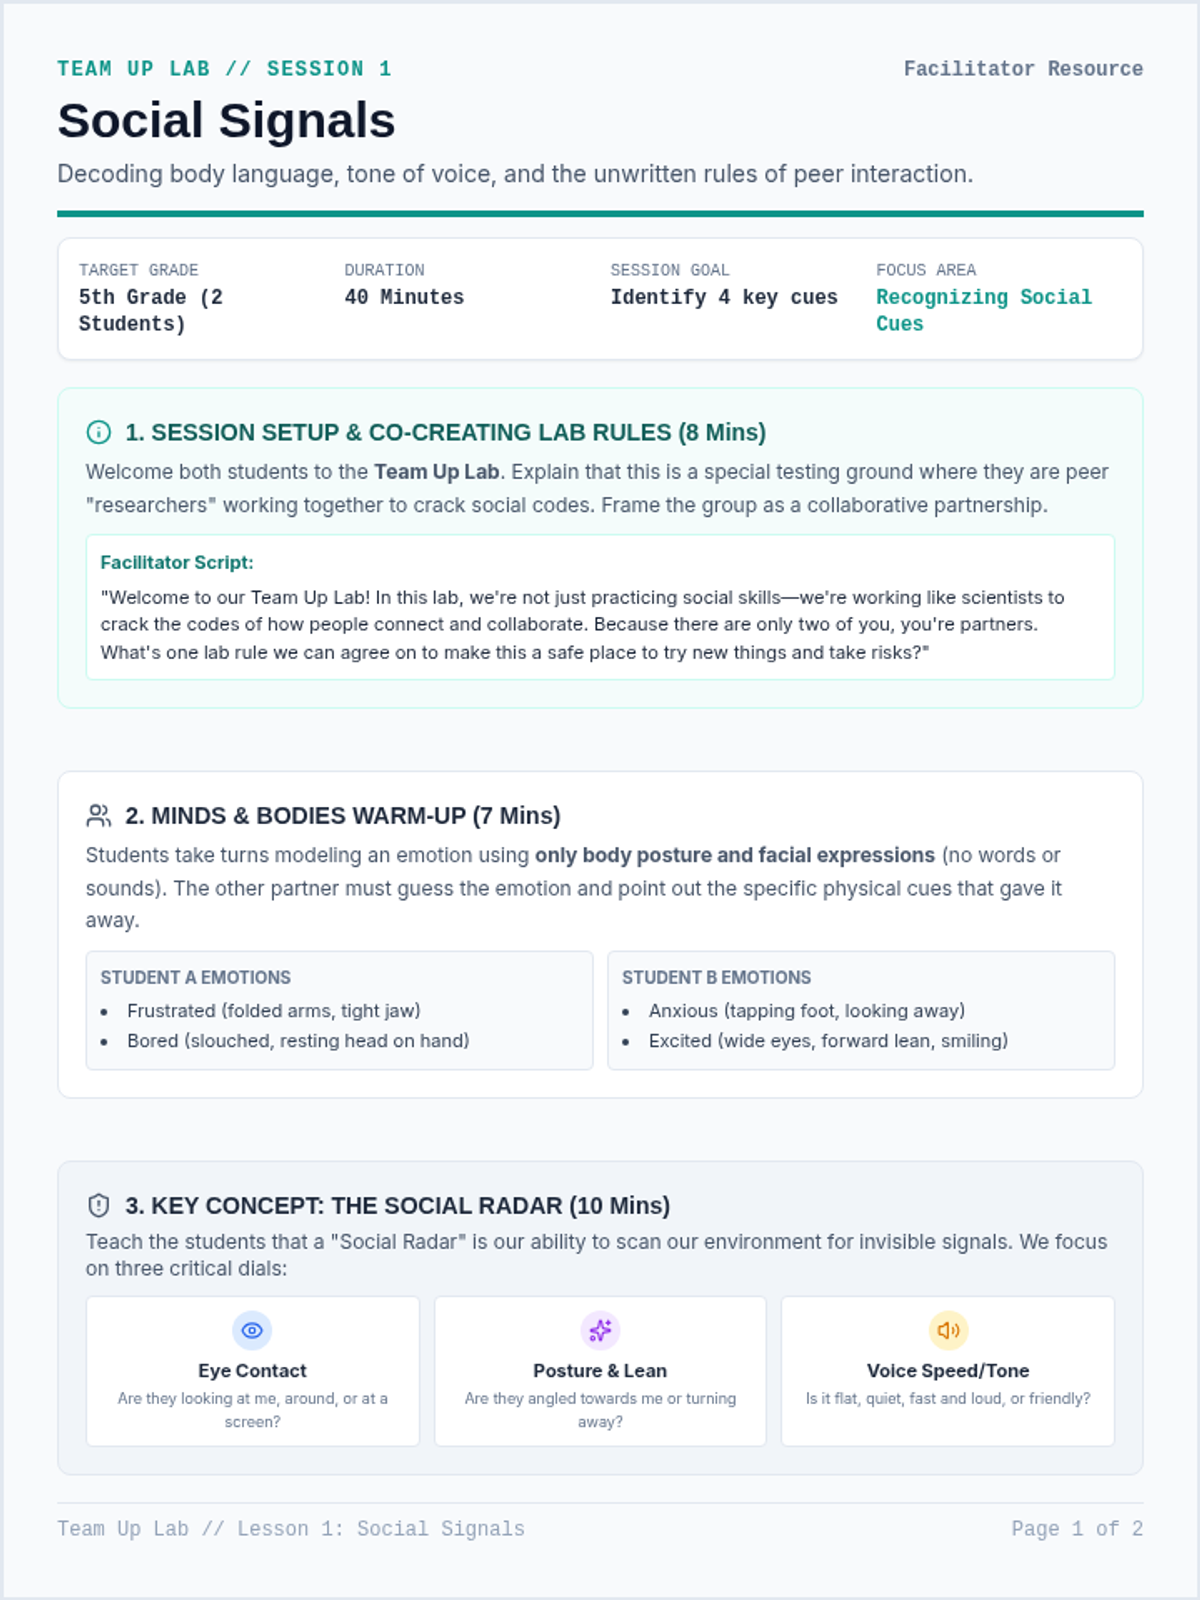
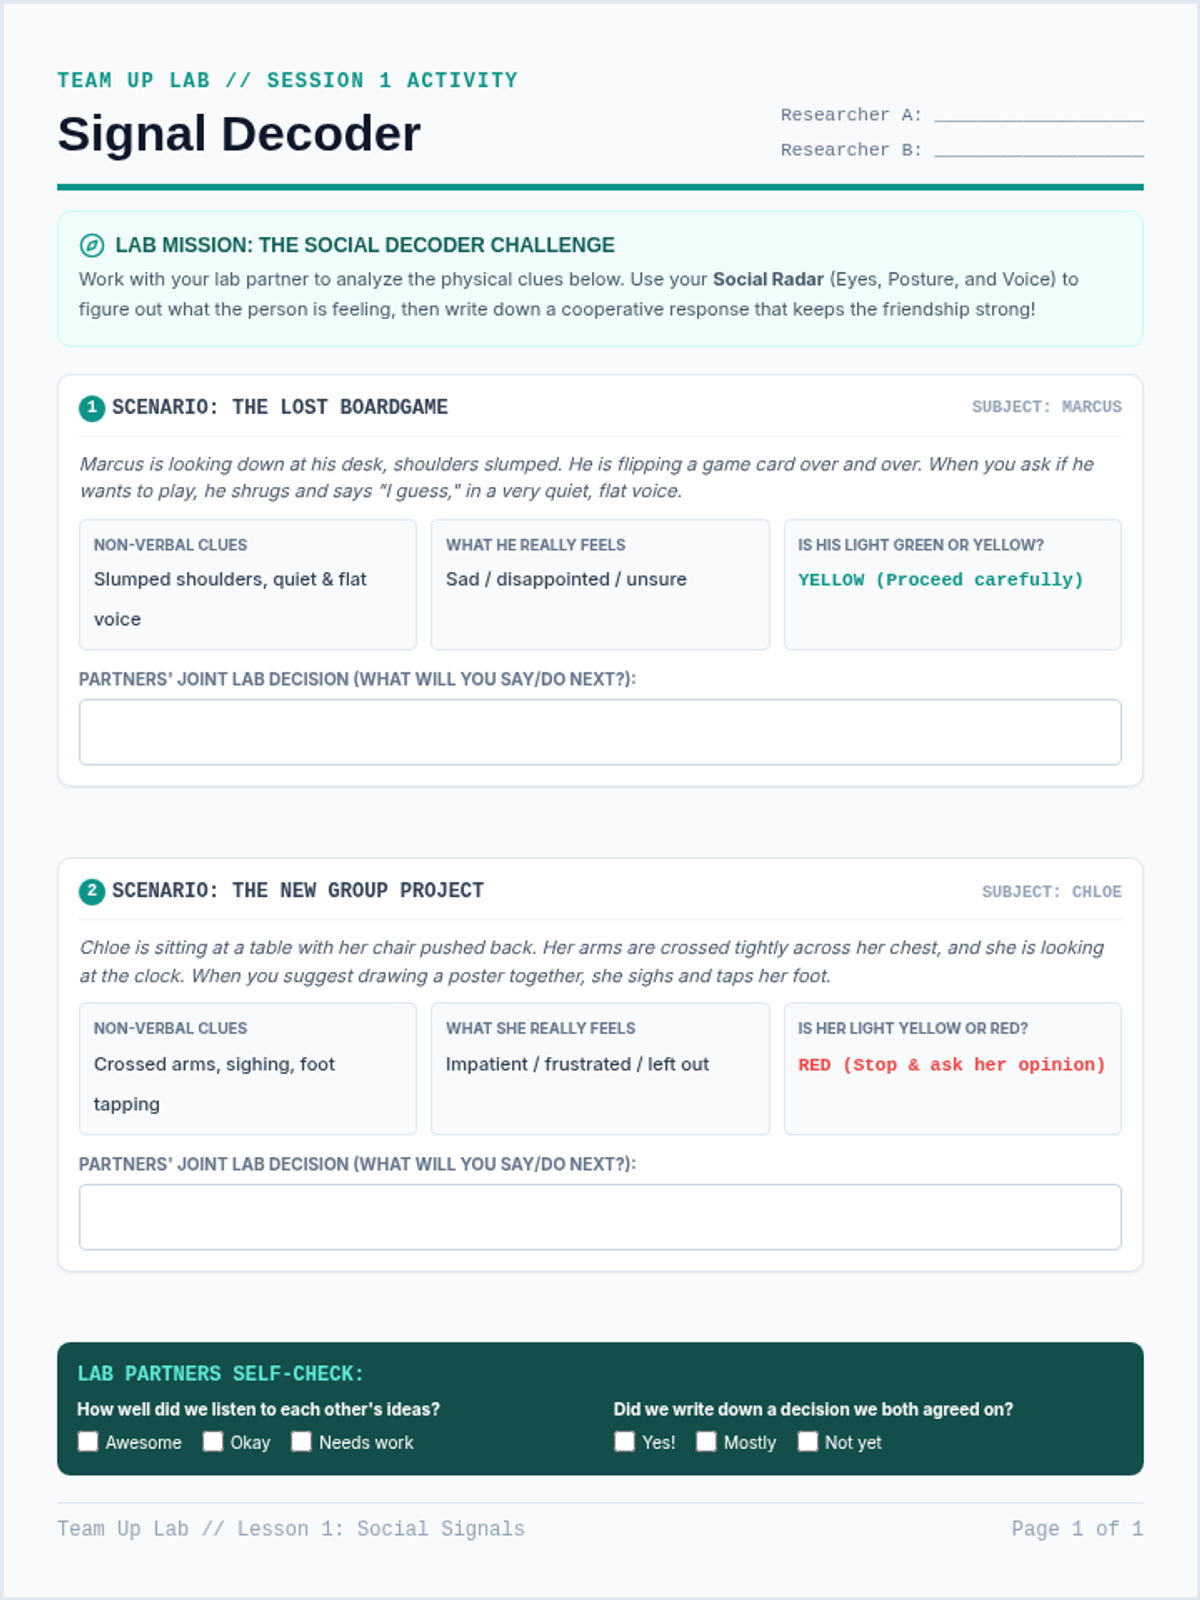
Focuses on reading non-verbal cues (body language, facial expressions, tone of voice) and understanding unwritten social rules in small group settings.